Optical Modeling and Detection of Infrared and Other Spectra
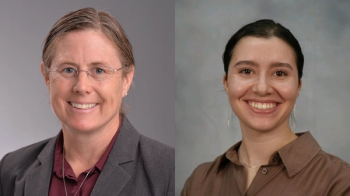
Timothy J. Johnson and Tanya L. Myers, the 2019 winners of the Applied Spectroscopy William F. Meggers Award, have been exploring novel methods using infrared (IR) and visible reflectance spectroscopies for identification of target chemicals through derivation of the n and k optical constants. For their winning paper, Johnson and Myers created a spectroscopic library of 57 liquids for which they measured the complex refractive index, data that can be used for optical modeling and other purposes. They shared some of the details of their work with Spectroscopy.
Modeling, rather than measuring infrared (IR) and other spectra in order to account for morphological forms that may be encountered for solids as well as substances that incorporate at least one liquid phase, including bulk mixtures, aerosols, thin films on substrates and others, has become the technique of choice, compared to measuring. Timothy J. Johnson and Tanya L. Myers, the 2019 winners of the Applied Spectroscopy William F. Meggers Award, have been exploring novel methods using infrared (IR) and visible reflectance spectroscopies for identification of target chemicals through derivation of the n and k optical constants. For their winning paper, Johnson and Myers created a spectroscopic library of 57 liquids for which they measured the complex refractive index, data that can be used for optical modeling and other purposes. They shared some of the details of their work with Spectroscopy.
In a recent paper (1), you and your team discuss your creation of a library of 57 liquids in which you measured the complex optical constants n (the real component) and k (the complex component, proportional to absorption) for your selected library of compounds. These were determined to allow modeling of most optical phenomena in media, and their corresponding interfaces of reflection, refraction, and dispersion. Can you describe how this work is an advancement or benefit for spectroscopists?
Accurate values of the optical constants are critical for modeling the real-world reflectance spectra of liquids, since liquid species can occur in many forms. The research represented in this paper helps fulfill this need by providing a spectral database of the optical constants that can be used by researchers around the world to better detect and identify (hazardous) chemicals using infrared spectroscopy.
Would you explain to the readers of Spectroscopy why specifically it is important for spectroscopists to use the optical constants of n and k to model optical phenomena at interfaces such as reflection, refraction, and dispersion?
Due to the phenomena of reflection, refraction and absorption, the amplitude and spectral composition of light changes every time light passes between two media with different refractive indices. The refractive index is actually a complex quantity with n representing the real component corresponding to dispersion and the complex component k corresponding to absorption. The amplitude of n and k in the two media determine how much of the light is reflected/refracted/attenuated at each interface and in each medium. Calculations are necessary to model the phenomena because the geometric form for both solids and liquids are seldom found as a homogenous medium as are gases. Rather, solids and liquids can manifest not only as bulk but also as particles, droplets, spheroids, mists, aerosols, thin layers, thick layers, and so on. Each one of the forms represents complex geometric interfaces for media of different refractive indices and thus different amounts of reflected light with different spectral content. To move beyond all but the simplest forms such as bulk, physical models are needed to calculate the many effects using n and k.
How did you go about selecting your set of 57 liquids for determination of n and k?
The list of chemicals was actually selected by an ad-hoc group of scientists working for an Intelligence Advanced Research Projects Activity (IARPA) program to improve standoff infrared laser detection of chemicals and chemicals on surfaces. However, we did endeavor to ensure that the list of liquids was “chemically diverse” by including both inorganic and organic species with varying functional groups (alcohols, ketones, amines, sulfur, and phosphorous compounds and others). We also worked to ensure that the list included chemicals of significantly differing physical properties such as viscosity and boiling point.
How does your approach differ from the literature or other published work? What is it about your approach that makes the calibrated liquid n/k values you obtained more useful or accessible for different applications than previous work or estimations?
In the first instance, our methodologies were based largely on the work of Professor John Bertie and colleagues at the University of Alberta as published in the 1990s. Indeed, some of the software programs to derive the n/k values from the measurement were downloaded from his freeware site. However, we improved these protocols by i) creating and using shorter cells (for the strong absorbers), ii) using multiple-path lengths (up to 10) to account for both strong and weak absorbers and to improve the signal-to-noise, iii) improving data reduction methods that resulted in spectra that are more linear in k across different parts of the spectrum by intra-calibrating absorption bands of different strength, and iv) using an improved multi-wavelength approach with a Sellmeier fit to obtain the best scalar value of n at the highest wavenumber used in the measurement, and finally v) applying extensive QAQC methods to vet the n/k data. The end product is a set of liquids n/k data that have greatly improved linearity and higher fidelity than previously available. The data are publicly available both at the Applied Spectroscopy web site as supplemental material as well as at the NIST chemistry webbook site.
What were some of the main challenges you faced in obtaining n/k values for liquids with high confidence?
There were a few experimental challenges. In order to obtain linear responses for the very strong absorption bands, it was necessary to prepare liquid cells of very short path length, just a few µm. To achieve such short path lengths, we crushed the cells in a hydraulic press, and many of the cells (literally) cracked under pressure. A second experimental challenge was filling those very same cells: Because the gap between the windows was, for example, only 2 or 3 µm, we implemented a dual syringe technique to fill the cells that involved using the first syringe to inject the liquid and the second, which was connected to the outlet, to simultaneously withdraw the air and pull the liquid through. Filling such cells became quite problematic, especially for the highly viscous species. In addition, after filling the cells, the path length may have also increased, particularly for the short cells; thus, we employed an iterative approach to optimize the calculated path length values by minimizing the differences between measured absorbance values and those calculated using the Beer-Lambert law of absorption.
What would you say is the key benefit to spectroscopic measurements as a result of your work?
There are two major benefits to the spectroscopy community: First, we provide a publicly available free spectroscopic database of a large (and growing) number of liquids that can be used to model spectra and reduce data for dozens of applications. The data are of very high quality. Second, the data themselves can be used as calibration reference spectra for many applications and instruments.
Do you plan to continue expanding this work? What are the next steps in your research related to this work?
We of course hope to continue this work since it would be advantageous to include several hundred species relevant to many other applications, but as a federal laboratory, our research is subject to continued funding from sponsors. Work is also currently under way to expand the wavelength range to include the near-infrared (for example, to 10,000 cm-1, 1.0 µm wavelength) as this wavelength range has proven very useful for many (industrial) applications.
Reference
- T.L Myers, R.G. Tonkyn, T.O. Danby, M.S. Taubman, B.E. Bernacki, J.C. Birnbaum, S.W. Sharpe, and T.J. Johnson, Appl. Spectrosc. 72 (4) 535–550 (2018).
- B.M. DeVetter, T.L. Myers, B.D. Cannon, N.K. Scharko, M.R. Kelly-Gorham, J.F. Corbey, A.L. Schemer-Kohrn, C.T. Resch, D.D. Reilly, and T.J. Johnson, J. Phys. Chem. A, 122 7062−7070, (2018).
- T.L. Myers, C.S. Brauer, Y.-F. Su, T.A. Blake, R.G. Tonkyn, A.B. Ertel, T.J. Johnson and R.L. Richardson, Appl. Opt.54(15), 4863-4875 (2015).
Tanya L. Myers is a senior research scientist at the Pacific Northwest National Laboratory. She received her PhD and MS in chemistry from the University of Chicago. She has more than 25 years of extensive experience with laser-based experiments in chemical physics, including high-resolution IR spectroscopy. She is the author of more than 40 refereed publications.
Timothy J. Johnson is a senior research scientist at PNNL who specializes in the THz IR, near-IR, and UV-vis domains. He received his PhD in chemical physics from Washington State University, where he studied crystallographic effects on the Raman and IR spectra of solids. He is the inventor on two U.S. patents, co-author of one book, and the author of more than 75 refereed publications.
Newsletter
Get essential updates on the latest spectroscopy technologies, regulatory standards, and best practices—subscribe today to Spectroscopy.


