Spectroscopic Analysis of the Effects of Alkaline Extractants on Humic Acids Isolated from Herbaceous Peat
To study the effect of various extractants on the structure of peat humic acid, peat humic acid was extracted using NH3·H2O, Na2CO3, NaHCO3, and Na2SO3 via alkali-extraction and acid-precipitation methods. The extracted peat humic acid was characterized using ultraviolet−visible (UV-vis) spectroscopy, Fourier transform infrared (FT-IR) spectroscopy, and fluorescence (FL) spectroscopy. The results showed that the extractants had negligible effects on the content of peat humic acids. Na2CO3 was found to be the most effective extractant for isolating humic acids from peat, with the highest content of 66.20% and a yield of 32.67%. Moreover, among the extractants used, NH3·H2O resulted in humic acids with the highest aromaticity, and Na2SO3 yielded humic acids with higher number of hydroxyl groups. NaHCO3 yielded humic acids with the most aliphatic ether and lowest aromaticity. Na2CO3 was the best extractant for isolating humic acids from peat, having the highest content, lowest degree of aromatic polymerization, and highest number of carboxylic acids.
Plant organisms gradually form peat through the slow decomposition of anaerobic microorganisms under excessive water and insufficient air environments (1). Peat originates from mosses and woody and herbaceous plants. It retains carbohydrates, lignin, and other substances inherent to primitive plants in varying degrees (2). Peats contain up to 40% (w/w) humic acid (3). Peat resources are abundant in China, with herbaceous peat being the main source peat primarily utilized as a seedling substrate (4,5), which does not fully utilize the economic potential of peat. Therefore, an increasing number of studies are focusing on the diverse use of peat products (6).
Carboxyl and phenolic hydroxyl groups of humic acid can provide active hydrogen ions, resulting in strong ion−exchange capacity and complexation (7,8). The greater the number of carboxyl structures, the higher the biological activity (9). Peat humic acids (PHA) are widely used in agriculture, biomedicine, and other fields (10,11). The structure and properties of humic acids can vary considerably depending on the source and method of extraction. He and associates (12) found that lignite humic acid had the highest aromaticity, followed by the humic acid extracted from weathered coal, with PHA having the lowest aromaticity. Klavins and coauthors (13) reported that the degree of aromatization of PHA was less than that of soil and aquatic substances, and that the carboxylic acid content of humic acids increased with the depth of peat positioning and degree of humification.
Lee and associates (14) reported that humic acids extracted using KOH and NaOH at 0.2, 0.3, and 0.4 M had similar chemical properties. Ge and coauthors (15) found that the yield, degree of molecular condensation, and relative molecular mass of humic acids in peat could be increased using mechanochemical methods. Jarukas and coauthors (16) concluded that ultrasonication was less effective than dipping for extracting more organic compounds. Consequently, the mechanical crushing and alkaline immersion of herbaceous peat are important for the isolation of humic acids with high yields and bioactivity. Alkaline extraction and acid precipitation methods are among the most common approaches for extracting humic acid from low-rank coal. Lu and coworkers (17) studied the effects of liquid acid on the spectral characteristics during PHA extraction using the alkali-extraction acid-precipitation method and found that the yield and purity of humic acid obtained using HNO3 were higher than those obtained using H2SO4. Several researchers have focused on the effects of Na4P2O7 and NaOH on humic acid in PHA. Zaccone and associates (18) studied the effects of extractants (Na4P2O7 and NaOH) on the quality and trace element content of PHA and observed that PHA extracted using Na4P2O7 had complex aromatic properties. Trofimova and associates (19) revealed the influence of PHA on the functional activity of macrophages in vitro by various methods. They discovered that the Na4P2O7 extract was characterized by numerous functional groups. Zykova and associates (20) used Na4P2O7 and NaOH as extractants to procure eighteen types of natural humic acids from nine types of typical peat. They found that humic acids extracted using NaOH had higher antioxidant activity than those obtained using Na4P2O7.
However, there are very few reports on the effects of different weak alkaline extractants (NH3·H2O, Na2CO3, NaHCO3, and Na2SO3) on the structures of PHA. In this study, PHA was extracted using alkali-extraction and acid-precipitation methods. The humic acid structures were characterized using ultraviolet-visible (UV-vis) spectroscopy, Fourier transform infrared (FT-IR) spectroscopy, and fluorescence (FL) spectroscopy. This study aimed to identify suitable extractants for extracting PHA with low aromatic content, high carboxylic acid content, and abundant functional groups. Moreover, exploring the effects of the extractants on the structure of PHA benefits the high-value conversion of peat and increases its economic value.
Materials and Methods
Reagents
Herbaceous peat was provided by Dunhua City Jixiang Peat Development Co., Ltd. Humic acid standard (HA−S) was a chromatographically pure reagent. HCl, NaOH, H2SO4, NH3·H2O, Na2CO3, NaHCO3, Na2SO3, phenanthroline, and potassium dichromate were all analytical reagents.
Extraction of Humic Acid from Herbaceous Peat
Herbaceous peat was mechanically powdered to a particle size of 0.15 mm and weighed on a balance to 20.0000 g. It was then placed in a beaker and treated with 80.00 mL of 5% NH3·H2O, Na2CO3, NaHCO3, or Na2SO3. The peat powder was then immersed for 24 h, and distilled water was added at a solid-liquid ratio (g/mL) of 1:20. The pH of the solution was adjusted to approximately 10–12 by using 5% NaOH (17). The solution was stirred for 2 h at 80 °C, and the supernatant was collected by centrifugation. The pH of the solution was adjusted to 2 using 5% H2SO4 (21). The sediment was collected and placed in an oven at 80 °C to obtain PHA. The different extractants resulted in the production of NH3·H2O−P, Na2CO3−P, NaHCO3−P, and Na2SO3−P, respectively.
Content and Yield of Humic Acid
Humic acid reacts with NaOH to form sodium humate. Excess potassium dichromate solution can oxidize carbon from sodium humate to carbon dioxide in the presence of concentrated sulfuric acid. Ferrous ammonium sulfate can be used for the reverse titration of the remaining potassium dichromate. The content of humic acid can be calculated according to the dosage of potassium dichromate oxidized humic acid.
Humic acid was crushed (0.21 mm), weighed (0.2000 g), and dissolved in 100 mL of NaOH (1%). 5.00 mL of humic acid solution, 5.00 mL of potassium dichromate solution (0.4 mol/L), and 15.00 mL of concentrated sulfuric acid were added to a conical flask. The flask was placed in a water bath (100 °C) for oxidation for approximately 30 min, after which the heating reaction was stopped and the solution was cooled to room temperature. Three drops of phenanthroline indicator solution were added to the solution, which was then titrated using ferrous ammonium sulfate as the standard reagent. The endpoint was achieved when the solution changed from orange to brick red (22). Simultaneously, control experiments were conducted. The humic acid content is calculated using the following equation:


Where A is the humic acid content, %; 0.003 is a coefficient indicating the milligram equivalent of carbon, g; V0 is the consumption of ferrous ammonium sulfate in the control group, mL; V1 is the consumption of ferrous ammonium sulfate in the test group, mL; N is the concentration of ferrous ammonium sulfate, mol/L; C is 0.58, indicating the conversion factor for the PHA carbon ratio; G is the weight of the humic acid sample, g; Va is the total volume of humic acid solution, mL; and Vb is the volume of humic acid solution used in titration, mL.
The yield of humic acid is calculated by the following equation:


Where B is the yield of humic acid, %; A is the humic acid content, %; m is the weight of humic acid, g; and M is the weight of peat, g.
Characterization Method
UV-vis: 0.0100 g of humic acid sample was weighed and dissolved in 100 mL of a 100 mg/L NaHCO3 solution. The pH was adjusted to 8 with HCl (1%) or NaOH (0.1 mol/L) (23). The scanning range was set to 200–800 nm using a near-infrared UV-vis spectrophotometer (Cary 5000, Agilent). The 265 and 465 nm absorbances were measured and recorded as E2 and E4, respectively.
FT-IR spectroscopy: Humic acid (1 mg) was placed in an FT-IR spectrometer (PerkinElmer, Spectrum 3) for the analysis. The infrared spectrum with a wavenumber of 4000−400 cm−1 was measured, and the data was processed using the OMNIC software. The functional group content in different humic acids was inferred from the peak area (24).
Fluorescence spectra: The humic acid solution was treated using the aforementioned method for the UV spectra. After the solution was placed in a fluorescence spectrometer (PerkinElmer, LS55), the scanning speed was set to 1000 nm/min. The excitation and emission slit bandwidths were both set to 8 nm. All spectral scanning ranges were 275–650 nm, and the excitation wavelength was fixed at 274 nm.
Results and Discussion
Effects of Different Extractants on the Content and Yield of Humic Acids
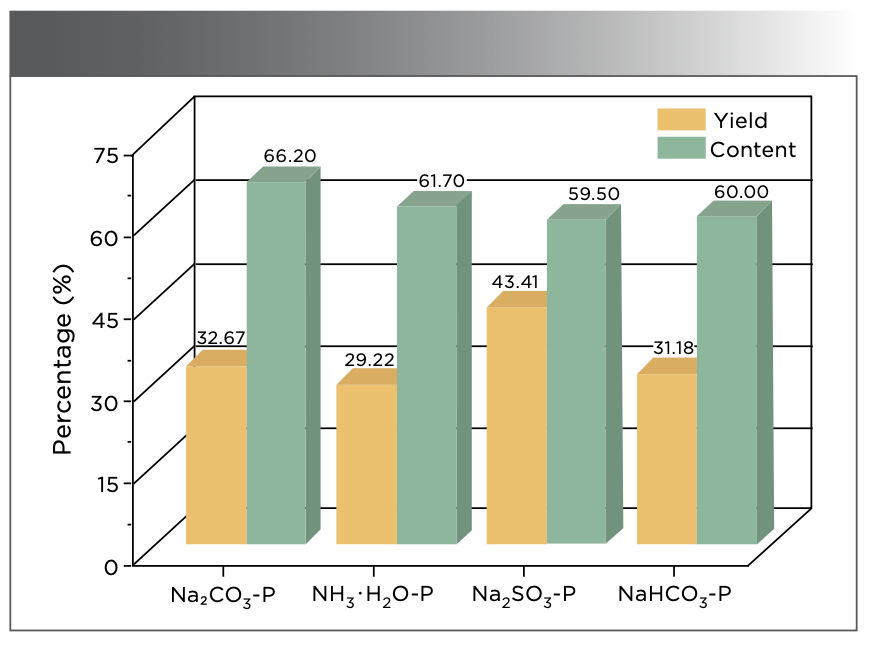
The yields of PHA isolated using different extractants were distinct. As shown in Figure 1, the highest PHA yield is 43.41% for extraction using Na2SO3−P, followed by those extracted using Na2CO3−P (32.67%), NaHCO3−P (31.18%), and NH3·H2O−P (29.22%). Thus, Na2SO3 is considered the best extractant. Figure 1 also shows that the Na2CO3−P treatment provides the highest content of PHA (66.20%). Compared with Na2CO3−P, the contents of PHA extracted using NH3·H2O−P, NaHCO3−P, and Na2SO3−P are reduced by 4.50%, 6.20%, and 6.70%, respectively. This proves that the extractants have a weak influence on the PHA content. In summary, the yield and content of PHA were extracted using different extractants. The four humic acids are diverse in influence and effect, which is significant for further research.


FIGURE 1: Content and yield of humic acids extracted using various extractants from peat. The various extractants are shown along the abscissa axis of the figure.
Effects of Different Extractants on the Ultraviolet–Visible Spectrum of Humic Acid
The UV-vis spectra of humic acids at 200–800 nm for various extractants are shown in Figure 2. It can be observed from the figure that the curves are close to each other. Lu and coauthors (22) studied the UV-vis spectrum of humic acid extracted from peat, which showed a similar trend as that in this study, with a sharp increase at short wavelength, a peak at 230 nm, and then a gradual decrease, and a slow down to almost undetectable at 800 nm. The spectral signature at 230 nm suggests the presence of a benzene ring in the PHA sample, resulting from the π→π* transition of aromatic compounds. Additionally, the absorbance of humic acids extracted using Na2SO3−P is similar to those of the other humic acids, with a slightly shifted maximum peak absorption. Due to the high content of chromophores and substituents in PHA, a blue shift appears in the spectrum when Na2SO3 is used as the extractant.


FIGURE 2: UV-vis spectra of humic acids extracted using different extractants from peat. Inset subfigure shows extractant along abscissa axis vs E2/E4 along the ordinate axis.
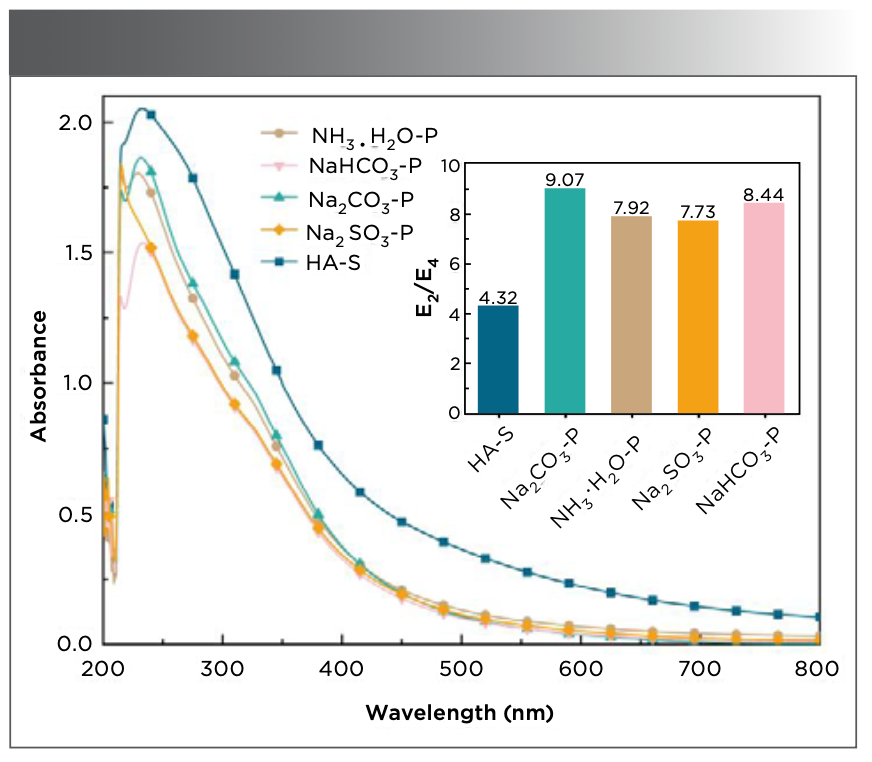
Rodríguez (25) concluded that a larger E2/E4 ratio resulted in a lower degree of the aromatic ring condensation of humic acid. As shown in Figure 2, the E2/E4 ratio of HA−S is the smallest at 4.32, and the E2/E4 ratio of PHA is greater than that of HA−S. Chen and associates (26) found that the higher E2/E4 ratio was related to the carbonyl group. The largest E2/E4 ratio is determined to be 9.07 for Na2CO3−P. This indicates that the PHA extracted using Na2CO3 has the lowest aromaticity and molecular weight and a higher concentration of carbonyl structures. The E2/E4 ratio of NH3·H2O−P and Na2CO3−P are similar, indicating that the contents of the benzene ring, carbonyl groups, and molecular weights are similar in PHA when NH3·H2O and Na2SO3 are used as extractants.
Effects of Different Extractants on Fourier Transform Infrared Spectrum of Humic Acids
Figure 3 shows the FT-IR spectra of different humic acids at 4000−400 cm−1. PHA is observed to have the same characteristic absorption peaks as HA-S, confirming that the substances contain the same functional groups. At 3650 cm−1, there is a sharp absorption peak, indicating the stretching vibration of the free hydroxyl group in which the peak areas of all spectra are in the order of HA−S > NH3·H2O−P > Na2SO3−P > Na2CO3−P > NaHCO3−P. A broad absorption peak at 3500−3200 cm−1 represents the stretching vibration of intermolecular hydrogen bonds (phenols, alcohols, and carboxylic acids). The peak areas are in the order of HA−S > NH3·H2O−P > Na2CO3−P > NaHCO3−P > Na2SO3−P. This indicates that the hydroxyl structure of PHA extracted with NH3·H2O has the greatest yield. The absorption peaks of the humic acids appear at 2960, 2920, 2870, and 2850 cm−1 corresponding to the symmetric and antisymmetric vibrations of methyl and methylene, respectively (27). The peak at 2355 cm−1 is attributed to the atmospheric carbon dioxide.


FIGURE 3: FT-IR spectra of humic acids extracted using different extractants from peat.
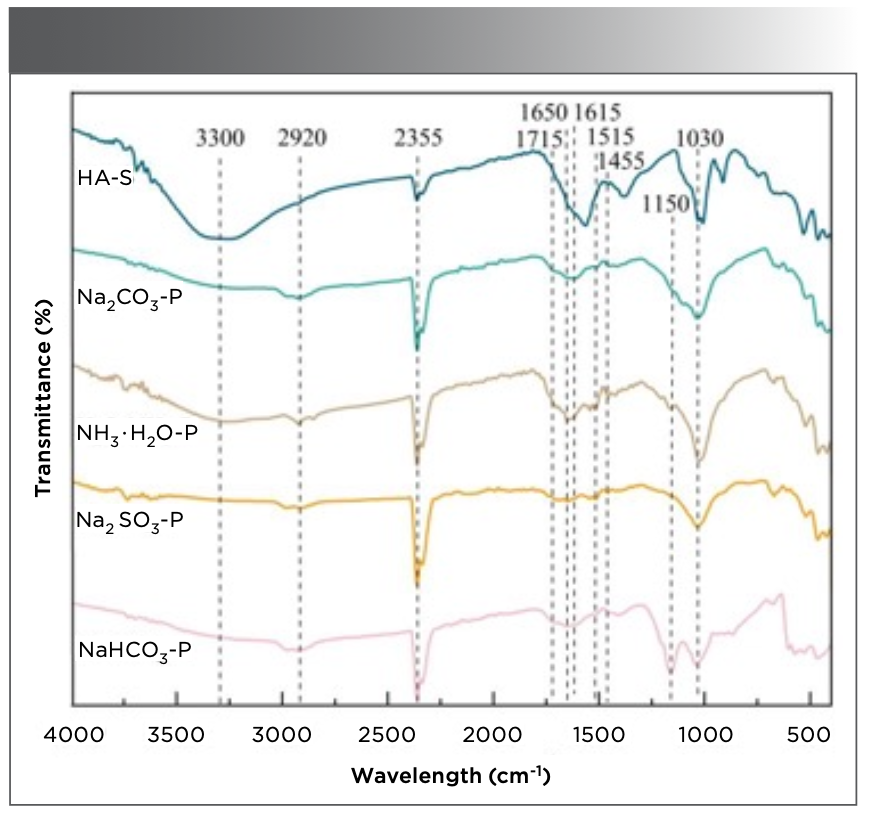
In addition, the carbonyl stretching vibration is 1750−1700 cm−1 for aldehydes, ketones, and carboxylic acids (28), and all spectra show obvious absorption peaks, highlighting the acidic characteristics of the peat humic substances. The wavenumber of 1715 cm−1 corresponds to the characteristic peak of aliphatic ketones, and the PHA peak areas are smaller than those of the HA−S. In this region, NH3·H2O−P has a larger peak area than those of Na2CO3−P, NaHCO3−P, and Na2SO3−P, implying that more aliphatic ketone structures of humic acids are obtained using NH3·H2O. In addition, all infrared spectra show the stretching vibration absorption peak of the carbon−carbon double bond at approximately 1650 cm−1. The peak areas of PHA are smaller than those of HA–S. In particular, the peak area of Na2CO3–P is the smallest, implying that the carbon−carbon double bond content of the PHA extracted using Na2CO3 is the lowest.
Trofimova (29) analyzed the functional group structure of the PHA by infrared spectroscopy and found stretching vibrations of the carbon skeleton in the aromatic ring at 1610, 1513, and 1452 cm−1. Figure 3 shows the three absorption peaks at 1615, 1515, and 1455 cm−1. The peak areas of humic acids are in the order HA−S> NH3·H2O−P > Na2SO3−P > Na2CO3−P > NaHCO3−P. This indicates that the PHAs isolated using Na2CO3 and NaHCO3 have fewer benzene rings. This is consistent with the E2/E4 ratio results in the UV-vis spectrum.
Additionally, characteristic absorption peaks for ether bonds at 1300−1000 cm−1 are observed (30). As shown in Figure 3, NH3·H2O−P and NaHCO3−P exhibit large peaks of aliphatic ether at 1150 cm−1. Among them, the peak area of NaHCO3−P is the highest, implying that higher levels of aliphatic ethers can be extracted from natural peat using NaHCO3. The absorption peaks corresponding to the stretching vibration of aromatic ether appears in all spectra at 1030 cm−1, and the peak areas are as follows: HA−S > NH3·H2O−P > Na2SO3−P > NaHCO3−P > Na2CO3−P. The results show the lowest number of aromatic ether structures are present in PHA when Na2CO3 is used as the extractant. The FT-IR spectra of PHA and HA−S exhibit the same absorption peaks; however, these spectra differ in the peak areas of some bands.
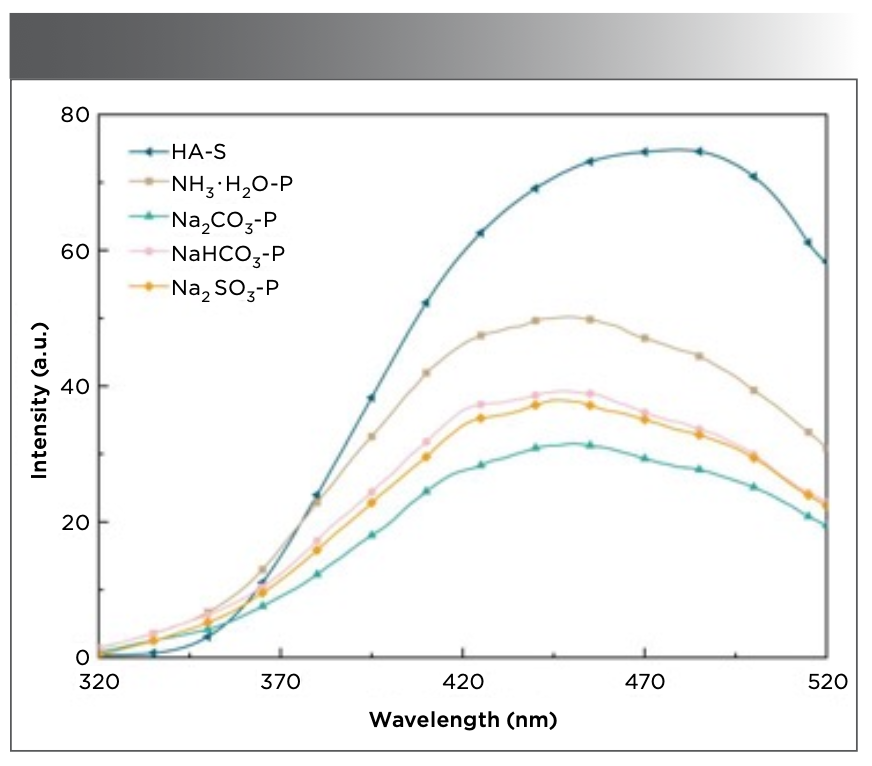
Effects of Different Extractants on Fluorescence Spectrum of Humic Acids
Figure 4 shows the fluorescence emission spectra of the various humic acids at a fixed excitation wavelength of 274 nm. Compared with that of HA−S (479 nm), the fluorescence peak of PHA has different degrees of blue shift (Na2CO3−P at 450 nm, NH3·H2O−P at 449 nm, NaHCO3−P at 448 nm, and Na2SO3−P at 446 nm). This indicates that the molecular structures of the humic acids obtained using the different extractants are varied. Due to the fewer aromatic or heterocyclic rings in PHA, the degree of π-electron conjugation is smaller (31), resulting in a larger blue shift. As PHA has fewer hydroxyl structures than HA−S, the degree of p→π conjugation in PHA is less than that in HA−S, resulting in a considerably lower fluorescence intensity. Humic acids extracted by alkali-extraction and acid-precipitation contain more electron-withdrawing substituents (carbonyl and carboxyl), which weaken the fluorescence intensity of PHA. Figure 4 shows the fluorescent signals of the different humic acids, with the fluorescence intensities in the order of NH3·H2O−P > NaHCO3−P > Na2SO3−P > Na2CO3−P. This confirms that the hydroxyl (electron-donating group) content of the PHA extracted using NH3·H2O is greater than that of using NaHCO3−P. Na2CO3 extraction of PHA carbonyl and carboxyl content is also found to be higher. This supports the conclusions drawn from the UV-vis and FT-IR spectra.


FIGURE 4: Fluorescence spectra of humic acids extracted using different extractants from peat. The key to the figure is shown in the upper lefthand corner.
Conclusion
The humic acid content (66.20%) was highest when Na2CO3 was used for the extraction from peat, with a yield of 43.41%. NH3·H2O was used as the extractant to maximize the peat decomposition to afford the highest number of aromatic and hydroxylated humic acids, followed by Na2SO3. The PHA extracted using Na2CO3 had the lowest aromaticity, least number of carbon–carbon double bonds, highest number of carboxylic acid structures, and smallest molecular weight. When NaHCO3 was used for the extraction, the aliphatic ether of humic acid was the highest, whereas the aromaticity of humic acid was low.
Na2CO3 proved to be the most effective extractant for obtaining peat humic acid, resulting in a higher yield and content. Moreover, it yielded humic acid with lower benzene ring content and more carboxylic acid structures. The study provides feasible technological conditions for obtaining superior-quality peat. Extracting humic acid with a small molecular weight and low aromaticity provides a theoretical basis for the full utilization of peat resources, which are of significant economic value.
Acknowledgments
This work is financially supported by the National Natural Science Foundation of China (21766025); Fundamental Research Funds for Inner Mongolia University of Science & Technology (2022).
References
(1) Starr, M.; Vasander, H. Chapter 12 - Nature and Characteristics of Forest Soils and Peat Soils as Niches for Microorganisms. Forest Microbiology 2021, 1, 223–229. DOI: 10.1016/B978-0-12-822542-4.00021-8
(2) Strel’nikova, E. B.; Russkikh, I. V.; Preis, Y. I. n-Alkanes and n-Alkan-2-ones as Lipid Biomarkers of High-Moor Peats and Marsh Plants in Western Siberia. Solid Fuel Chem. 2021, 55 (5), 321–331. DOI: 10.3103/S0361521921050062
(3) Krumins, J.; Klavins, M.; Krukovskis, R. Characterisation of Humic Acids in Fen Peat. Int. J. Agric. Resour. Gov. Ecol. 2020, 16 (1), 74–89. DOI: 10.1504/IJARGE.2020.10029073
(4) Park, M. S., Kim, H. C.; An, S.; Lee, C. W.; Choi, J. M. Influence of Pre-Plant Root Substrate Nitrogen Levels on Growth of Selected Fruit Bearing Vegetable Seedlings in Cylindrical Paper Pots. Horticulture, Hortic., Environ. Biotechnol. 2021, 62 (3), 367–375. DOI: 10.1007/s13580-020-00327-6
(5) Pająk, K.; Kormanek, M.; Małek, S.; Banach, J. Effect of Peat-Perlite Substrate Compaction in Hiko V265 Trays on the Growth of Fagus sylvatica L. Seedlings. Sustainability 2022, 14 (8), 4585. DOI: 10.3390/su14084585
(6) Irtiseva, K.; Baronins, J.; Krūmiņš, J. Development of Peat Processing Methods for Production of Innovative Products. Key Eng. Mater. 2020, 850, 9–15. DOI: 10.4028/www.scientific.net/kem.850.9
(7) Dai, L.; Zhao, W. F.; Wei, B. G.; Zhang, K.; Han, T. J. Adsorption of Pb2+ by Insolubilized Humic Acid Extracted from Sewage Sludge. Mater. Cycles Waste Manage. 2021, 23 (3), 1037–1047. DOI: 10.1007/s10163-021-01193-9
(8) Wan, K. J.; Wang, G. Q.; Xue, S. W.; et al. Preparation of Humic Acid/l-Cysteine-Codecorated Magnetic Fe3O4 Nanoparticles for Selective and Highly Efficient Adsorption of Mercury. ACS Omega. 2021, 6 (11), 7941–7950. DOI: 10.1021/acsomega.1c00583
(9) Araújo, K. V.; Pittarello, M.; Carletti, P.; Campos, A. R. M.; Dobbss, L. B. Structural Characterization and Bioactivity of Humic and Fulvic Acids Extracted from Preserved and Degraded Brazilian Cerrado Biomes Soils. Eurasian Soil Sci. 2021, 54 (1), 16–25. DOI: 10.1134/S1064229322030024
(10) Paleckiene, R.; Navikaite, R.; Slinksiene, R. Peat as a Raw Material for Plant Nutrients and Humic Substances. Sustainability 2021, 13 (11), 6354. DOI: 10.3390/su13116354
(11) Trofimova, E. S.; Zykova, M. V.; Danilets, M. G.; et al. Immunomodulating Properties of Humic Acids Extracted from Oligotrophic Sphagnum magellanicum Peat. Bull. Exp. Biol. Med. 2021, 170 (4), 461–465. DOI: 10.1007/s10517-021-05088-5
(12) He, J.; Yan, L.; Yang, K.; et al. Study on Components and Character of Humic Acids from Different Sources. Chin. J. Soil Sci. 2003, 4 (4), 343–345. DOI: 10.19336/j.cnki.trtb.2003.04.026
(13) Klavins, M.; Purmalis, O. Properties and Structure of Raised Bog Peat Humic Acids. J. Mol. Struct. 2013, 1050, 103–113. DOI: 10.1016/j.molstruc.2013.07.021
(14) Huey, L. J.; Ahmed, O. H.; Majid, N. M. A. Effects of Extractants on the Yields and Selected Chemical Characteristics of Humic Acids Isolated from Tropical Saprists Peat. Am. J. Appl. Sci. 2010, 7 (7), 933–936. DOI: 10.3844/ajassp.2010.933.936
(15) Ge, L.; Yang, C. X.; Wang, J. Effect of Mechanochemical Activation on Peat Humic Acid. IOP Conf. Ser.: Earth Environ. Sci. 2021, 692 (4), 042031. DOI: 10.1088/1755-1315/692/4/042031
(16) Jarukas, L.; Ivanauskas, L.; Kasparaviciene, G.; et al. Determination of Organic Compounds, Fulvic Acid, Humic Acid, and Humin in Peat and Sapropel Alkaline Extracts. Molecules 2021, 26 (10), 2995. DOI: 10.3390/molecules26102995
(17) Lu, Y. N.; Wang, X. X.; Ma, L. T. Effects of Liquid Acid on the Spectral Characteristics During Peat Humic Acid Extracted by Alkali-Extraction Acid-Precipitation Method. Spectrosc. Spectral Anal. 2020, 40 (2), 574–578. DOI: 10.3964/j.issn.1000-0593(2020)02-0574-05
(18) Zaccone, C.; Cocozza, C.; D’Orazio, V.; et al. Influence of Extractant on Quality and Trace Elements Content of Peat Humic Acids. Talanta 2007, 73 (5), 820–830. DOI: 10.1016/j.talanta.2007.04.052
(19) Trofimova, E. S.; Zykova, M. V.; Ligacheva, A. A.; et al. Influence of Humic Acids Extracted from Peat by Different Methods on Functional Activity of Macrophages in Vitro. Bull. Exp. Biol. Med. 2017, 162 (6), 741–745. DOI: 10.1007/s10517-017-3702-5
(20) Zykova, M. V.; Logvinova, L. A.; Krivoshchekov, S. V.; et al. Antioxidant Activity of Macromolecular Compounds of Humic Etiology (Article). Khim. Rastit. Syr’ya 2018, 3, 239–250. DOI: 10.14258/jcprm.2018033925
(21) Zhang, Y. Q.; Li, Y. H.; Chang, L. P.; et al. A Comparative Study on the Structural Features of Humic Acids Extracted from Lignites Using Comprehensive Spectral Analyses. RSC Adv. 2020, 10 (37), 22002–22009. DOI: 10.1039/D0RA03166F
(22) Lu, Y. N.; Ma, L. T. Effects of Extractant and Pretreatment on the Structure of Humic Acid from Methane Fermentation Peat Residue. Clean Coal Technol. 2021, 27 (6), 218–224. DOI: 10.13226/j.issn.1006-6772.20112901
(23) Lu, Y. N.; Ma, L. T.; Li, J. Effects of Sulfuric Acid Pretreatment and Liquid Acids Precipitation on the Structure of Fulvic Acid Extracted from Peat. Spectroscopy Letters 2021, 54 (2), 89–98. DOI: 10.1080/00387010.2020.1854306
(24) Enev, V.; Pospíšilová, L.; Klučáková, M.; Liptaj, T.; Doskocil, L. Spectral Characterization of Selected Humic Substances. Soil Water Res. 2014, 9 (1), 9–17. DOI: 10.17221/39/2013-swr
(25) Rodríguez, F. J.; Schlenger, P.; Garca−Valverde, M. Monitoring Changes in the Structure and Properties of Humic Substances Following Ozonation Using UV-vis, FT-IR and 1H NMR Techniques. Sci. Total Environ. 2016, 541, 623–637. DOI: 10.1016/j.scitotenv.2015.09.127
(26) Chen, J.; Gu, B. H.; LeBoeuf, E. J. Spectroscopic Characterization of the Structural and Functional Properties of Natural Organic Matter Fractions. Chemosphere 2022, 48 (1), 59–68. DOI: 10.1016/S0045-6535(02)00041-3
(27) Gong, G. Q.; Zhao, Y. F.; Zhang, Y. J.; et al. Establishment of a Molecular Structure Model for Classified Products of Coal-Based Fulvic Acid. Fuel 2020, 267, 117210. DOI: 10.1016/j.fuel.2020.117210
(28) Rafidison, B. H.; Ramasawmy, H.; Chummun, J.; Florens, F.; Benjamin, V. Using Infrared Spectrum Analyses to Predict Tensile Strength of Fibres in a Group of Closely Related Plant Species: A Case of Mascarenes Pandanus spp. SN Appl. Sci. 2020, 2 (11), 1922. DOI: 10.1007/s42452-020-03667-1
(29) Trofimova, E. S.; Zykova, M. V.; Ligacheva, A. A.; et al. Effects of Humic Acids Isolated from Peat of Various Origin on in Vitro Production of Nitric Oxide: a Screening Study. Bull. Exp. Biol. Med. 2016, 161 (5), 687–692. DOI: 10.1007/s10517-016-3486-z
(30) Wei, S. P.; Wu, M.; Li, Z. P. Comparative Study on Infrared Spectroscopy of Humic Acid from Different Sources. Humic Acid 2018,(1), 20–25. DOI: 10.19451/j.cnki.issn1671-9212.2018.01.003
(31) Gao, J. F.; Dou, S.; Wang, Z. G. Structural Analysis of Humic Acid in Soil at Different Corn Straw Returning Modes through Fluorescence Spectroscopy and Infrared Spectroscopy. Int. J. Anal. Chem. 2019, 1–9. DOI: 10.1155/2019/1086324
Liping Li, Litong Ma, Yanan Lu, Ying Wang, and Shenguang Sun with the School of Chemistry and Chemical Engineering at the Inner Mongolia University of Science and Technology, in Baotou of the Inner Mongolia Autonomous Region, in China. Ma is also with the Inner Mongolia Engineering Research Center of Comprehensive Utilization of Bio-coal Chemical Industry and the Laboratory of Low Rank Coal Carbon Neutralization, both affiliated with the same university. Direct correspondence to Litong Ma at mlt0916@126.com ●


Measurement of Ammonia Leakage by TDLAS in Mid-Infrared Combined with an EMD-SG Filter Method
April 9th 2024In this article, tunable diode laser absorption spectroscopy (TDLAS) is used to measure ammonia leakage, where a new denoising method combining empirical mode decomposition with the Savitzky-Golay smoothing algorithm (EMD-SG) is proposed to improve the signal-to-noise ratio (SNR) of absorbance signals.

