Characterization of Glitter Cosmetic Particles Using FT-IR Spectroscopy
Spectroscopy
Glitter particles from cosmetics may transfer during personal assaults, and thus glitter may be useful as a forensic tool. In this study, glitter samples were analyzed using ATR–FT-IR in an attempt to develop a characterization scheme to aid in the identification of these particles.
With the common knowledge of DNA and fingerprints being used as trace evidence in casework, many perpetrators attempt to mitigate the transfer of such evidence at a crime scene. However, since close personal attacks are common, it is necessary to account for the potential lack of such evidence that may associate a suspect to a crime scene by considering other potential evidence. One type of evidence that is commonly overlooked by offenders is that of cosmetic transfer. Specifically, glitter components from cosmetic products may potentially transfer from or onto an offender, the crime scene, or the victim. In this study, 36 glitter samples were analyzed using attenuated total reflectance–Fourier transform infrared spectroscopy (ATR–FT-IR) in an attempt to develop a characterization scheme to aid in the identification of glitter particles that may transfer during personal assaults. Samples were separated into six classes based on chemical composition, and various statistical methods were used to determine the potential to classify glitter particles. Results of the developed scheme showed great accuracy, with at least 99% classification rates using three cross validation models. The developed classification model provides a basis for further identification of unknown glitter samples collected from a potential crime scene.
Close personal assaults, unfortunately, are quite common. According to the Bureau of Justice Statistic's National Crime Victimization Survey conducted in 2016, 2.11% of U.S. residents aged 12 or above have experienced a violent crime, including sexual assault or rape, robbery, and aggravated assault (1). The National Center for Injury Prevention and Control also reported in a recent survey that about one in three women and one in six men are exposed to some form of contact sexual violence throughout their lifetime, where a sexual assault is committed against a person without their given consent (2). Since many offenders are aware of common trace evidence such as DNA and latent prints, they try to mitigate the transfer of these types of evidence at the crime scene. Cosmetic transfer is an emerging concept in the trace evidence field, and perpetrators are not typically mindful of cosmetics when committing a crime. Many cosmetic products contain glitter particles that potentially transfer from or onto an offender, victim, or crime scene. Accordingly, development of a glitter characterization scheme is necessary to aid in identification of unknown particles collected from assault cases that involved cosmetic transfer.
Glitter is comprised of tiny pieces of metallic foil or plastic, and has been previously studied for its use as trace evidence as a way to show that contact occurred (3,4). Glitter has been analyzed using white light microscopy, Fourier transform infrared spectroscopy (FT-IR), Raman spectroscopy, and gas chromatography–mass spectrometry (5–8). Most of these studies illustrated the usefulness in identification of glitter. Blackledge and associates showed that cosmetic products readily transfer at least one glitter particle during contact (5). This illustrates the importance of understanding the impact cosmetic transfer can have in close contact situations, and why it is necessary to characterize glitter samples.
FT-IR is one of the most commonly used techniques in forensic analysis. Recent studies have incorporated FT-IR techniques to detect fingerprints contaminated with various cosmetics (9). Gordon and colleagues examined the ability to discriminate 53 different cosmetic foundations based on FT-IR spectral differences, and claimed 98.3% discriminating power (10). Although glitter has already been studied, researchers that used FT-IR analysis have mainly focused on either a few glitter particles or a single color of glitter samples (4, 6, 11). Gross and associates analyzed 37 different particles using FT-IR, but all were red in color (11).
Furthermore, little research has been conducted on glitter using attenuated total reflectance-FT-IR (ATR–FT-IR). Limitations of ATR include small penetration depth of the evanescent wave into the substrate, making the technique only best used for surface or thin film measurements (12). For ATR, penetration depth is wavelength dependent, causing difficult spectral interpretation due to increased peak intensities with increasing wavelength (13). Despite these drawbacks, ATR is more suitable over transmission IR for examination of glitter, because samples can be analyzed in their natural state, without the requirement of grinding particles or pressing them into pellets (14–16). Thus, the sample preparation technique is non-destructive; glitter particles are simply placed in contact with the crystal and analyzed (3,4,16). Additionally, this technique is insensitive to sample thickness (17,18). These are all significant advantages of using ATR for glitter analysis, especially if only a minimal amount of sample was located at a crime scene.
This study focused on the classification of different colors and types of glitter using ATR–FT-IR, along with statistical analysis of a developed characterization scheme. The research presented herein places emphasis on glitter used in cosmetic industries, whereas other studies have primarily considered those used in crafts and clothing (11). The generated scheme may aid in forensic evidence analysis and provide identification information for glitter transferred between people or found at a crime scene.
Experimental
Materials
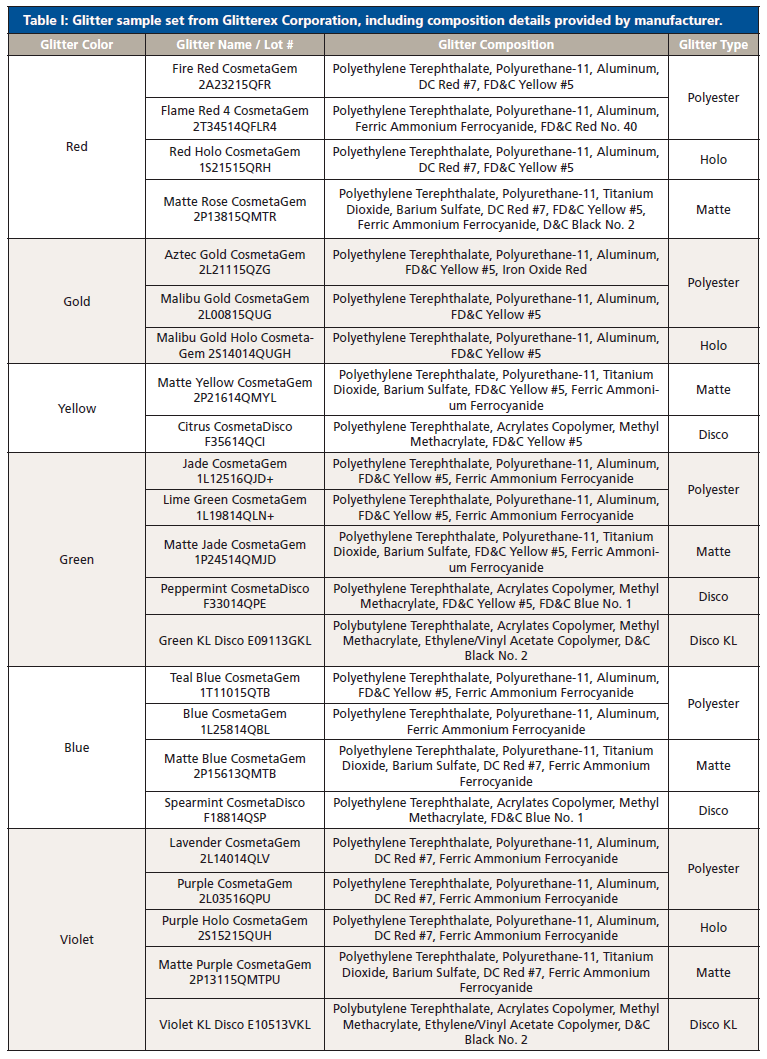
Thirty-six glitter samples were purchased from Glitterex Corporation for this study. Samples had similar and different physical characteristics, including thickness, chemical formulation, size, and morphology. The sample set consisted of nine colors and eight types of hexagonal particles (Table I). Liquid nitrogen was purchased through Air Liquide (Houston, TX, USA).
Instrumental Parameters
Glitter samples were analyzed using a Bruker LUMOS FT-IR system (Bruker Optik GmbH, Ettlingen, Germany) equipped with a Germanium ATR crystal. The microscope uses an 8x objective for high quality visual analysis of substrates, and is coupled to a liquid nitrogen cooled mercury-cadmium-telluride detector.
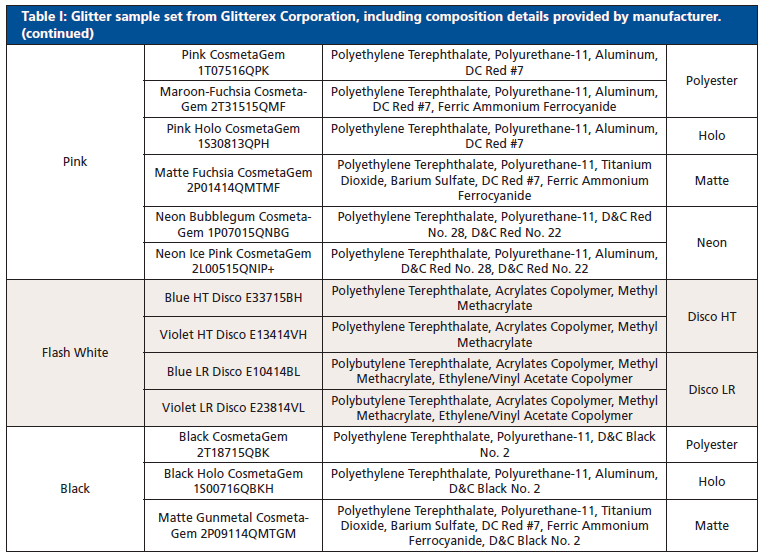
Table I: Glitter sample set from Glitterex Corporation, including composition details provided by manufacturer. (continued)
Sample Acquisition
FT-IR spectra in the mid-IR range 4000–600 cm-1 were obtained in ATR mode. Twenty spectra were collected per sample with 4.0 cm-1 resolution and 64 scans per position, resulting in an acquisition time of approximately 15 min. Background spectra of air were collected using the same parameters. Due to the soft nature of glitter, the low ATR pressure mode was used for contact between the ATR crystal and the sample. Measurements were taken at two positions for each of 10 different particles per glitter sample. Each particle was placed flat on double-sided tape, which prevented particles from being picked up or shifted by the crystal. Since glitter is stratigraphic and ATR is a surface sensitive technique, characterization was based on the surface layer of particles.
Data Pretreatment
Data processing was performed using OPUS 7.2.139.1294 (Bruker Optik GmbH, Ettlingen, Deutschland) for extended ATR correction, baseline correction, and min-max normalization of all 720 measurements. The spectra were truncated from 600 to 3200 cm-1, because no significant peaks were observed above that range. The resulting spectra were exported from OPUS as data text files, and imported into a data matrix for chemometric analysis.
Multivariate Statistics
Statistical analysis of the model dataset was completed with R-3.4.1 software (R Project, Inc., Boston, MA, USA). Hierarchical cluster analysis (HCA), principal component analysis (PCA), linear discriminant analysis (LDA), k-nearest neighbors (KNN), support vector machines (SVM), and heat map generation were all performed using the R program. Origin 2016 64-bit Sr2 b9.3.2.303 (OriginLab Corporation, Northampton, MA, USA) was used to generate spectra and plots of the data.
HCA was first performed to generate a dendrogram using the Ward's linkage and Euclidean distance methods. A corresponding heat map helped verify the number of groupings. PCA was then used with the covariance method to understand why samples clustered together in HCA. A stratified 20% withheld, tenfold cross-validation LDA model was performed using the first four PCs that accounted for > 90% of variance. The model randomly extracted 20% of the data as the test set, and computed the classification model using the remaining 80% of the data as the training set. Different cross-validation models were used to determine a comprehensive evaluation of the classification scheme and this procedure was repeated with the same training and test models for KNN and SVM. The KNN model used 5 nearest neighbors (K = 5), and the SVM model used a radial basis kernel function with cost = 10 and gamma = 1x10⁻⁴ to achieve the optimal hyperplane for maximum separation between classes (19).
Results and Discussion
Identifying the Classes
The dendrogram helped identify major groupings based on the chemical formulations of the glitter samples. Using the HCA clustering and heat map, the dataset was separated into six different classes (Figure 1). PCA was subsequently performed on the glitter dataset to define the discriminating IR bands responsible for the HCA clusters. The first four principal components (PCs) accounted for 91.2% of the variance within the dataset. Two three-dimensional (3-D) scores plots were generated using PCs 1, 2, and 3, and PCs 1, 2, and 4 to visualize the structure of the dataset (Figure 2a-b).
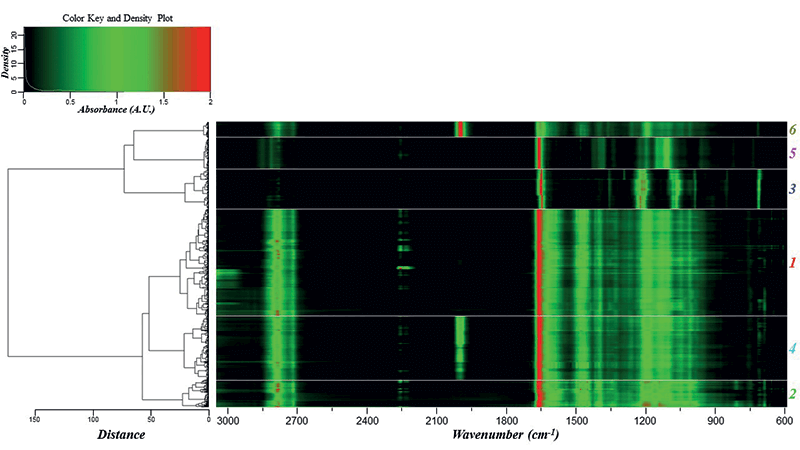
Figure 1: Dendrogram and heat map showing the six distinct clusters obtained using the FT-IR spectra. The classes are labeled at the far right with colors corresponding to the PCA scores plots and IR class spectra.
Loadings plots for PCs 1–4 (Figure 2c–f) identified the key vibrational stretches that allowed for the discrimination of samples into six classes. The PC1 plot (Figure 2c) indicated significant positive factor loadings corresponding to IR vibrations at 1268 and 726 cm-1, and significant negative loadings for 2922, 1736, 1699, and 1540 cm-1. All FT-IR spectra showed the presence of ester C-O bonds between 1300-1000 cm-1, but 1268 cm-1 was highest for class 3 samples, as depicted by the representative IR spectra for each class (Figure 3). The 726 cm-1 band represents the aromatic C-H stretches, which were present with higher absorbance values in classes 1 and 3, and not present in class 5. The peak at 2922 cm-1 was observed in classes 1, 2, 4 and 6, corresponding to aliphatic C-H stretches. In class 5, these bands were shifted closer to 2990 cm-1, due to presence of acrylates in the glitter formulation. The 1540 cm-1 signal denoted the aromatic C=C bonds coming from either polyethylene terephthalate (PET) or polybutylene terephthalate (PBT).
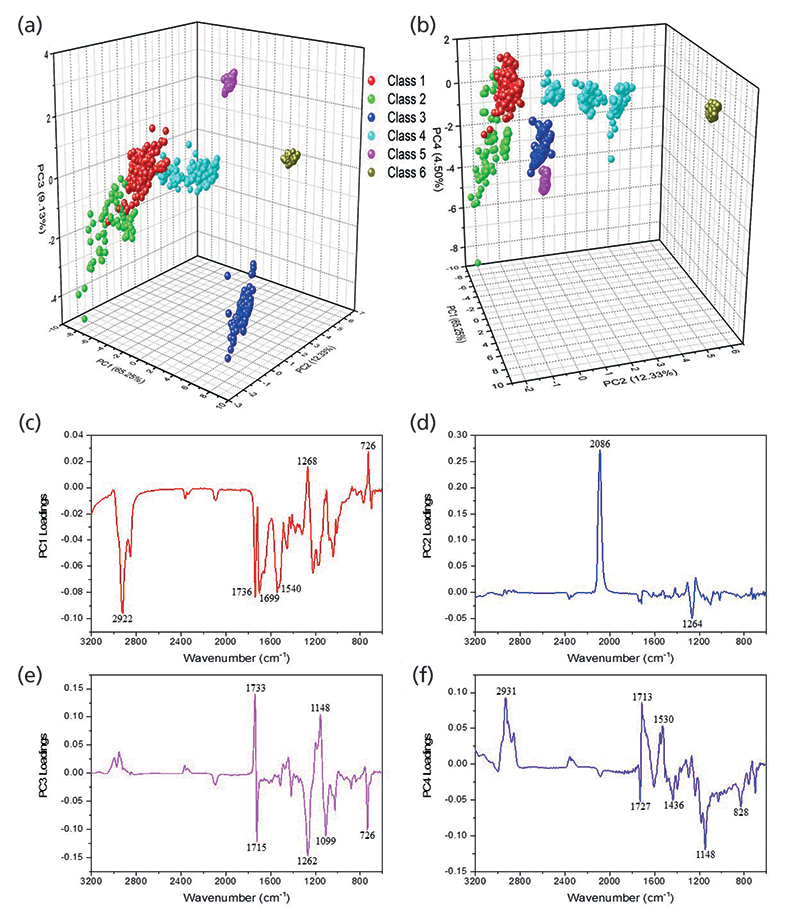
Figure 2: Three-dimensional PCA scores plots generated using (a) PCs 1, 2, and 3 and (b) PCs 1, 2, and 4. (c-f) Factor loadings plots for PCs 1-4 showing IR bands corresponding to significant positive and negative loadings.
Significant differentiating peaks in PC2 were 2086 and 1264 cm-1. The 2086 cm-1 peak corresponding to C=N bonds indicated the presence of ferrocyanide (classes 4 and 6), and 1264 cm-1 indicated the presence of C-O ester bonds (20, 21). In PC3, the positive loadings were due to vibrations at 1733 and 1148 cm-1, which specified the carbonyl C=O and the ester C-O bonds from the polymeric makeup of the glitter particles, respectively. The major negative loadings stretches in PC3 were 1715, 1262, 1099, and 726 cm-1. The 1715 cm-1 peak was also from the ester C=O bond, however this shift was only observed in class 3 samples. The 1099 cm-1 band indicated the corresponding ester C-O bond (20).
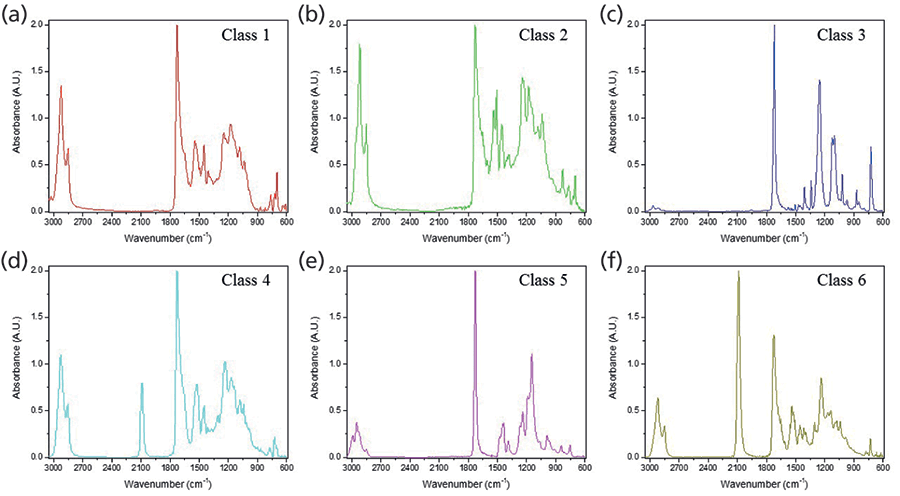
Figure 3: (a-f) Representative ATR FT-IR data showing spectral differences between classes 1-6.
The factor loadings for PC4 showed additional discrimination with positive correlations for 2931 (all classes except classes 3 and 5), 1713 (class 3), and 1530 (all classes) cm-1. The negative loadings indicated significant peaks at 1727 (all classes except class 3), 1436, 1148, and 828 cm-1. IR vibrations at 1530 cm-1 and 1436 cm-1 signified the aromatic C=C bonds. The signal at 1436 cm-1 was observed in class 5 samples alone, and the peak at 1148 cm-1 was sharpest in class 5, both potentially indicated that Disco KL and Disco LR glitter were comprised of PBT, whereas all other samples contained PET. The 828 cm-1 peak was observed in class 2 alone, and represents aromatic C-H out-of-plane bends (20).
Glitter Classification Scheme
Based on the information gathered from HCA and PCA, a characterization scheme was developed for the six classes of glitter samples (Table II). Sample classification was based on the presence and ratio of specific functional groups. Each class had spectra that were visually different from other classes, and thus visual inspection aided the development of the characterization scheme. Class 1 and 2 spectra look similar, but absorbance intensities differed in the 3000-2850 cm-1 (aliphatic C-H stretches) and 1600-1000 cm-1 ranges. As opposed to other classes, ester C=O peaks in classes 3 and 5 were sharper, and may be best explained by the addition of methyl methacrylate to the chemical formulation (21). Classes 4 and 6 differentiated due to the presence of ferrocyanide (2086 cm-1). The absorbance of the ferrocyanide peak at 2086 cm-1 was the highest in class 6 alone.
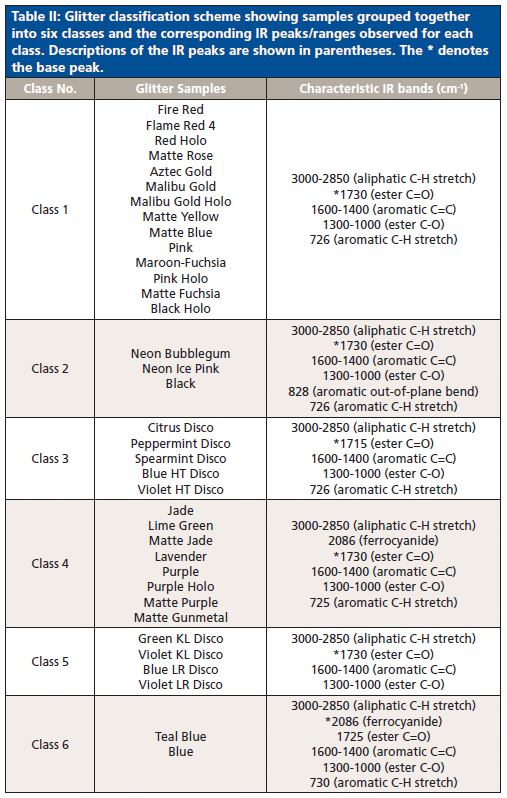
Table II: Glitter classification scheme showing samples grouped together into six classes and the corresponding IR peaks/ranges observed for each class. Descriptions of the IR peaks are shown in parentheses. The * denotes the base peak.
Cross Validation
The model dataset was tested using three different cross validation models: LDA, KNN, and SVM. The classes obtained from HCA and PCA were used to train the models. Since the three algorithms used are supervised methods, misclassified sample replicates in HCA were classified within the majority group, and then the updated classification model was used as the training dataset. For instance, Fire Red CosmetaGem identified by HCA as class 1, however one replicate was grouped into class 2 and was treated as class 1 in the training datasets. This was repeated for a few replicates of samples Maroon-Fuchsia CosmetaGem and Matte Fuchsia CosmetaGem, where all misclassified replicates were changed from class 2 to class 1.
LDA analysis resulted in a 99.24% classification rate, with 11 misclassifications observed for four samples: Neon Ice Pink, Lavender, Fire Red, and Malibu Gold Holo. Misclassifications occurred between classes 1 and 2 and classes 1 and 4. By examining the heat map, it is apparent that these three classes have similar IR spectra (Figure 1), with the exception of absorbance intensities and the additional ferrocyanide peak in class 4. KNN gave 100% characterization, and SVM had only one misclassified sample, resulting in 99.31% classification accuracy (Table III). The misclassification was not surprising, because the Neon Ice Pink sample (class 2) was predicted as class 1, and samples within these two classes have similar chemical composition, as depicted by the heat map and comparable representative spectra.
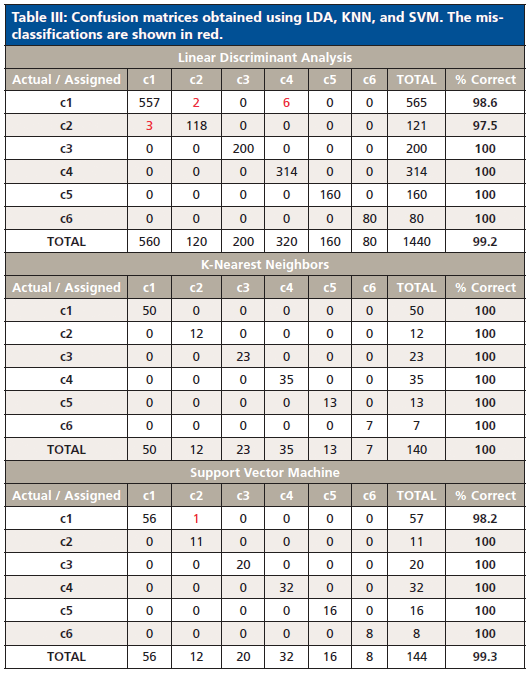
Table III: Confusion matrices obtained using LDA, KNN, and SVM. The misclassifications are shown in red.
Cross-validation using the aforementioned algorithms indicated that there was little overlap in the defined classes, and thus it can be concluded that the overall performance of the classification scheme is highly discriminating. These highly accurate results showed that it is possible to classify unknown glitter samples with little ambiguity and that ATR–FT-IR is capable of distinguishing between glitter particles using polymeric composition that may not be discriminated using other techniques, i.e. microscopy. This is in opposition of results presented by Gross and colleagues, which deemed scanning electron microscopy-energy dispersive x-ray spectroscopy (SEM–EDS) hardly useful for the characterization of polymeric glitter layers based solely on the elemental composition (11).
Conclusion
Glitter samples were classified using ATR–FT-IR spectroscopy. A classification scheme was successfully developed and validated using multivariate statistical techniques. The set of 36 glitter samples were classified into six groups based on the presence and/or relative ratios of specific functional groups. The developed scheme will help identify and classify unknown cosmetic glitter components collected after close personal assaults with high accuracy, as observed with the high characterization rates of LDA, KNN, and SVM models. Future studies will include analyzing real-world cosmetic products to determine the classification potential of transferred glitter particles. This work may provide a framework to assist in analysis of cases in which cosmetic trace evidence remains after theft, sexual assault, or even car accidents.
Funding
This research was supported by the National Institute of Justice (Grant No. 2017-R2-CX-0005) and the State of Florida.
References
(1) R.E. Morgan and G. Kena,"Criminal Victimization, 2016," Bureau of Justice Statistics (NCJ 251150), https://www.bjs.gov/content/pub/pdf/cv251116.pdf.
(2) S.G. Smith, K.C. Basile, L.K. Gilbert, M.T. Merrick, N. Patel, M. Walling, and A. Jain,"National Intimate Partner and Sexual Violence Survey (NISVS): 2010-2012 State Report," National Center for Injury Prevention and Control, https://www.cdc.gov/violenceprevention/pdf/NISVS-StateReportBook.pdf.
(3) R.D. Blackledge, presented at the Trace Evidence Symposium sponsored by the NIJ and the FBI, Clearwater Beach, Florida. [Available on the Internet at: http://projects.nfstc.org/trace/docs/final/Blackledge_Glitter.pdf], 2007 (unpublished).
(4) R.D. Blackledge and E.L. Jones, Forensic Analysis on the Cutting Edge: New Methods for Trace Evidence Analysis (John Wiley and Sons, Hoboken, New Jersey, 2007), pp. 1–32.
(5) K. Aardahl, S. Kirkowski, and R.D. Blackledge, Sci. Justice 45, 7–12 (2005).
(6) L. Vernoud, H.A. Bechtel, M.C. Martin, J.A. Reffner, and R.D. Blackledge, Forensic Sci. Intl. 210, 47–51 (2011).
(7) M. López-López, J. Vaz, and C. García-Ruiz, Talanta 138, 155–162 (2015).
(8) M. Zellner and L. Quarino, J. Forensic Sci. 54, 1022–1028 (2009).
(9) C. Ricci and S.G. Kazarian, Surf. Interface Anal. 42,386–392 (2010).
(10) A. Gordon and S. Coulson, J. Forensic Sci. 49, 1244–1252 (2004).
(11) S. Gross, K. Igowsky and E. Pangerl, JASTEE 1, 62–72 (2010).
(12) J. Grdadolnik, Acta Chim. Slov. 49, 631–642 (2002).
(13) C. Hughes, M. Brown, G. Clemens, A. Henderson, G. Monjardez, N.W. Clarke and P. Gardner, J. Biophotonics 7, 180–188 (2014).
(14) M.M. Beasley, E.J. Bartelink, L. Taylor and R.M. Miller, J. Archaeol. Sci. 46, 16–22 (2014).
(15) Perkin Elmer Technical Note, FTIR Spectroscopy: Attenuated Total Reflectance (ATR) (2005) https://www.utsc.utoronto.ca/~traceslab/ATR_FTIR.pdf
(16) ThermoFisher Scientific, FTIR Sample Techniques: Attenuated Total Reflection (ATR) https://www.thermofisher.com.
(17) B. Katlafsky and R.E. Keller, Anal. Chem. 35, 1665–1670 (1963).
(18) R.J. McGowan, Anal. Chem. 35, 1664–1665 (1963).
(19) R.A. Nugrahaeni and K. Mutijarsa, 2016 International Seminar on Application for Technology of Information and Communication (ISemantic),163–168 (2016).
(20) D.L. Pavia, G.M. Lampman, G.S. Kriz and J.A. Vyvyan, in Introduction to Spectroscopy (Cengage Learning, 2008), pp. 15-104.
(21) Spectral Database for Organic Compounds SDBS: http://sdbs.db.aist.go.jp (National Institute of Advanced Industrial Science and Technology, 15 May 2018).
Kandyss Najjar and Candice M. Bridge are with the National Center for Forensic Science and the Department of Chemistry at the University of Central Florida in Orlando, Florida. Direct correspondence to: cbridge@ucf.edu
Geographical Traceability of Millet by Mid-Infrared Spectroscopy and Feature Extraction
February 13th 2025The study developed an effective mid-infrared spectroscopic identification model, combining principal component analysis (PCA) and support vector machine (SVM), to accurately determine the geographical origin of five types of millet with a recognition accuracy of up to 99.2% for the training set and 98.3% for the prediction set.
Authenticity Identification of Panax notoginseng by Terahertz Spectroscopy Combined with LS-SVM
In this article, it is explored whether THz-TDS combined with LS-SVM can be used to effectively identify the authenticity of Panax notoginseng, a traditional Chinese medicine.