How Trace Elemental Analysis Provides Important Insight into Wine Chemistry
Examples are shown that highlight how elemental fingerprinting could provide valuable information about the geographical origin of a food or beverage as well as how different steps in the production of wines impact their elemental composition.
The elemental composition of red wine was studied with inductively coupled plasma–mass spectrometry (ICP-MS). The impact of storage and packaging as well as the role of geographic origin on the elemental content were shown. While metal content can be related to the location of the vineyard, various aspects of wine making can also influence the elemental composition. For example, we have shown that wine packaging and storage temperature can change the elemental composition of wine after a period of six months.
The analysis of alcoholic beverages, such as wines and distilled spirits, is challenging from an analytical point of view because of the many different functional classes that are present. To obtain a complete picture of the composition of these products and answer food safety and quality questions, a combination of analytical techniques is needed.
In addition to the analysis of organic components such as acids, sugars, flavonoids, and the important aroma and flavor compounds, the analysis of elemental composition is an important piece for the evaluation of quality. At the Food Safety and Measurement Facility at the University of California (UC), Davis, a cross-platform approach is taken for the analysis of food and beverage products, including the analysis of the volatile, nonvolatile, and elemental portions of foods and beverages. The available techniques, such as ultrahigh-pressure liquid chromatography–quadrupole time-of-flight mass spectrometry (UHPLC-QTOF-MS), UHPLC–tandem mass spectrometry (MS-MS), high performance liquid chromatography–mass spectrometry (HPLC–MS), gas chromatography–mass spectrometry (GC–MS), GC–MS-MS, inductively coupled plasma–mass spectrometry (ICP-MS), and inductively coupled plasma–optical emission spectrometry (ICP-OES), are used in both nontargeted and targeted analyses of different food and wine products. Projects facilitating these instruments have been used to study the fate of important food components during processing; examples of these projects include phenotypic profiling in breeding trials and developing rapid quantitative methods for various taint compounds for the food and wine industry.
In this article, we specifically focus on trace elements and provide examples of how they yield additional and otherwise not accessible insight into beverage properties. Our examples highlight different aspects of wine processing and how elemental fingerprinting could provide valuable information about the geographical origin of a food or beverage (study 1). We also show how different steps in the production of wines impact their elemental composition (study 2).
Understanding the elemental profile of wines is important from several standpoints. Firstly, some elements are regulated, with most countries following the maximum legal limits established by the International Organization of Vine and Wine (OIV) (1). Examples for these are As, B, Br, Cd, Pb, and Zn, for which maximum legal limits in the upper parts per million (mg/L) to mid parts per billion (μg/L) have been defined.
Secondly, many elements impact the quality of vine and wine, as they are macro-, micro-, and trace nutrients for the vine plant or are used in agrochemicals. Some elements found in wine are the result of environmental deposition. Examples include Pb because of its use in gasoline, or Na in vineyards located near coastal areas (2). Additionally, some elements have detrimental effects on wine stability and need to be closely monitored during wine making (2). Examples for this are Cu and Fe, which can act as oxidation catalysts, and can also cause haze formation in wines, similar to Zn or Al.
Lastly, elemental fingerprints could be useful in the determination of geographical origin. Based on the differences in soil composition, and the reflection of these differences in plants grown in the soil, it has been proposed that some elements in a final food product could be representative of the origin. Previous research has shown that the elemental composition of soil and wine made of grapes grown on that soil are not well correlated (3), and this discrepancy could be explained by the numerous changes in the elemental fingerprint due to the wine-making process, including filtration, clarification, additions, and packaging and storage conditions (4–6). Only with a clear understanding of how each wine-making step affects the elemental content, and how large these changes are within one variety, one winery, and one wine-making region, could an elemental fingerprint be useful for tracing back the geographical origin of a bottle of wine. As a first step in developing this understanding, we evaluated the effect of growing regions on the elemental composition of wines and further studied the effect of packaging and temperature on changes in elemental composition that may occur during wine storage.
Experimental
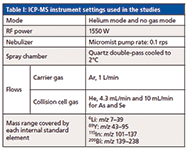
For all studies an Agilent 7700x ICP-MS instrument was used. Instrument settings are listed in Table I.
For the first, currently ongoing study, 65 red wines were sampled from five commercial wineries. All wines came from five vineyards located within 40 miles (64 km) of each other, and were located in two American viticultural areas (AVAs).

Table I: ICP-MS instrument settings used in the studies
The second study looked at changes in red Cabernet Sauvignon wine because of packaging and storage conditions. The samples were part of a larger research project and also included volatile, polyphenol, and sensory profiling. ICP-MS was used to characterize the elemental changes in the wines. The same Cabernet Sauvignon wine (vintage 2009, Northern California) was filled into four packaging configurations (3-L bag-in-box, 0.75-L glass bottle with a natural cork, two treatments with a 0.75-L glass bottle with an aluminum screw cap, and a tin-PVDC liner, differing in fill height [headspaces of 5 and 15 mm]). All packaging configurations were stored at 10 °C, 20 °C, and 40 °C for a period of six months before the various analyses took place. For more details, we refer the reader to the respective publications (6,7).
For all ICP-MS measurements, wine samples were diluted in duplicate (study 1) and triplicate (study 2) 1:3 with 5% nitric acid to decrease the ethanol content to around 4% (4,8–11). An internal standard solution (1 mg/L in 1% nitric acid) covering the m/z range from 6 to 209 was constantly fed into and mixed with the sample stream via a mixing tee. Monitored elements were calibrated in a range between 0–500 μg/L in matrix-matched solutions (4% ethanol, 5% nitric acid).
Elements that were detected above their respective detection limits were used for data analysis, which included multi- and univariate analysis of variance to determine statistical significant differences, as well as Tukey's test for multiple means comparison (honestly significant differences [HSD]). Principal component analysis (PCA) was used as an unsupervised multivariate data reduction technique to gain further insight in the differences among samples and determining the variables that explain most of the observed variance among the samples. Approximately, 95% confidence intervals (CI) were calculated via a bootstrapping algorithm to obtain variability measurements for each of the vineyards.
Results and Discussion
Study 1
The elemental composition of grapes is a reflection of both exogenous and endogenous factors, coming from both natural sources and human intervention. The use of a multielement fingerprint for the determination of geographical origin requires knowledge about the variability of said fingerprints within one region, as well as within wineries, countries, and continents.
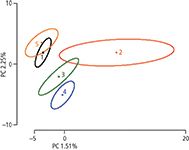
As a very first step, one needs to establish how much of the elemental variability is coming from the vineyard. In this ongoing study, we profiled 65 red wines from five different vineyards, from two different AVAs. Initial results showed that 39 elements differed significantly in their concentrations among the samples from the five different vineyards (P ≤ 0.05). Using the significant elements, samples are readily separated in a PCA as shown in Figure 1. More than 75% of the total variance is explained within the first two principal components. Wines from vineyards 1 and 5 as well as wines from vineyard 2 and 3 show more similarity to each other than to wines from the other vineyards, as their confidence intervals overlap. Wines from vineyard 4 differed significantly from all other vineyards as the confidence intervals around vineyard 4 did not overlap with any wines of other vineyard origins. Elements that contribute to the observed separation include rare earth elements as well as Ni, Ca, and Mg. However, a full understanding of the effects of geographic origin on metal content of wines will also require the analysis of the vineyard soils. This analysis is needed to fully understand and explain the sources for the observed differences in elemental composition of the wines.

Figure 1: Principal component analysis (PCA) showing the separation because of elemental differences in wines coming from the five vineyards. Circles around the means represent the 95% confidence intervals obtain via a bootstrapping algorithm.
Study 2
The last step in the wine-making process is packaging and storage of the finished wine. Because of the use of many different packaging configurations as well as storage conditions, it is important to understand how different packaging types can change the wine composition. Besides changes in the sensory properties, various chemical changes have been described, including volatile and nonvolatile changes (7).
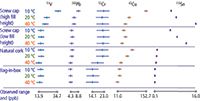
However, the elemental composition can also be changed because of storage and packaging conditions, as shown by our group (6). Storing the same wine for six months in different packaging configurations and at different temperatures led to significant changes (P ≤ 0.05) in five elements as shown in Figure 2. The elements V, Pb, Cr, Cu, and Sn showed significant differences between the 12 treatments because of both packaging and temperature effects. However, the measured levels were below the regulatory maximum levels if available: OIV (1): Cu 1 mg/L, Pb 0.15 mg/L; Croatia (12): Cr 0.1 mg/L, Sn 10 mg/L.

Figure 2: Elemental differences in the same red Cabernet Sauvignon wine because of storage conditions and packaging configuration. Error bars shown for each element represent the honestly significant differences (HSDs) from the Tukey test.
Higher V levels were found in the screw-capped samples with a high fill level, while all other packaging types showed lower concentrations of V. Additionally, with increasing storage temperature, V decreased, most likely because of precipitation of metal complexes with wine constituents such as polyphenols, peptides, and polysaccharides (2,13). The presence of V in wine has been previously reported by Almeida and colleagues (14) as a result of the use of V in stainless steel wine-making equipment.
For Pb, slightly higher levels were again found in the high-fill screw caps, with decreased levels in the wines stored at higher temperatures. Because of its use in gasoline before the 1980s, Pb is present in soil and the atmosphere so its presence in wine can be partially explained by this fact. However, one study monitored Pb throughout the wine-making process and found that up to two-thirds of the final Pb concentration in wine comes from within the winery, because of the use of Pb as a welding alloy and in small fittings (15).
Previous studies report Cr concentrations in wine between 7 μg/L and just below the legal limit of 100 μg/L. The levels we found were at the lower end of this spectrum with lower levels in the bag-in-box treatments compared to the bottle treatments. Cr showed a smaller temperature impact, and its presence in wine could be the result of contamination because of storage in stainless steel containers due to the use of Cr as an alloy element, or glass bottles, where chromium oxide is used as a bottle pigment (2,12).
For the last two elements, Cu and Sn, larger differences between the 12 treatments were found. While the first three elements (V, Pb, and Cr) showed an approximately twofold change, Cu and Sn were more affected by the different storage and packaging conditions — both elements showed at least a 10-fold change. Cu levels were most affected by storage temperature, with increasing temperature the Cu concentrations decreased. This is most likely because of metal complexes with wine components precipitating at higher temperatures, as described by others (2,13). Different routes for Cu in wine have been described before: Copper sulfate is used as a fungicide in vineyards to reduce fungal pressure, but can also be used in the winery for removal of hydrogen sulfide off-flavors. Another source for Cu in wine is the use of brass equipment in the wine-making process (2,12).
The presence of Sn in wine has never been reported before, and it is not regulated in wine with the exception of Croatia, which limits Sn levels in wine with 10 mg/L (12). Sn was only found in the screw-capped samples, making its origin most likely to be the tin-PVDC liner inside the screw cap. This theory would also explain the increase in Sn with increasing temperature, a phenomenon in contrast to all the other elements. With increasing temperature the wine expands and pushes against the liner inside the screw cap, thus, more Sn is leached into the wine over time (6).
Based on these findings one important question remains: If storage conditions, including packaging type and temperature, are able to change the elemental composition of wine, what are the consequences for the shelf life of wine when these elements are leached into the wine over time? Especially the effect of increased levels of the so called wine-sensitive elements (Al, Cu, Fe, Si, and Zn) on the wine properties needs to be assessed, as these elements have been shown to impact wine stability and the sensory properties of wine during wine making (16). A similar behavior can be expected during wine storage when these elements are present.
The elemental composition of wine can be changed by various factors throughout the grape growing and wine-making process. We showed that storage conditions can alter the elemental fingerprint of wine. Some of the elements that differed because of the storage conditions (for example, Cu) are so called wine-sensitive elements, meaning that they impact wine stability and quality during wine making, and it can be expected they have a similar impact during storage.
The use of an elemental fingerprint for the determination of geographical authenticity requires a deep knowledge about the wine-making process and how it can change the elemental composition. Wines coming from different vineyards differ in their elemental composition, but the question remains whether the observed differences are a result of the different vineyards or if the processing wineries contribute to these differences as well. Based on previous research, it can be assumed that wine making has an impact on the elemental composition of wine (4,5,14,15,17). Thus, the traceability of individual vineyards from the finished wine is highly dependent on how strong the winery impact is. This important piece of information is currently under investigation in our laboratory.
Conclusion
The measurement of elemental profiles of food and beverage products provides important information to increase and improve food and beverage quality. Besides wine-making processes such as clarification and filtration, the impact of processing and storage was highlighted by our work. Knowing how different packaging types can change the elemental fingerprint is of high importance for wine stability and shelf life.
Elemental fingerprints of high-priced food products such as wine also provide insight into possible contamination sources, for example, during processing, and how large these changes are compared to differences because of geographical origin.
Similar approaches of elemental profiling have been successfully applied to distilled spirits, including whiskeys, tequilas, and gins, and can be used to gain a deeper understanding of the processing impact on the elemental composition of diverse foods and beverages.
References
(1) International Organization of Vine and Wine (OIV), OIV-MA-C1-01: R2011 Maximum acceptable limits of various substances contained in wine, 2011.
(2) P. Pohl, TrAC Trends Anal. Chem. 26, 941–949 (2007).
(3) V.F. Taylor, H.P. Longerich, and J.D. Greenough, J. Agric. Food Chem. 51, 856–860 (2003).
(4) E.C. Rossano, Z. Szilágyi, A. Malorni, and G. Pocsfalvi, J. Agric. Food Chem. 55, 311–317 (2007).
(5) N. Jakubowski, E. Brandt, D. Stuewer, H.R. Eschnauer, and S. Görtges, Fresenius. J. Anal. Chem. 364, 424–428 (1999).
(6) H. Hopfer, J. Nelson, A.E. Mitchell, H. Heymann, and S.E. Ebeler, J. Anal. At. Spectrom. 28, 1288–1291 (2013).
(7) H. Hopfer, P.A. Buffon, S.E. Ebeler, and H. Heymann, J. Agric. Food Chem. 61, 3320–3334 (2013).
(8) A.W. Boorn and R.F. Browner, Anal. Chem. 54, 1402–1410 (1982).
(9) R.F.J. Dams, J. Goossens, and L. Moens, Mikrochim. Acta 119, 277–286 (1995).
(10) J. Goossens, T. Smaele, L. Moens, and R. Dams, Fresenius. J. Anal. Chem. 347, 119–125 (1993).
(11) J. Goossens, L. Moens, and R. Dams, Anal. Chim. Acta 293, 171–181 (1994).
(12) B. Tariba, Biol. Trace Elem. Res. 144, 143–156 (2011).
(13) R. Boulton, Am. J. Enol. Vitic . 52, 67–87 (2001).
(14) C.M.R. Almeida and M.T.S.D. Vasconcelos, J. Agric. Food Chem. 51, 4788–4798 (2003).
(15) C.M.R. Almeida and M.T.S.D. Vasconcelos, J. Agric. Food Chem. 51, 3012–3023 (2003).
(16) M. Aceto, in Reviews in Food and Nutrition Toxicity, R. Watson and V. Preedy, Eds. (Taylor & Francis, London, 2003), pp. 169–203.
(17) M.D.M. Castiñeira Gómez, R. Brandt, N. Jakubowski, and J.T. Andersson, J. Agric. Food Chem. 52, 2953–2961 (2004).
Helene Hopfer, PhD, is a postdoctoral scholar in the Department of Viticulture and Enology at the University of California in Davis, California. Jenny Nelson, PhD, is an application specialist in the Agilent Food Team in Santa Clara, California and an assistant adjunct professor in the Department of Viticulture and Enology at the University of California. Thomas S. Collins, PhD, is the director of research in the Food Safety and Measurement Facility at the University of California. Hildegarde Heymann is a professor of Enology at the Department of Viticulture and Enology at the University of California. Susan E. Ebeler is a professor of chemistry at the Department of Viticulture and Enology and the co-director of the Food Safety and Measurement Facility at the University of California. Direct correspondence to: hhopfer@ucdavis.edu

Geographical Traceability of Millet by Mid-Infrared Spectroscopy and Feature Extraction
February 13th 2025The study developed an effective mid-infrared spectroscopic identification model, combining principal component analysis (PCA) and support vector machine (SVM), to accurately determine the geographical origin of five types of millet with a recognition accuracy of up to 99.2% for the training set and 98.3% for the prediction set.
Authenticity Identification of Panax notoginseng by Terahertz Spectroscopy Combined with LS-SVM
In this article, it is explored whether THz-TDS combined with LS-SVM can be used to effectively identify the authenticity of Panax notoginseng, a traditional Chinese medicine.