How to Select the Appropriate Degrees of Freedom for Multivariate Calibration
June 1st 2016This column addresses the issue of degrees of freedom (df) for regression models. The use of smaller degrees of freedom (df) (e.g., n or n-1) underestimates the size of the standard error; and possibly the larger df (e.g., n-k-1) overestimates the size of the standard deviation. It seems one should use the same df for both SEE and SECV, but what is a clear statistical explanation for selecting the appropriate df? It is a good time to raise this question once again and it seems there is some confusion among experts about the use of df for the various calibration and prediction situations - the standard error parameters should be comparable and are related to the total independent samples, data channels containing information (i.e., wavelengths or wavenumbers), and number of factors or terms in the regression. By convention everyone could just choose a definition but is there a more correct one that should be verified and discussed for each case? The problem with this subject is in computing the standard deviation using different df without a more rigorous explanation and then putting an over emphasis on the actual number derived for SEE and SECV, rather than on using properly computed confidence intervals. Note that confidence limit computations for standard error have been discussed previously and are routinely derived in standard statistical texts (4).
Emerging Trends and Opportunities in Discrete-Frequency Infrared and Raman Spectroscopic Imaging
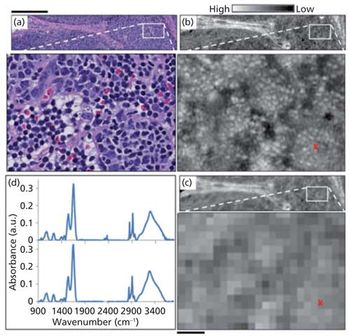
June 1st 2016Recent advances in instrumentation have enabled new forms of vibrational chemical imaging, including discrete frequency infrared (DFIR) microscopy and stimulated Raman scattering (SRS) microscopy. These technologies may represent a fundamental shift in how we approach spectroscopic imaging: rather than collecting full spectra which contain redundant information, measuring a few important spectral frequencies may enable significant gains in speed, throughput, signal to noise ratio, and/or image quality. For infrared microscopy, these advantages may be compounded by High Definition IR microscopy. Here we discuss recent advances in infrared and nonlinear Raman imaging through the lens of 'discrete frequency' approaches, including several examples of applications and critical issues in instrumentation that are likely to be dominating research themes in the near future.
LIBS at the Submicrometer Scale
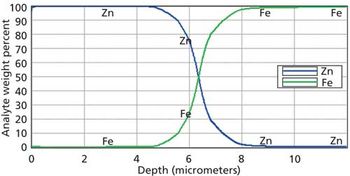
June 1st 2016Vassilia Zorba of Lawrence Berkeley National Laboratory in Berkeley, California, discusses what her studies have revealed about the mechanisms of plasma emission at small scales and what she has found when applying femtosecond LIBS to the study of advanced battery materials.
How Are ICP Methods Being Used in the Petroleum and Biofuels Industry?
June 1st 2016Inductively coupled plasma (ICP), coupled with optical emission spectroscopy (OES) and mass spectrometry (MS), has seen a lot of recent growth for the direct analysis of organic samples such as petroleum and biofuels. José-Luis Todolí of the University of Alicante in Spain talks about his work to improve the analytical figures of merit in ICP-OES and ICP-MS in these analyses.
Application of Miniature X-ray Sources to Residual Stress Measurements
June 1st 2016Miniature X-ray sources reached the development level that is appropriate for their use in the handheld and portable X-Ray diffraction (XRD) instruments. This note describes the application of X-ray sources for the residual stress measurements using XRD.