Analyzing the Elemental Composition of Fine Particulate Matter (PM2.5) Emitted as Air Pollution Using Inductively Coupled Plasma–Mass Spectrometry (ICP-MS)
Particulate matter (PM) contributes significantly to environmental pollution globally. Fine particulate matter with an aerodynamic diameter of 2.5 μm or smaller, classified as PM2.5, is of great concern on a global level. In contrast to exposure to bigger particles, exposure to PM2.5 is more dangerous because its small diameter makes it invisible to the human eye, and it has the potential to penetrate deep into the respiratory system when inhaled. The chemical composition of these particles may comprise both organic and inorganic components. Depending on the geographical location, PM2.5 can be contaminated with toxic elements such as arsenic, cadmium, or lead. Because of its high mobility, the presence of PM2.5 can be influenced by local environmental conditions. This study describes how interference-free, low-level analysis of toxic elements as well as major elements in PM 2.5 can be accomplished. Results of two different sample locations at Kanagawa prefecture in Japan are presented and compared against each other.
Inductively coupled plasma–mass spectrometry (ICP-MS) is the most widely employed technique for analyzing trace elements in environmental samples because it produces rapid multielement analysis and enables unmatched detection limits to be achieved. The high detection power of ICP-MS is a way to overcome the limitations of other analytical techniques (1). For example, ICP-MS can detect the potential presence of silicon in the PM2.5 fraction, which is something other techniques are insufficient in handling. The composition of PM2.5 is commonly analyzed using X-ray diffraction (XRD) or fluorescence (XRF), however, for some lighter elements, the low concentrations in samples can be problematic. The ICP-MS technique having the ability to detect the presence of silicon in the PM2.5 fraction is important because the consequences of inhaling fine dust containing silicon particles are that the particles can result in serious health risks after both short- and long-term exposure. As an example, significant exposure to silicon particles has been linked to the development of lung cancer in the human body (2). As a response to this research, the United States Environmental Protection Agency (EPA) has set a maximum allowance, a maximum allowance up to 12 μg/m3 (3).
Even if the sampling period is extended, the absolute amount of analyzed material may still not result in a significantly higher signal of the analyte because of the ultralow concentration. Therefore, it is important to analyze critical contaminants, such as silicon, at ultratrace levels with high accuracy using a more sensitive technique such as ICP-MS.
In this study, the ambient air samples were collected using a high-volume air collector system at two different locations. The PM2.5 fraction was collected on polytetrafluoroethylene (PTFE) filters, which were analyzed using triple quadrupole (TQ) ICP-MS following microwave digestion. The resulting concentrations in the measured solutions were typically below 1 μg/L, so the high detection power of ICP-MS was needed for accurate quantitation of the elemental composition.
Experimental
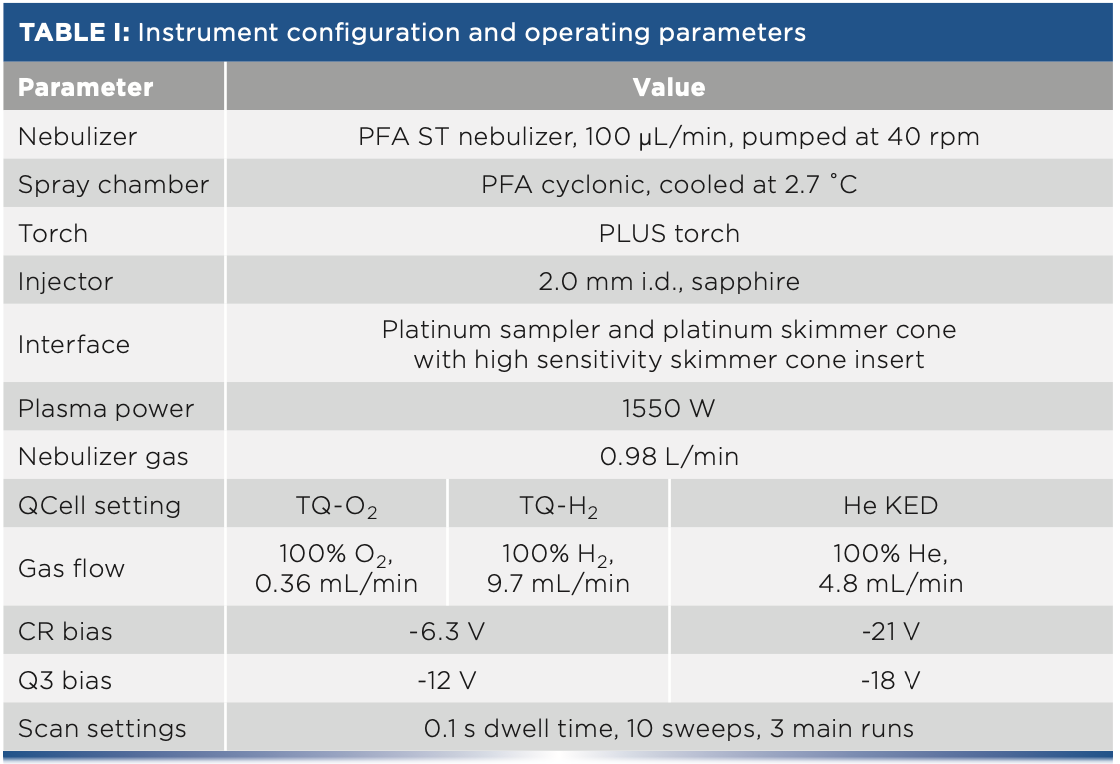
A Thermo Scientific iCAP TQ ICP-MS instrument was used for all measurements. Table I gives an overview of the full configuration of the system. The instrument used in this study was equipped with a novel torch made from high-purity ceramic, replacing the standard torch (typically made from high purity quartz). This special torch, in conjunction with superior interference removal based on the use of TQ technology, enabled the detection of silicon at concentration levels well below the regulatory requirement.
Sample Preparation
Each air sample was collected from two different locations in the Kanagawa prefecture in Japan over a 24 h period. The air samples were collected onto a 47 mm diameter PTFE filter (Pall Corporation) with a 2 μm pore size, using a sequential ambient particulate sampler (Partisol 2025i, Thermo Fisher Scientific) at 16.7 L/min (or 1 m3/hr). Both sampling locations were in the Kanagawa prefecture, one within a municipal area, whereas the second location was close to a motorway.
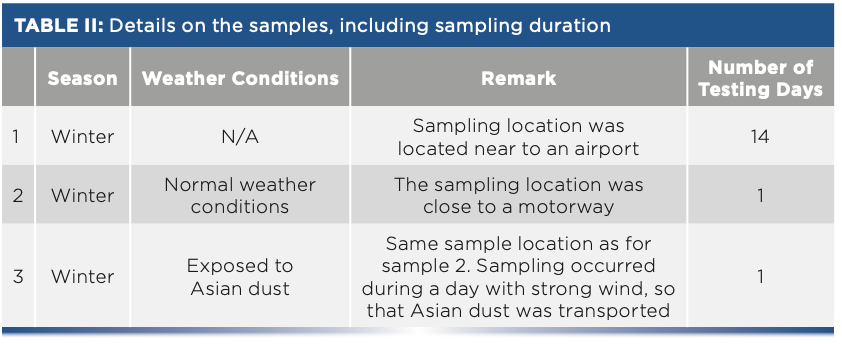
To monitor and quantify changes in the elemental composition of PM2.5, air samples were collected over a period of 14 days at one of the sampling sites. In a second study, the influence from Asian dust was evaluated at the second sampling location. Asian dust is defined as a seasonal metrological phenomenon, where large amounts of yellow sand are transported from the deserts of western Asia (mostly originating from Kazakhstan, Mongolia, and northern China) eastward towards China, the Korean Peninsula, and Japan. Because of industrial pollution, this phenomenon is becoming an increasing concern. The summary of the details about Asian dust is shown in Table II.
The filters with collected air were digested by a microwave using a mixture of 5 mL HNO3 (68% Optima grade, Fisher Chemicals), 2 mL HF (48% Optima grade, Fisher Chemicals) and 1 mL H2O2 (31% Optima grade, Fisher Chemicals) in a vessel microwave digestion system (Milestone Ethos 1). After digestion, the samples size was increased to 50 mL using ultrapure water. In all digestions, an unused filter was digested using the same procedure as a control to assess potential contamination in the process of sample preparation.
All blanks and calibration standards were prepared from 2% (v/v) HNO3) with multielement standards (XSTC-1667 and XSTC-1668, Spex CertiPrep). An internal standard solution containing 5 μg/L lithium, yttrium, indium, and thallium was added to all samples.
Results and Discussion
Silicon is an analyte of special importance for the evaluating the elemental composition of fine dust because of its potential to cause severe respiratory diseases (such as silicosis) when it penetrates the human body deeply. Based on current legislation by the Ministry of the Environment in Japan, a minimum required detection limit (MRDL) of 10 ng/mL is set for this element, which is often one of the main components of PM2.5. Therefore, it is required to detect this element with high sensitivity and low background. The regulatory limit corresponds to a final concentration in a sample collected over 24 h and following the above sample preparation procedure. The result is that the final concentration of the sample is less than 5 μg/L. Often, the filter sample may be split in half to allow for additional measurements to be taken, further reducing the concentration in the analyzed solution for this critical contaminant.
Silicon is known as a challenging analyte in ICP-MS, mostly because of the polyatomic interferences arising from nitrogen in the ambient atmosphere (creating 14N2+ on the most abundant isotope 28Si), but also contamination from the ubiquitous presence of the element in the laboratory and the glassware used in the ICP-MS source.
The resulting calibration curve for silicon using a mass shift reaction with oxygen is shown in Figure 1. The calibrated concentration range was between 0–100 μg/L (with calibration points at 5, 10, 25, 50, and 100 μg/L) and returned an instrumental detection limit (IDL) of 0.081 μg/L and a blank equivalent concentration (BEC) of 1.9 μg/L. The IDL was calculated using three times the standard deviation of 10 replicate measurements of the calibration blank.
FIGURE 1: Calibration curve for silicon from 5 to 100 μg/L.
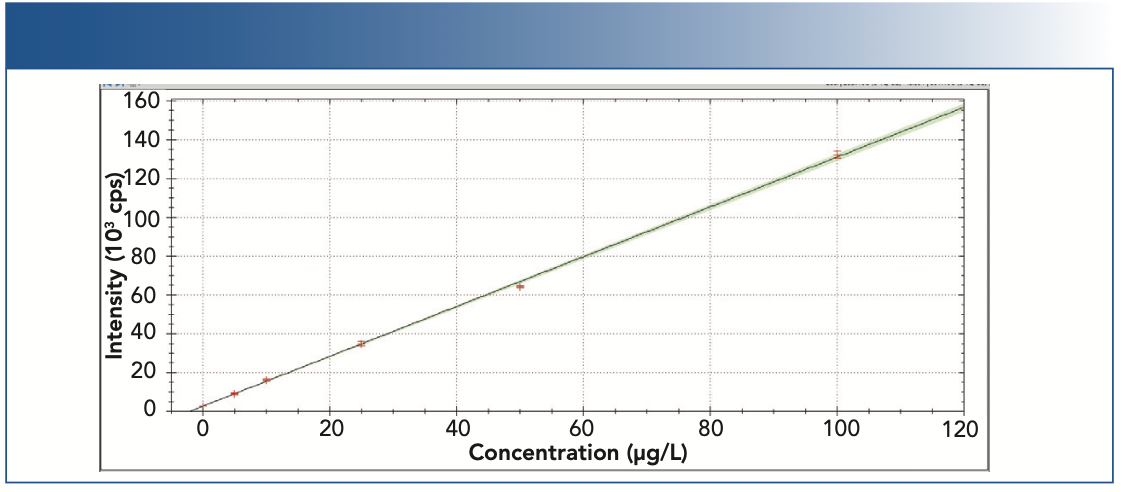
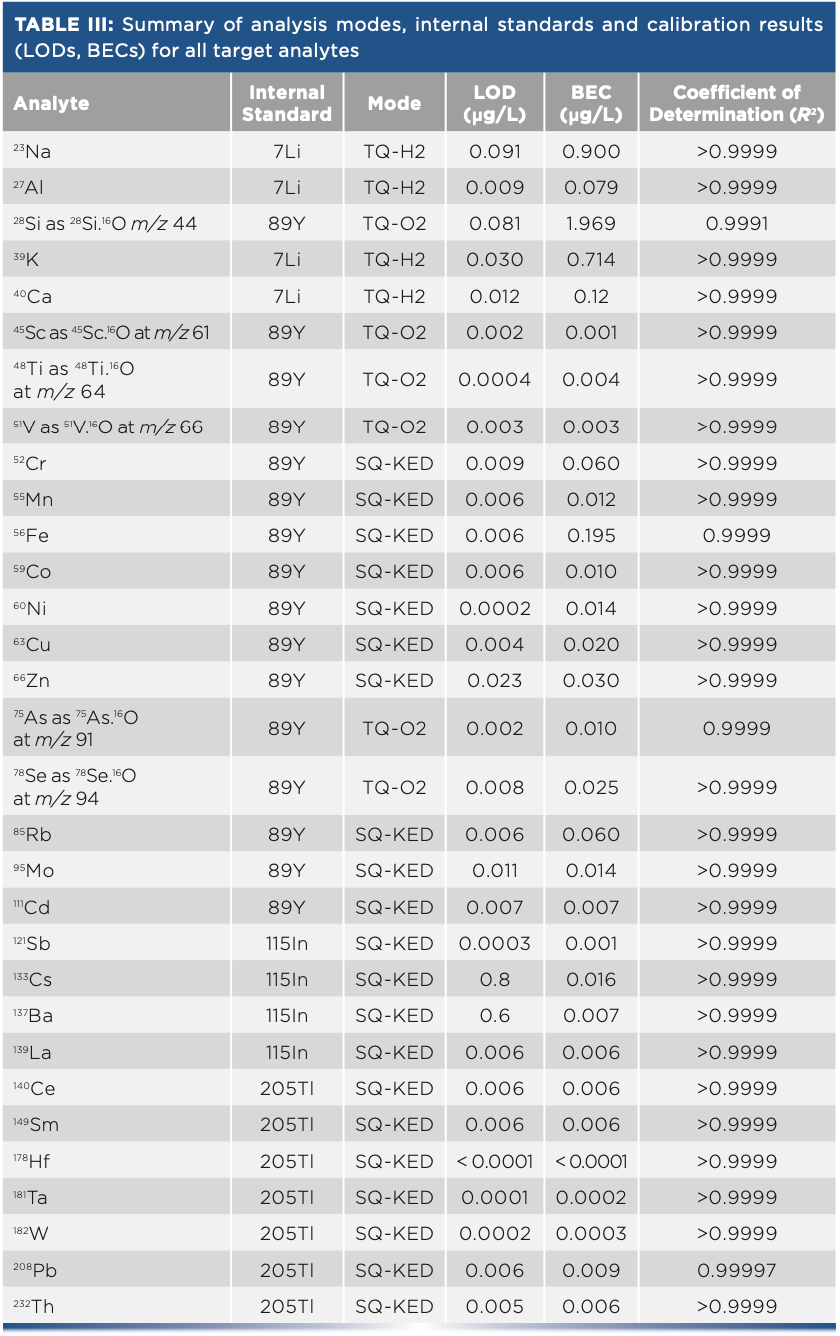
Table III summarizes the obtained analytical figures of merit (IDL, BEC, and R2) for all 31 elements analyzed in this study. The typically achieved IDLs were well below 0.1 μg/L, even for often challenging analytes, such as arsenic, selenium, or cadmium.
To comply with applicable legislation, all analysis results (obtained as μg/L) were converted into mass per volume in the PM2.5 fraction (in ng/m3) using the following equation:

where C represents the mass of the analyte in fine particulate matter PM2.5 in 1 m3 of the sampled air (ng/m3); Ms is the result of the analysis of the sample (ng/mL); Mb represents the result of the analysis of the preparation blank (ng/mL); E is the volume of the test solution (mL); S is the PM2.5 filter area where the sample was collected (cm2); s is the filter area used for analysis (1/4 of S (cm2)); and V is the collected volume of ambient air (m3).
Table IV shows the results for all elements that were studied across both sampling locations. The obtained results for the analysis of the elemental composition of the PM2.5 fraction clearly provides meaningful evidence to evaluate the pollution level because of the possibility to determine a wide range of elements in a single analysis.
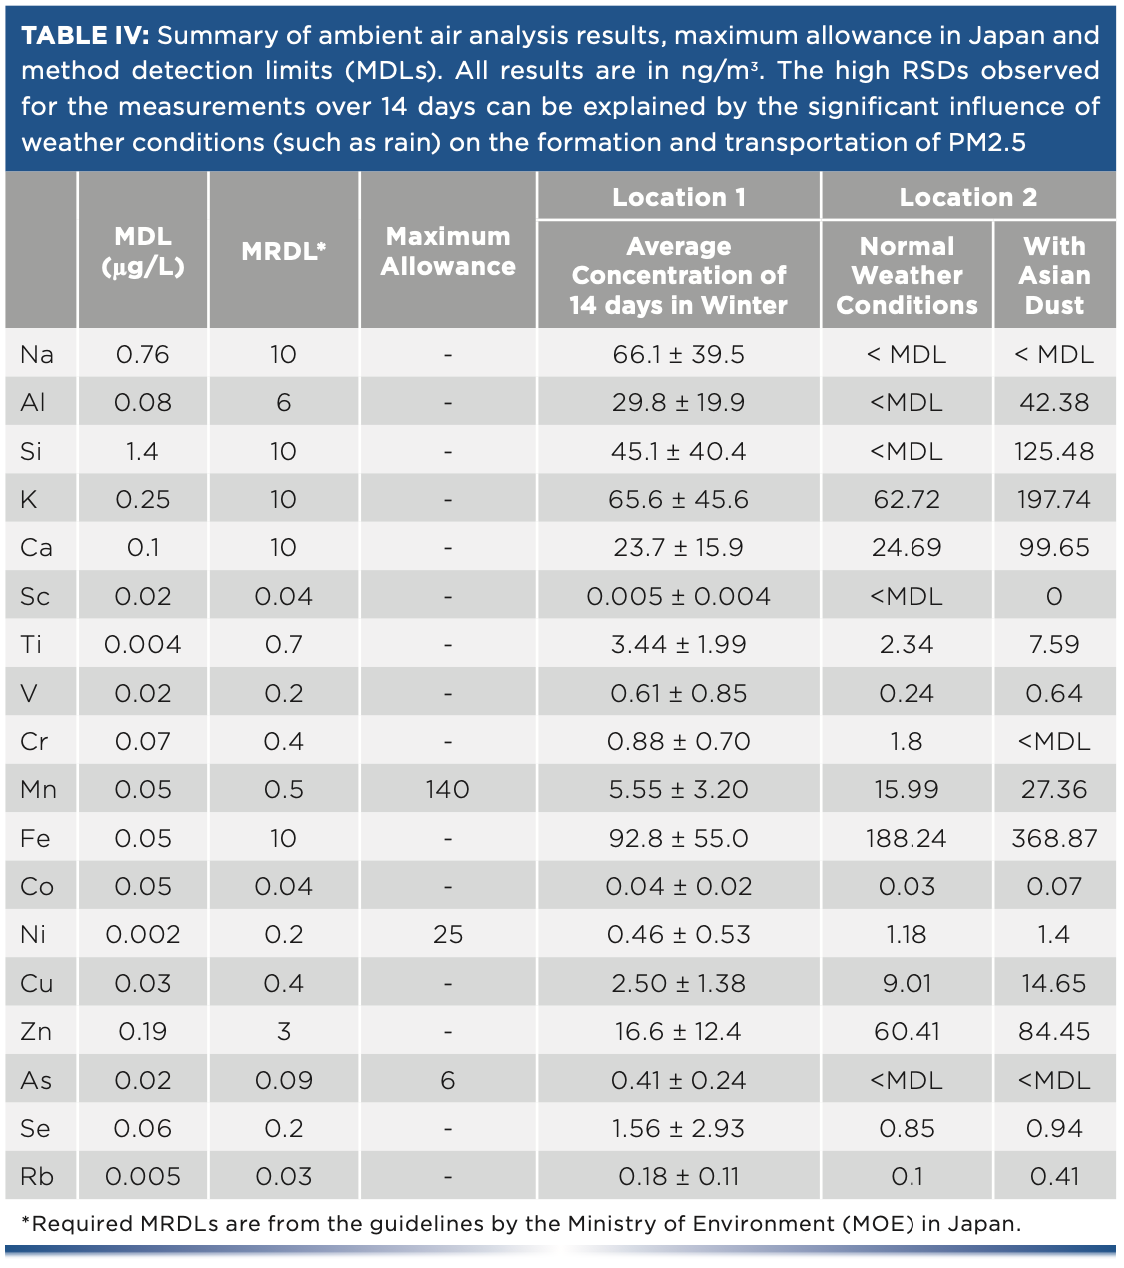
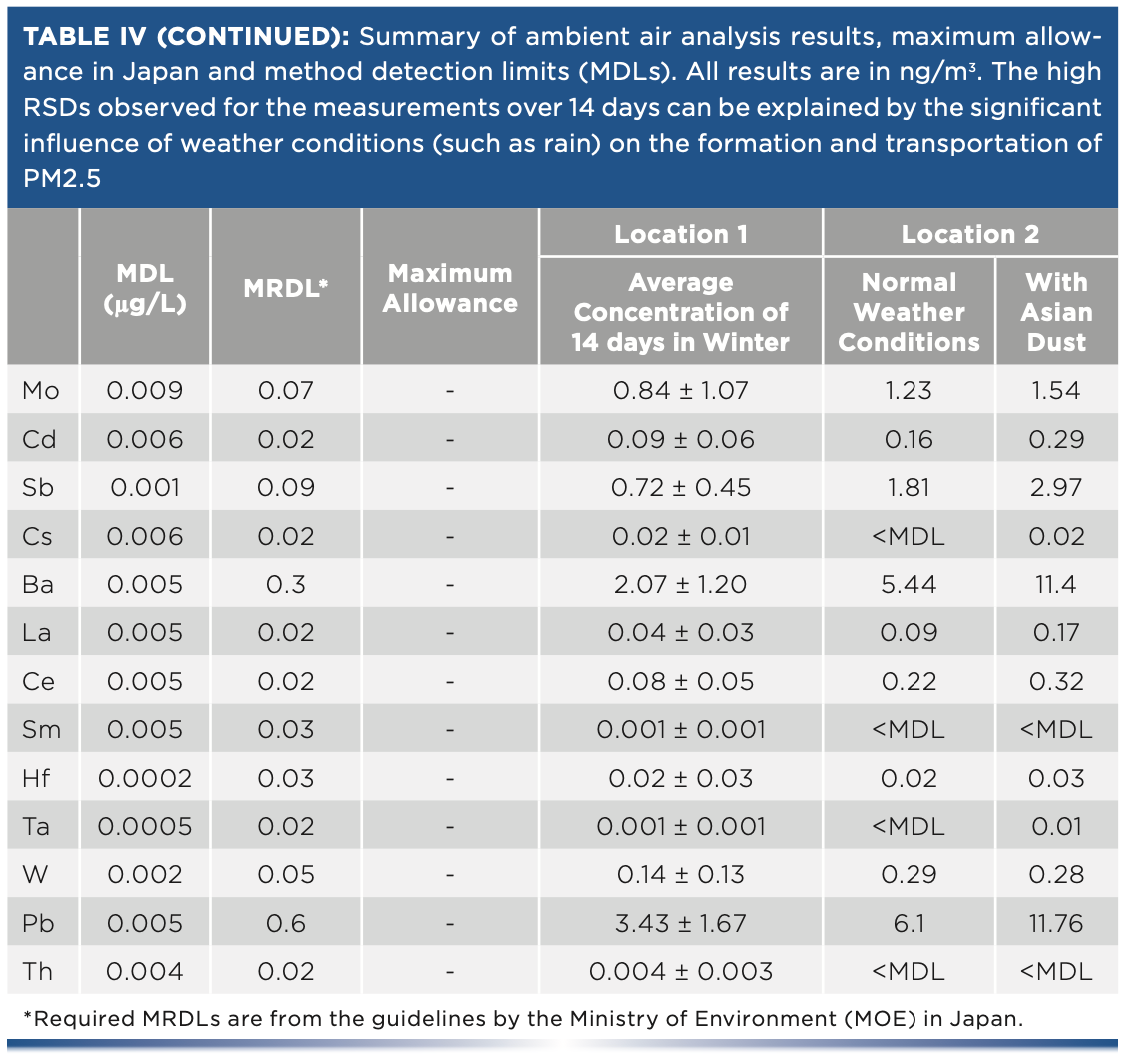
The composition of PM2.5 at sample location two shows a higher presence of typical wear metals, such as iron, nickel, copper, or zinc. Other metals, such as molybdenum, antimony, and lead were significantly increased in this size fraction. This is likely related to the higher urbanization and the specific sampling location near by a motorway. Although these concentrations cannot readily be compared to another location, an increase of other elements, including silicon or sodium, could be expected in more rural locations, such as the adjacent Yamanashi prefecture. Agricultural activities usually lead to a higher erosion of soils, which may specifically liberate small particles containing these elements.
Although measurements were only accomplished during a single day, the presence of Asian dust as a temporary weather phenomenon has an observable influence on the elemental composition of the collected PM2.5 fraction. Whereas PM2.5 seems to generally contain a certain level of silicon in sampling location (2), this element is significantly increased under the influence of Asian dust. A similar tendency is also observed for other elements commonly found in sand, such as aluminum, potassium, and calcium. The influence of Asian dust also seems to have an impact on the observed levels of wear metals present in the PM2.5 fraction, with elements such as iron and zinc, but also antimony and lead being increased. Whether this is because of transportation from other locations or within the area around the sampling location could not be confirmed in this study.
Conclusion
A highly sensitive method for the analysis of the elemental composition of PM2.5 was developed and applied to the analysis of samples derived from two sampling locations in Japan. Using a combination of reactive gases (O2 and H2) and Helium (He) kinetic energy discrimination (KED) mode, respectively, common interferences on important contaminants were eliminated and excellent signal-to-noise (S/N) ratios were obtained across all elements under study. As an analyte of concern, silicon could be detected at levels well below the minimum required detection limit because of superior interference removal and reduced backgrounds using a novel ceramic torch. The new method allowed the simultaneous assessment of 31 elements in one analysis, helping to get a better understanding of the natural and anthropogenic processing contributing to the composition of PM2.5.
Acknowledgments
The authors would like to thank the Taiki Kankyou Innovation Center Group at Seikan Kensa for supporting sample preparation and this research.
References
(1) R. Seibert, I. Nikolova, V. Volná, B. Krejci, D. Hladký, Atmosphere 11(5), 522 (2020).
(2) T. Sato and T. Shimosato, Lung Cancer: Targets Ther. 9, 91–101 (2018).
(3) United States Environmental Protection Agency, National Ambient Air Quality Standards for Particulate Matter, Final Rule (2013).
Tomoko Vincent and Daniel Kutscher are with Thermo Fisher Scientific in Bremen, Germany. Naoki Iwayama is with the Seikan Kensa Center in Japan. Tokutaka Ikemoto is with Thermo Fisher Scientific in Yokohama, Japan. Direct correspondence to: daniel.kutscher@thermofisher.com.

Trending on Spectroscopy: The Top Content of 2024
December 30th 2024In 2024, we launched multiple content series, covered major conferences, presented two awards, and continued our monthly Analytically Speaking episodes. Below, you'll find a selection of the most popular content from Spectroscopy over the past year.