Application of Laser Ablation ICP-MS to the Analysis of Forensic Glass Samples
Laser ablation ICP-MS enables identification and comparison of physical crime-scene evidence. Discriminating elemental and isotopic differences of solid samples directly at the parts-per-billion level provides forensic scientists with a powerful analytical tool.
hysical evidence often is distributed widely when a crime is being committed. The smaller these suspect materials are, the more likely they will be transported from the crime scene undetected. For example, when glass is shattered, the fragments created can be less than a few hundred micrometers (<0.2 mm). These fragments can become attached to clothing and embedded in shoes, "tagging" the criminal with a unique marker. Another important factor for the forensic investigator is being able to present data clearly and unambiguously in a court of law.
Traditional techniques for the analysis of forensic samples such as glass fragments include the determination of a number of physical properties, including refractive index (RI), wet chemistry, scanning electron microscopy (SEM), X-ray fluorescence (XRF), and optical microscopy (1). Although these techniques offer a high degree of differentiation with traditional glass, modern glass has a greater degree of chemical and physical similarity. The major and minor elemental composition and RI values of these new materials are becoming more difficult to discriminate. The histograms in Figures 1a and 1b show RI values for flat glass extracted from an FBI database for the periods of 1964–1979 and 1980–1997, respectively (2). Comparison of the two charts clearly shows the reduced opportunity for inter-sample discrimination using this technique.
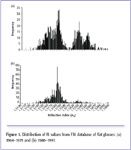
Figure 1. Distribution of RI values from FBI database of flat glasses: (a) 1964-1979 and (b) 1980-1997.
LA-ICP-MS as a Sampling Technique
Quadrupole inductively coupled plasma mass spectrometry (ICP-MS) enables the analysis of elements across the periodic table with very low detection limits. Typically, samples are introduced into an ICP-MS by aspirating a solution of the sample. Often, liquid samples require little preparation, but without a solid sampling accessory, solid samples need to be dissolved. This process is time-consuming and often requires the use of acid-dissolution reagents and additional sample preparation apparatus. Adding chemicals such as hydrofluoric acid to dissolve the sample can give rise to matrix-based interferences forming in the plasma, as well as being a potential source of contamination. Additionally, aqueous analysis typically has minimum requirements for sampling mass. A 200-µm glass shard, entangled in clothing, is an insufficient quantity for reliable aqueous results of the trace elements. In contrast, combining ICP-MS with the direct solid-sample introduction technique of laser ablation (LA) requires minimal sample preparation. LA-ICP-MS provides an excellent and relatively nondestructive technique for elemental analysis of forensic samples that are difficult to digest, or where small fragments or inclusions must be analyzed. LA-ICP-MS is amenable particularly to time-resolved analysis (TRA); enabling direct comparison of samples in three dimensions. Combining such flexible data-handling capabilities with in-situ solid sampling enhances the discriminating power of samples with similar visual, physical, and chemical characteristics, strengthening the analyst's ability to determine the similarities and differences within large data sets. These attributes, combined with low levels of detection and high precision, explain the increasing acceptance of LA-ICP-MS for investigation of forensic samples.
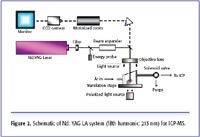
Figure 2. Schematic of Nd: YAG LA system (fifth harmonic: 213 nm) for ICP-MS.
Principles of LA-ICP-MS
The sample surface is irradiated with deep-UV (213 nm) output from a frequency-quintupled Nd:YAG (neodymium doped yttrium aluminum garnet crystal) laser, as shown in Figure 2. The high-intensity pulsed ultraviolet (UV) beam is focused onto the sample surface in an ablation chamber or cell, which is purged with argon. The UV beam diameter can be accurately set by 12 software-controlled apertures to produce variable "spot" sizes from <5 µm to 300 µm depending upon the application. The high power, short-wavelength 213-nm laser couples directly with the sample matrix, with high absorption efficiency, reducing or eliminating plasma induced fractionation. The resultant laser-induced aerosol is then transported to the inductively coupled plasma in an argon carrier gas stream where it is decomposed, atomized and ionized, before extraction into the mass spectrometer vacuum system for analysis. Calibration typically is undertaken using a well-characterized synthetic solid material, such as NIST 612 Trace Elements in Glass or other suitable solid certified reference material (CRM).
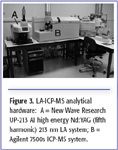
Figure 3. LA-ICP-MS analytical hardware: A = New Wave Research UP-213 AI high energy Nd:YAG (fifth harmonic) 213 nm LA system; B = Agilent 7500s ICP-MS system.
Instrumentation
All the analyses for these experiments were undertaken using an Agilent 7500s ICP-MS system (Agilent Technologies, Inc., Palo Alto, CA). Solid sampling was achieved by introducing a stream of particles generated in situ by direct coupling of short UV laser with the sample surface into the ICP using a stable flow of argon gas. The laser system used was a New Wave Research (Fremont, CA) UP-213AI Nd:YAG operating at the fifth harmonic frequency (213 nm). Due to the nature of LA solid sampling (that is, revealing sample microheterogeneity) and the desire for high spatial and temporal resolution, in situ, the most suitable ICP-MS system for coupling to a laser ablation sample introduction device must be capable of capturing these transient events. The photograph in Figure 3 shows the system used for this study. Operating parameters for each experiment are given in Table I.

Table I. LA-ICP-MS operating conditions for the analysis of glass fragments.
Experimental - Analysis of Glass
Calibration of the LA-ICP-MS system was carried out using a glass standard obtained from National Institute of Science and Technology (NIST USA): NIST SRM 612: 50 µg/g nominal trace element concentration. Matrix elements: Si (SiO
2
), Na (Na
2
O), Ca (CaO), Al (Al
2
O
3
).

Table II. Results for NIST SRM 612 major and trace multielements analyzed as a sample compared to certified values.
NIST soda lime glass standards (620, 621 and 1831) were used as surrogates for clear forensic glass samples. It was possible therefore to check the accuracy and the precision of the calculated values by comparing them with the certified values given for the major elements (Table II). Each sample was placed in a separate, sealed plastic bag and shattered. The small fragments (0.5 mm to 2 mm) were attached to a petrographic slide using double-sided graphite tape. This process was repeated for all the surrogates, as well as the three headlamp samples (Figure 4).
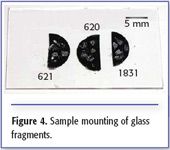
Figure 4. Sample mounting of glass fragments.
NIST 612 standard glass was used as a means of calibration and was analyzed repeatedly throughout the analysis procedure, bracketing each sample set. Each sample analysis was 115 s and consisted of a 20-s blank delay, a 60-s laser sampling period, followed by a 35-s washout period. Six repetitive data acquisitions over two separate rastor lines were collected for each sample. The data was imported into Glitter data reduction software (Macquarie University – GEMOC, Australia). Analyte and blank regions were defined within the Signal Selection Screen (Figure 5) and quantitative values were determined. The mean and standard deviation (SD) for each sample was then calculated (Table IIIa).

Figure 5. Signal selection screen, Glitter data reduction software. Traditionally used in geochronology, forensic data benefits from the ability of this software to enable easy isolation of changing data sets within a heterogeneous sample matrix. Each sample has its own associated blank, reducing memory effects.
Discrimination of Clear Glass Fragments
Three sets of automobile headlamp fragments and three sets of NIST soda lime glass standard fragments were chosen as forensic sample surrogates for this study. All glass samples were colorless to the naked eye. Time- resolved data was imported directly into Glitter data reduction software from the Agilent 7500s ICP-MS ChemStation software. Blank and sample integration areas were defined within the Signal Selection screen (Figure 5) and elemental concentrations were calculated using NIST 612 as the multi-element standard (Table III). Though the glass fragments were typically <1 mm, (Figure 4), elemental recoveries for the NIST certified values, information values, and literature values were very good and RSDs were <3% for many elements. NIST soda-lime glass standards 620 (flat glass), 621 (container glass), and 1831 (sheet glass) were used to emulate samples. The good agreement between the reference values and the returned values support the efficacy of the method used. Though the Mg values are consistently high by approximately 40%, the data suggests that this is likely due to a problem with the calibration standard either because of an inhomogeneous distribution of the element, or even possibly variation in the certified value. In this study, the literature value for Mg in NIST 612 was defined as 77.44 µg/g, 1σ = 30.15 µg/g (4). Another study published the NIST 612 Mg value as 64 µg/g, 1σ = 6 µg/g (5).
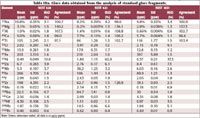
Table IIIa. Glass data obtained from the analysis of standard glass fragments.
Presentation of Data
Forensic data must be presented in the most accurate and clearly understandable format. Jurors with little or no scientific background must be able to decipher subtle chemical differences between evidentiary materials. Consequently, the glass data can be presented in two discriminating formats: numerically and stacked bar graphs (Tables IIIa and b and Figure 6). Stacked bar graphs are extremely effective in comparing different multicomponent data sets. We have therefore included the quantitative mean values with 1σ SD (Tables IIIa and b). Like gel electrophoresis, banding patterns within an elemental data set are easy to visualize and differentiate. Stacked bar charts can characterize clearly the elemental nature of a unique sample type. Notice the clear and even banding pattern of NIST 612 (first bar Figure 6). In NIST 612, all elements with the exception of Sr (76 ppm) are nominally at equal concentration (50 ppm), which the banding pattern clearly portrays. The NIST glass serves not only as a quantitative standard, but also demonstrates the effectiveness of the stacked bar chart in its ability to compare trace element constituents.
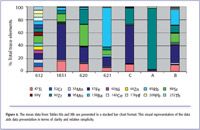
Figure 6. The mean data from Tables IIIa and IIIb are presented in a stacked bar chart format. This visual representation of the data aids data presentation in terms of clarity and relative simplicity.
Conclusions
LA-ICP-MS is an effective tool for the analysis of a wide variety of forensic samples. This technique is particularly effective in overcoming the limitations associated with very small sample types or samples composed of chemically inert materials. Colorless glass fragments, indistinguishable to the naked eye and chemically identical at the ppm level, may be identified with good accuracy and precision, even at submillimeter dimensions. Due to the micro-destructive nature of this technique, forensic samples characterized by this method may also be available to alternative analysis if confirmation is required.
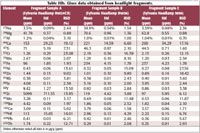
Table IIIb. Glass data obtained from headlight fragments.
Often a clear visual representation of the data is produced using a suitable plotting program making it easier to discriminate samples with similar visual, physical, and chemical characteristics. By combining powerful, in situ microanalysis, low levels of detection, high precision, and clear and easily understandable diagrams, LA-ICP-MS is becoming an increasingly important weapon in the arsenal of forensic science.
Lawrence M. Neufeld is worldwide applications and marketing manager of laser ablation products at New Wave Research. E-mail: lneufeld@new-wave.com.
References
1. R.J. Watling, B.F. Lynch, and D. Herring,
JAAS
12
, 195–203 (1997).
2. R. Koons and J. Buscaglia, Forensic Sci. Commun. 3, http://www.fbi.gov/hq/lab/fsc/backissu/jan2001/koons.htm (2001).
3. A. Dobney, W. Wiarda, P. de Joode, and G. van der Peijl, Forensic Tape Investigations, Presentation at 2nd EAFS Meeting, Sept. 24, 2000, Cracow.
4. N.J.G. Pearce et al., Geostandards Newsletter 21, 115–144 (1997).
5. S. Gao et al., Geostandards Newsletter 22, 181–196 (2002).

The State of Forensic Science: Previewing an Upcoming AAFS Video Series
March 10th 2025Here, we provide a preview of our upcoming multi-day video series that will focus on recapping the American Academy of Forensic Sciences Conference, as well as documenting the current state of the forensic science industry.
Previewing the American Academy of Forensic Sciences Conference
February 14th 2025This year, the American Academy of Forensic Sciences Conference is taking place from February 17–22, 2025. We highlight the importance of spectroscopy in this field and why we’re covering the conference this year.