Comprehensive Fragrance Profiling of Ginger, Wintergreen, and Rosemary Essential Oils by GC–TOF-MS with Soft Electron Ionization
Special Issues
This article investigates the use of gas chromatography–time-of-flight mass spectrometry (GC–TOF MS) to fragrance-profile three essential oils (ginger, wintergreen and rosemary). As well as considering the compositional differences between the oils, we will examine the use of peak deconvolution to identify closely-eluting compounds, and explore the use of soft electron ionization, assisted by comparison of ion ratios, to discriminate between isomeric monoterpenes that are difficult to identify at conventional 70 eV ionization energies due to their very similar mass spectra.
This article investigates the use of gas chromatography–time–of–flight mass spectrometry (GC–TOF–MS) to fragrance–profile three essential oils (ginger, wintergreen, and rosemary). In addition to considering the compositional differences between the oils, we examine the use of peak deconvolution to identify closely eluted compounds, and explore the use of soft electron ionization, assisted by comparison of ion ratios, to discriminate between isomeric monoterpenes that are difficult to identify at conventional 70–eV ionization energies because of their very similar mass spectra.
The volatile oils of plants, commonly known as essential oils, have been used since antiquity for their flavor and fragrance, and in more recent times for their medicinal properties. Industrially, the vast majority of essential oils are steam–distilled from the source plant material in which they occur, and the use of this technique means that components of essential oils are generally fairly hydrophobic, with molecular masses below about 300 Da (1).
A wide range of compound types, derived from a number of biosynthetic pathways, are found in essential oils (2). Terpenoids are the most important group of compounds found in essential oils, with monoterpenoids (C10) and sesquiterpenoids (C15) typically predominating. Monoterpenoids generally contribute the major fragrance notes, but the low olfactory thresholds of some sesquiterpenoids mean that although they have lower volatilities, they can nevertheless provide significant “end note” contributions. Other components of essential oils include polyketides (including medium–chain alkanes, alkenes, aldehydes, ketones, and esters) and aromatic compounds such as eugenol, methyl salicylate, and vanillin.
Analysis of Essential Oils
Analysis of essential oils began in earnest in the 19th century, but detailed studies of their composition had to await the development of advanced analytical techniques from the 1950s onward. Today, gas chromatography (GC) coupled with detection techniques such as mass spectrometry (MS) and flame ionization detection (FID) is by far the most widely used because of its ability to separate the constituent compounds, and identify or quantify them (3). Despite the success of these basic methods, interest in refining them continues, for three main reasons.
Firstly, the variation of the aromatic quality of essential oils often depends critically on the proportions of a large number of components. Being derived from natural sources, these proportions are sensitive to natural variation between cultivars and plants at different stages of growth, environmental conditions during plant growth, harvesting and processing methodologies, and storage conditions. Therefore, rigorous quality control procedures are required to ensure that essential oils do not vary significantly from initial reference batches or (in some cases) international standards for composition (4).
Secondly, because essential oils are raw materials for the fragrance industry, there is a need to ensure that they adhere to new legislation on allergens, such as the 2003 European Union (EU) Directive on “wash–on” and “wash–off” cosmetics (5).
Finally, and of interest most recently, the high value of essential oils drives unscrupulous traders to adulterate them with bulk chemicals or cheaper oils with similar characteristics. This leads to a need to detect and check such adulteration, which in turn requires a deep understanding of the chemical compositions of authentic oils and possible adulterants (6).
All of the three factors above are in addition to the demands familiar to every analytical chemist––reducing analysis time and expense, improving confidence in analyte speciation, and broadening versatility and robustness of the analytical technique. Significant advances are being made in all of these areas, for example using techniques such as GC×GC to comprehensively analyze the more complex essential oils (7,8).
Soft Electron Ionization for TOF–MS
Gas chromatography coupled with quadrupole mass spectrometry (GC–MS) has long been the standard method for qualitative and quantitative analysis of essential oils, with a combination of retention indices and mass spectra being used to confirm the identity of individual analytes. However, certain analytes remain challenging even with such technologies, because of their weak molecular ions or their propensity to fragment extensively at conventional (70–eV) ionization energies.
A solution to this problem is to run the analysis at a lower (“softer”) ionization energy to reduce the degree of analyte fragmentation and provide more information about the larger, more structurally significant fragments. However, GC–amenable compounds are typically analyzed using electron ionization (EI), which previously has given poor results at energies below the conventional 70 eV because of a dramatic loss of signal. The main soft ionization alternative––chemical ionization (CI)––generally requires a different ion–source configuration, with additional source pressurization and the use of reagent gases. If a single instrument is being used, this transition can be time–consuming and a considerable drain on laboratory resources if required on a regular basis.
Overcoming these issues is a new e–gun design for time–of–flight (TOF) mass spectrometers that allows the ionization energy to be varied on a sliding scale from conventional 70 eV to lower energies, without compromising sensitivity (Figure 1). The physical properties of most small molecules mean that relatively small differences in ionization energies between 10 and 20 eV can have significant differences in the fragmentation pattern. Typically, however, an ionization energy of about 12 eV retains a useful degree of fragmentation while avoiding loss in sensitivity relating to the unavoidable drop–off in ionization efficiency as the ionization potential is approached.
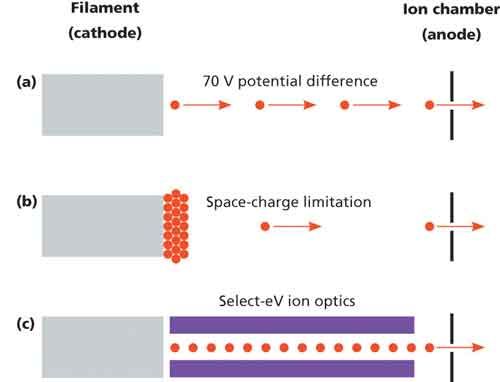
Figure 1: The operation of an electron ionization ion source using (a) conventional (70 eV) ionization energies, (b) low ionization energies, and (c) variable-energy ionization.
This technique has already been applied to studies of samples containing analytes that are challenging to differentiate with conventional 70 eV ionization––including hydrocarbons (9,10) and certain groups of environmental contaminants (11). An additional development improves laboratory efficiency by allowing 70 eV and low–eV spectra to be acquired simultaneously, with two sets of spectra being generated for every peak across the whole analytical run (Figure 2). This also allows ion ratios between low–eV and 70–eV spectra to be used as an additional qualifier for compound identification, which is especially useful for the speciation of similar terpenes in essential oils.
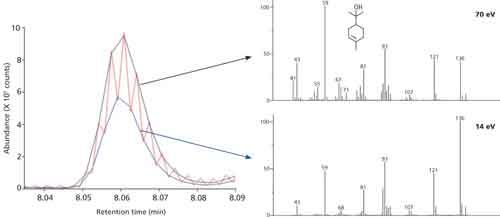
Figure 2: Section of a GC–TOF-MS chromatogram running with tandem acquisition of spectra at 70 eV (black trace, top right spectrum) and 14 eV (blue trace, bottom right spectrum). The red trace represents the raw multiplexed data.
An additional advantage of time–of–flight mass spectrometry (TOF–MS) for this application, compared to conventional quadrupole instruments, is the ability to record full–range mass spectral information to extremely high densities (10,000 transient spectral accumulations per second). This density of information enables algorithms to uncover peaks that are masked by matrix interferences, or––of particular relevance to essential oils––deconvolve coeluted peaks to obtain cleaner spectra and consequently improve the confidence in identification.
This article demonstrates the use of GC–TOF–MS to compare the volatile components of ginger, wintergreen, and rosemary essential oils. We also show how peak deconvolution algorithms can be used to confidently identify coeluted analytes, and explore the use of soft EI, assisted by comparison of ion ratios, to discriminate between isomeric monoterpenes with very similar mass spectra at conventional 70–eV ionization energies.
Experimental
Sample Preparation
Ginger oil (Zingiber officinale), wintergreen oil (Gaultheria procumbens), and rosemary oil (Rosmarinus officinalis), sourced from the same supplier, were diluted to 1% (v/v) in methyl tert–butyl ether.
GC
The following GC conditions were used: inlet: Optic 4 single–neck split injection liner (GL Sciences), 3.4 mm i.d.; carrier gas: helium, constant–flow at 1.0 mL/min; injection volume: 1.0 μL; split: 50:1; temperature: 250 °C; column: 30 m × 0.25 mm, 0.25–μm df BPX5 (SGE Analytical Science); oven program: 40 °C (2 min), 4 °C/min to 270 °C (5 min); total run time: 64.5 min.
TOF–MS
The following TOF–MS conditions were used: instrument: BenchTOF–Select (Markes International); filament voltage: 1.7 V; ion source: 250 °C; transfer line: 250 °C; filament delay: 180 s; mass range: m/z 35–500; ionization energy: tandem ionization at 70 and 12 eV; data acquisition rate: 8 Hz.
Software
Instrument control and data processing was done using TOF–DS (Markes International). Screening was performed against the National Institute of Standards and Technology (NIST) 14 library, and identifications were made on the basis of a match factor >800.
Results and Discussion
Comparison of Oil Composition
The ginger, wintergreen, and rosemary oil samples were screened against the NIST 14 library as acquisition proceeded, and the resulting GC–TOF–MS chromatograms are shown in Figure 3. Major compounds are labeled in this figure, and identified analytes with match factors >800 are listed in Table I.
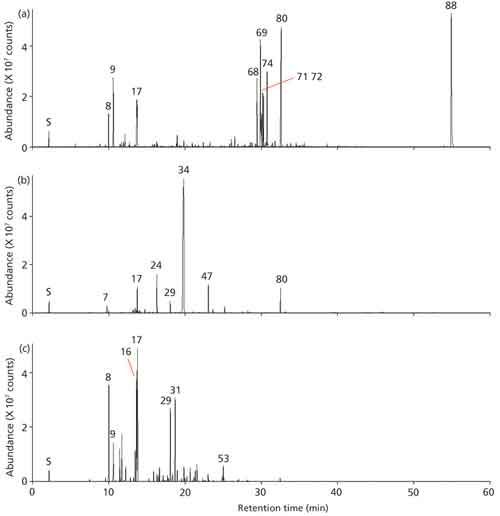
Figure 3: GC-TOF-MS analyses of (a) ginger, (b) wintergreen, and (c) rosemary essential oils. Peaks: S = Solvent (methyl tert-butyl ether) 7 = α-thujene, 8 = α-pinene, 9 = camphene, 16 = limonene, 17 = eucalyptol, 24 = linalool, 29 = camphor, 31 = isoborneol, 34 = methyl salicylate, 47 = hydroxycitronellal, 53 = α-terpinyl acetate, 68 = α-curcurmene, 69 = zingiberene, 71 = α-farnesene, 72 = β-bisabolene, 74 = β-sesquiphellandrene, 80 = diethyl phthalate, 88 = bis(2-ethylhexyl) phthalate.
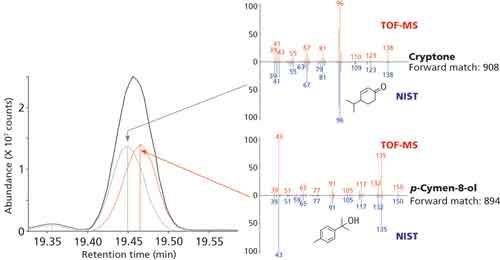
Figure 4: Deconvolution of closely eluted peaks for cryptone and p-cymen-8-ol found in the ginger essential oil, showing obtained mass spectra (top, red) compared against NIST 14 mass spectra (bottom, blue).
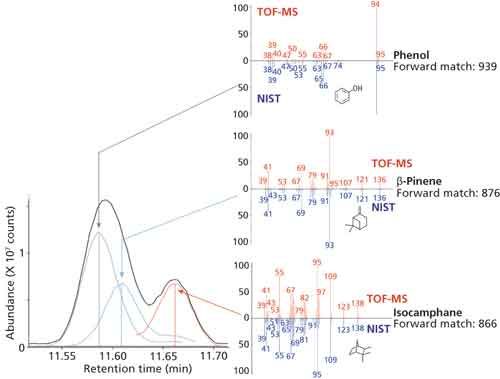
Figure 5: Deconvolution of closely eluted peaks for phenol, β-pinene, and isocamphene found in the wintergreen oil, showing obtained mass spectra (top, red) compared against NIST 14 mass spectra (bottom, blue).
Ginger Oil
In the sample of ginger essential oil, 53 compounds were identified. The highest–loading sesquiterpenes were found to be zingiberene, α–curcumene, and β–sesquiphellandrene, which give ginger its characteristic flavor (12).
Overall, the abundance of sesquiterpenes relative to monoterpenes (such as geranial, neral, α–pinene, camphene, and eucalyptol) indicate that the essential oil is likely of eastern Asian origin, as recently highlighted (13).
Geranial and neral (the 2E and 2Z isomers of 3,7–dimethyl–2,6–octadienal, respectively, also known as citral) deserve special mention because the ratio between these two isomers can aid in discrimination between different ginger cultivars. For example, in a study of 17 ginger cultivars from India, geranial/neral ratios ranged from 4.1:1 to 3.1:1 (14), whereas a study of 17 Australian cultivars and clones found ratios close to 1.6:1 (15), which results in a more lemony quality to the aroma.
Geranial and linalool are of note because they are two of 27 components to be listed in a 2003 EU Directive (5) that requires them to be labeled if present at >100 ppm in “wash–off” products (such as shower gels), or >10 ppm in “leave–on” products (such as perfumes). Allergens in essential oils have also been the focus of a recent study into the development of a database to aid in the assessment of the risk of skin sensitization (16).
The strong responses from diethyl phthalate and bis(2–ethylhexyl) phthalate in this essential oil could be a cause for concern, and may warrant further examination in a quality–control scenario, or indeed rejection of the batch. These compounds, which are ubiquitous as plasticizers, are coming under tighter control because of their hormone–disrupting properties in vivo, and are most likely a consequence of contamination from plastic components during the extraction and distillation processes. For example, both compounds have been found in the essential oil of bergamot (17).
Wintergreen Oil
Methyl salicylate has been known since the 1840s as the dominant component of the oil of wintergreen, which is usually distilled from Gaultheria procumbens, known as the wintergreen or eastern teaberry. Our analysis accords with this, finding methyl salicylate as by far the most abundant compound in the essential oil, with 39 much less dominant compounds.
This abundance of a single compound may be the reason why the composition of wintergreen essential oil is the subject of only one recent paper (18) in the scientific literature (at least in those papers published in the English language). That analysis showed methyl salicylate to contribute 96.9% by weight, with other components being (in decreasing order of abundance) limonene (2.17%), β–pinene (0.25%), α–pinene (0.22%), fenchone (0.17%), menthone (0.12%), β–myrcene (0.09%), and sabinene (0.08%).
Limonene, β–pinene, α–pinene, and β–myrcene were also found in our analysis, but none gave responses as large as α–thujene, eucalyptol, linalool, camphor, and hydroxycitronellal. A number of compounds cited in the above–mentioned EU Directive (5) were found––benzyl cinnamate, cinnamaldehyde, cinnamyl alcohol, geraniol, hydroxycitronellal, limonene, and linalool. Other aromatic compounds (in addition to the first three of the above) included phenol, vanillin, ethyl vanillin, acetophenone, and cinnamyl cinnamate.
As in the case of the ginger essential oil, diethyl phthalate is also present, although not so prominently. Another possible point of interest is the presence of methylparaben (methyl p–hydroxybenzoate), which although occurring naturally is more commonly known as a preservative.
Rosemary Oil
Rosemary oil showed the smallest number of positive identifications for the three samples analyzed, with a total of 34 compounds. However, it is noteworthy that 14 of these were not found in either ginger or wintergreen oils.
Our analysis accords with previous studies, which show that the overall profile of rosemary essential oil is heavily weighted toward monoterpenoids, with only a few percent contributed by sequiterpenoids (19). However, considerable variation between essential oils has been found depending on the Rosmarinus officinalis variety or phenotype (20,21), location, climate, or season of collection (22), and processing method (19,23).
Our analysis found eucalyptol (also known as 1,8–cineole) and α–pinene to be two of the most abundant compounds, in accordance with the observation that these are major components of rosemary essential oil. Interestingly, limonene, which is typically at low abundance, was also dominant in our sample, mirroring an observation made using rosemary of Serbian origin (24).
Other significant compounds found in our study included the monoterpenes bornyl acetate, camphene, camphor, carvone, fenchone, isoborneol, isocamphane, linalool, and β–pinene. Of the compounds listed in the 2003 EU Directive (5), limonene, linalool, and benzyl benzoate were identified, while diethyl phthalate was also found, but at much lower levels than for ginger and wintergreen essential oils.
Deconvolution of Closely Eluted Analytes
A major challenge when carrying out GC–MS analyses of extracts from biological sources is that the large number of components present can lead to multiple coelutions that compromise the ability to identify components. Chemometric peak deconvolution is a powerful approach to tackling this problem (25), and is typically based on the premise that different fragments from the same analyte have the same peak–apex retention time and the same abundance–time profile. In this study, the use of a time–of–flight mass spectrometer facilitates this deconvolution, by providing a high data–acquisition rate (10,000 transient spectral accumulations per second). The instrument also uses a 3–kV floating ion source, which minimizes differences in ion impact velocities at the detector, ensuring that the bias toward low masses (“mass discrimination”) seen in other TOF designs is avoided. This allows the EI spectra generated to be directly compared to those in commercial or in–house libraries, typically acquired on quadrupole instruments. However, because TOF instruments do not rely on scanning technology it also ensures that data is unaffected by the phenomenon of spectral skew that is a common occurrence in spectra acquired on quadrupole instruments used in scan mode (26).
The value of this approach is highlighted by the examples shown in Figures 4 and 5, where good match factors were obtained for closely eluted compounds.
Comparison of Spectra at 70 eV and 12 eV
Whether or not analytes are coeluted, speciation is a particularly acute challenge for fragrance components, which as noted earlier may contain large numbers of compounds that show close structural relationships, and thus similar mass spectra (27). The identification of mono– and sesquiterpene hydrocarbons by GC–MS is a case in point, because of the lack of characteristic fragmentation patterns for these compounds and because of their propensity to undergo isomerization and molecular rearrangements (28–30).
To address this concern, the essential oils were analyzed using the system for tandem acquisition of spectra described earlier, which allow simultaneous generation of 70 eV spectra and soft EI spectra. Soft EI (12 eV in this case) increases intensity for the molecular ion and reduces fragmentation, resulting in simplified spectra with an enhanced molecular ion. However, unlike other soft ionization approaches, ions with larger m/z values still remain in the spectrum, meaning that these diagnostic fragments are available to enable discrimination between similar species (11). Two examples of this are shown in Figure 6.
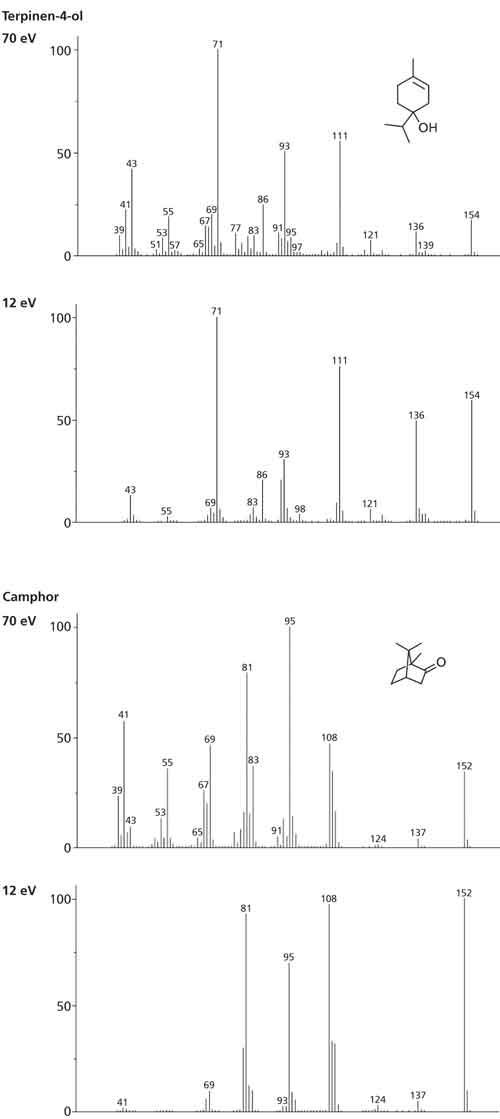
Figure 6: Spectral comparisons at 70 eV and 12 eV for terpinen-4-ol (MW 154) and camphor (MW 152), showing enhanced molecular (and structurally significant) ions and reduced fragmentation using soft EI.
Use of Ion Ratios to Facilitate Spectral Comparison
By simultaneously generating spectra at two ionization energies, the tandem acquisition process described above provides independent ion ratio checks at both 70 eV and a low ionization voltage. Figure 7 illustrates the potential of this process for two fragrance–relevant isomeric monoterpenes. The 70–eV spectra are extremely similar, while the 12–eV spectra show differences in the relative abundance of m/z 80, 93, and 136, aiding the isomer assignment. The accompanying table of ion ratios quantifies these visual differences, allowing soft EI to be used to confirm the identity of analytes when their identity as assessed by retention times (or indices) or 70–eV mass spectra leave room for doubt.
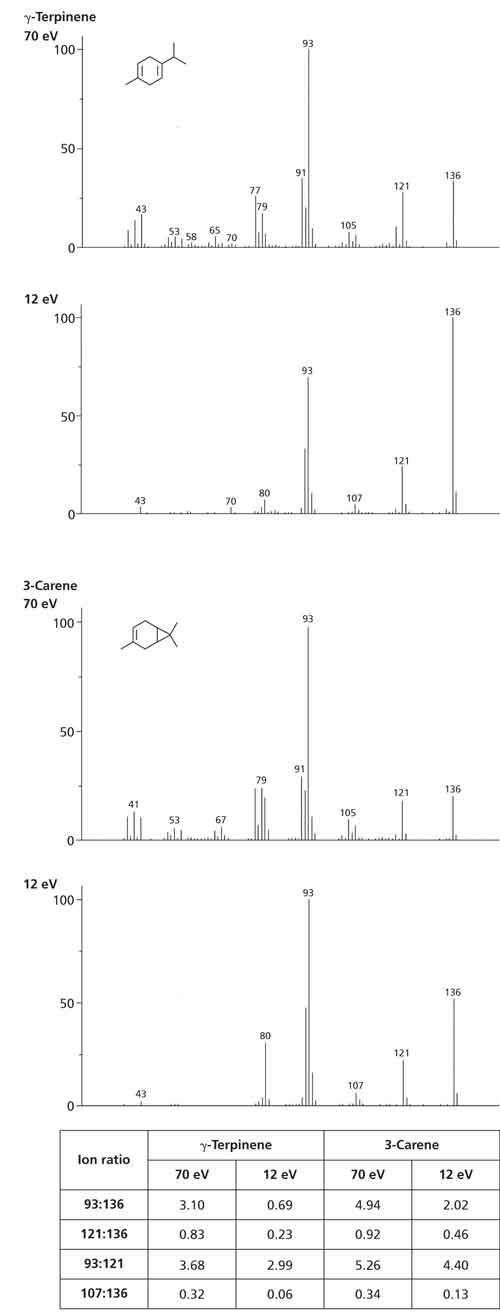
Figure 7: Spectral comparisons at 70 eV and 12 eV for two monoterpene isomers γ-terpinene and 3-carene, showing the similarity at 70 eV and differences in ion abundance at 12 eV, assessed by means of ion ratios.
Conclusions
Essential oils present a challenging sample type for the GC analyst because the large numbers of structurally similar analytes result in a high likelihood of coelution, and in lowered confidence in mass–spectral identification of monoterpenoids and sesquiterpenoids.
This article has shown that GC–TOF–MS can be a useful approach to generate comprehensive fragrance profiles of such essential oils, by providing the level of detail necessary for comparisons against previous studies. We have also shown the application of peak deconvolution to discriminate between closely eluted compounds, and have explored the use of soft EI, assisted by comparison of ion ratios, to discriminate between isomeric monoterpenes with very similar mass spectra at conventional 70–eV ionization energies.
Together, these capabilities enable robust comparison between samples of essential oils, and consequently make the GC–TOF–MS approach valuable for quality control and regulatory compliance in the fragrance and aroma industries.
References
- Handbook of Essential Oils: Science, Technology and Applications, 2nd Edition, K.H.C. Baser and G. Buchbauer, Eds. (CRC Press, Boca Raton, Florida, 2015).
- W. Schwab, R. Davidovich, and E. Lewinsoh, Plant J.54, 712–732 (2008).
- B. d’Acampora Zellner, P. Dugo, G. Dugo, and L. Mondello, in Handbook of Essential Oils: Science, Technology and Applications, 2nd Edition, K.H.C. Baser and G. Buchbauer, Eds. (CRC Press, Boca Raton, Florida, 2015) pp. 195–225.
- Standards for a large number of essential oils are available from ISO/TC 54, www.iso.org/iso/iso_catalogue/catalogue_tc/catalogue_tc_browse.htm?commid=48956.
- Directive 2003/15/EC of the European Parliament and of the Council of 27 February 2003 amending Council Directive 76/768/EEC on the approximation of the laws of the Member States relating to cosmetic products. http://eur–lex.europa.eu/legal–content/EN/TXT/?uri=celex%3A32003L0015.
- K.E. Boren, J. Environ.Anal. Chem. 2, 132 (2015).
- J.–M.D. Dimandja, S.B. Stanfill, J. Grainger, and D.G. Patterson, J. High Resolut. Chromatogr. 23, 208–214 (2000).
- A. Smelcerovic, A. Djordjevic, J. Lazarevic, and G. Stojanovic, Curr. Anal. Chem.9, 61–70 (2013).
- L. McGregor and D. Barden, Hydrocarbon Eng. July 2014, http://www.energyglobal.com/downstream/gas–processing/31072014/Crude–oil–markes–analysis/.
- M.S. Alam, C. Stark, and R.M. Harrison, Anal. Chem.88, 4211–4220 (2016).
- L. McGregor, A. Gravell, I. Allan, G. Mills, D. Barden, N. Bukowski, and S. Smith, The Analytical Scientist, April 2015.
- A.A. Bednarczyk, Chem. Senses Flavour1, 377–386 (1975).
- M. Höferl, I. Stoilova, J. Wanner, E. Schmidt, L. Jirovetz, D. Trifonova, V. Stanchev, and A. Krastanov, Nat. Prod. Commun.10, 1085–1090 (2015).
- C.R. Kiran, A.K. Chakka, K.P.P. Amma, A.N. Menon, M.M.S. Kumar, and V.V. Venugopalan, J. Essent. Oil Res.25, 380–387 (2013).
- H. Wohlmuth, M.K. Smith, L.O. Brooks, S.P. Myers, and D.N. Leach, J. Agric. Food Chem.54, 1414–1419 (2006).
- N. Dornic, A.S. Ficheux, and A.C. Roudot, Regul. Toxicol. Pharmacol.80, 226–232 (2016).
- G. Di Bella, M. Saitta, L. La Pera, M. Alfa, and G. Dugo, Chemosphere56, 777–782 (2004).
- M. NikoliÄ, T. MarkoviÄ, M. MojoviÄ, B. Pejin, A. SaviÄ,T. PeriÄ, D. MarkoviÄ, T. SteviÄ, and M. SokoviÄ, Ind. Crops Prod.49, 561–567 (2013).
- A. Szumny, A. Figiel, A. Gutierrez–Ortiz, and A.A. Carbonell–Barrachina, J. Food Eng. 97, 253–260 (2010).
- Y. Zaouali, T. Bouzaine, and M. Boussaid, Food Chem. Toxicol.48, 3144–3152 (2010).
- A.M. Ojeda–Sana, C.M. van Baren, M.A. Elechosa, M.A. Juárez, and S. Moreno, Food Control31, 189–195 (2013).
- O.Y. Celiktas, E.E.H. Kocabas, E. Bedir, F.V. Sukan, T. Ozek, and K.H.C. Baser, Food Chem.100, 553–559 (2007).
- C. Boutekedjiret, F. Bentahar, R. Belabbes, and J.M. Bessiere, Flavour Fragrance J.18, 481–484 (2003).
- B. Bozin, N. Mimica–dukic, I. Samojlik, and E. Jovin, J. Agric. Food Chem.55, 7879–7885 (2007).
- S.E. Stein, J. Am. Soc. Mass Spectrom. 10, 770–781 (1999).
- J.T. Watson and D.O. Sparkman, Introduction to Mass Spectrometry, 4th Edition (John Wiley & Sons, Hoboken, New Jersey, 2007), p. 113.
- R.P. Adams, Identification of Essential Oil Components by Gas Chromatography/Mass Spectrometry, 4th Edition (Allured Publishing, 2007).
- R.I. Reed, in Mass Spectrometry of Organic Ions, F.W. McLafferty, Ed. (Academic Press, 1963), chapter 13, pp. 637–699.
- H. Budzikiewicz, C. Djerassi, and D. H. Williams, Mass Spectrometry of Organic Compounds (Holden–Day, 1968).
- A.I. Yermakov, A.L. Khlaifat, H. Qutob, R.A. Abramovich, and Y.Y. Khomyakov, Chem. Sci. J.1, CSJ–7 (2010).
David Barden, Laura McGregor, and Steve Smith are with Markes International, in Wales, UK. Direct correspondence to: enquiries@markes.com
Mass Spectrometry for Forensic Analysis: An Interview with Glen Jackson
November 27th 2024As part of “The Future of Forensic Analysis” content series, Spectroscopy sat down with Glen P. Jackson of West Virginia University to talk about the historical development of mass spectrometry in forensic analysis.
Revealing the Ancient Secrets of Chinese Swamp Cypress Using Cutting-Edge Pyrolysis Technology
November 18th 2024A study published in the Journal of Analytical and Applied Pyrolysis by Yuanwen Kuang and colleagues used advanced pyrolysis techniques to reveal the preservation and chemical transformations of 2,000-year-old Chinese swamp cypress wood, offering valuable insights for archaeological conservation and environmental reconstructions.
Detecting Cancer Biomarkers in Canines: An Interview with Landulfo Silveira Jr.
November 5th 2024Spectroscopy sat down with Landulfo Silveira Jr. of Universidade Anhembi Morumbi-UAM and Center for Innovation, Technology and Education-CITÉ (São Paulo, Brazil) to talk about his team’s latest research using Raman spectroscopy to detect biomarkers of cancer in canine sera.