Confocal Raman Imaging in Pharmaceutical Research
The development, production, and quality assurance in the pharmaceutical industry requires efficient and reliable control mechanisms to ensure the safety and the therapeutic effect of the final products. These products can vary widely in composition and application. Also, several properties are difficult to study with conventional characterization techniques due to the inability of these methods to chemically differentiate materials with sufficient spatial resolution, without damage or staining. Therefore, analyzing methods that provide both comprehensive chemical characterization and the flexibility to adjust the method to the investigated specimen are preferred in pharmaceutical research.
Confocal Raman Microscopy (CRM) is a well-established and widely-used spectroscopic method for the investigation of the chemical composition of a sample. In pharmaceutics, CRM can be used to probe the distribution of components within formulations, to characterize homogeneity of pharmaceutical samples, to determine the state of drug substances and excipients, and to characterize contaminants and foreign particulates. The information obtained by CRM is also useful for drug substance design, for the development of solid and liquid formulations, as a tool for process analytics, and for patent infringement and counterfeit analysis.
High-Resolution, Large-Area Confocal Raman Imaging, Volume Scans, and 3D Visualizations
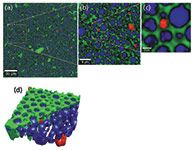
In the example, a pharmaceutical emulsion was investigated. The active pharmaceutical ingredient (API) is dissolved in water. In Figure 1a, a large-area, high-resolution Raman image of the emulsion is shown. The image scan range is 180 × 180 µm2with 2048 × 2048 pixels. At each image pixel, a complete Raman spectrum was acquired, therefore the large image is the result of an evaluation of 4,194,304 Raman spectra. The integration time per spectrum was 2 ms. The consecutive zoom-in images (Figures 1b and 1c) of the same dataset illustrate the extremely high-resolution of the large-area scan shown in Figure 1a. In the color-coded images the water and API containing phase is presented in blue, whereas with green the oil-matrix is displayed. In addition to the distribution of the known materials, silicone-based impurities could be visualized (red in the images).
Volume scans are a valuable tool in providing information about the dimensions of objects or the distribution of a certain compound throughout the sample. The generation of volume scans and 3D images always requires large data sizes. In order to generate 3D images, confocal 2D Raman images of parallel focal planes are acquired by scanning throughout the sample in the z-direction. The 2D images are then combined into a 3D image stack.
To investigate the volume of the impurities of the emulsion from Figure 1a in more detail, a 3D scan was performed. For that a volume of 25 × 25 × 20 µm3 was analyzed with 200 × 200 × 50 pixels. At each image pixel a complete Raman spectrum with 10 ms integration time per spectrum was generated. The image stack contains the information of a total of 2 million Raman spectra (Figure 1d).

Conclusion
In pharmaceutical development it is of great importance to acquire information on drug composition of chemical components. With confocal Raman imaging the distribution of the chemical components in diverse drug systems can be clearly visualized. Thus the method contributes to a detailed chemical description of various pharmaceutical drug systems and effectively supports pharmaceutical development.

WITec GmbH
Lise-Meitner-Straße 6, 89081, Ulm, Germany
tel. +49 (0) 731 149 700, fax +49 (0) 731 149 70 200
Website: www.witec.de
