The Correlation Method for the Determination of Spectroscopically Active Vibrational Modes in Crystals
Spectroscopy
The application of vibrational selection rules is usually taught with respect to the vibrational motions of individual molecules. However, many of the materials studied by infrared or Raman spectroscopy are solids and even single crystals. Furthermore, some materials such as covalent or ionic solids have no molecular species associated with them. Consequently, there is a need to understand the application of group theory for the determination of spectroscopically active vibrational modes of crystals. The correlation method is ideal for that purpose.
Page 17–22
The application of vibrational selection rules is usually taught with respect to the vibrational motions of individual molecules. However, many of the materials studied by infrared or Raman spectroscopy are solids and even single crystals. Furthermore, some materials such as covalent or ionic solids have no molecular species associated with them. Consequently, there is a need to understand the application of group theory for the determination of spectroscopically active vibrational modes of crystals. The correlation method is ideal for that purpose.
The determination of spectroscopically active vibrational modes (Raman or infrared [IR]) is generally taught through the use of individual molecules in conjunction with group theory (1). Most spectroscopists have been taught at some time about the identification of point groups for a molecule and the use of character tables in conjunction with selection rules for the determination of Raman and IR active vibrational modes of molecules. That works fine when dealing with gases or liquids. However, very often we deal with solid-state materials for which there may be no molecular species-for example, TiO2, Si, C (graphene or diamond), or CaCO3. How then should we go about determining the Raman- or IR-active vibrational modes of such materials? This is where factor group analysis comes into play. If instead of a molecule, we consider a unit cell and the atoms located at specific sites therein, the factor group consists of those symmetry elements and corresponding symmetry operations that when applied to the unit cell leave it indistinguishable from its original position. I think you can see how the factor groups of the 32 crystal classes correspond to the isomorphic point groups. Consequently, the same character tables of point groups used to determine the vibrational modes of molecules are also used to determine the Raman- and IR-active lattice vibrational modes of crystals (2,3).
The procedures for determining the Raman- and IR-active modes of crystals were first published many decades ago (4–7). Subsequently, several helpful books were published on these methods teaching spectroscopists to apply selection rules and factor group analysis to determine the Raman- and IR-active vibrational modes of crystals whose space groups were known along with the number of formula units per unit cell (8–10). I highly recommend the books by Ferraro and Ziomek (9) and Fateley and colleagues (10). The Fateley book works through many examples through which the authors teach the correlation method established by Halford and Hornig. I have used one example and the style of teaching the correlation method from the Fateley book for this installment.
Space-Group Identification and Crystallographic Information
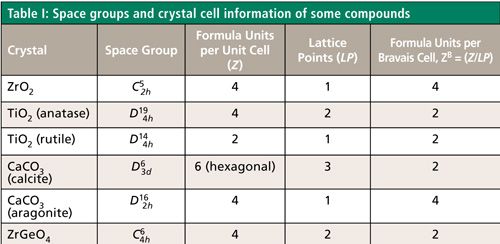
The first step in determining the spectroscopically active vibrational modes of a crystal is to identify the Bravais space cell. Many publications and crystallographic tables will list the number of molecules or formula units per crystallographic unit cell (Z). However, the correlation method requires knowledge of the number of molecules or formula units in the primitive or Bravais cell (ZB), which is equal to Z divided by the number of lattice points (LP) determined by the designation of the space group (11). Examples of crystals with different numbers of lattice points are shown in Table I.
We will use TiO2 in the anatase crystal form as our first example for determining the vibrational modes. This crystal form belongs to space group
D194h(I41/amd) with four formula units and two lattice points per crystallographic unit cell. Therefore, there are two formula units per Bravais cell (ZB = 2). Having identified the space group of a crystalline compound, the next step is to identify the site symmetry of equivalent atoms in the Bravais cell. The site symmetry for equivalent atoms is a subgroup of the factor group describing the Bravais cell. The site symmetries for all of the space groups have been identified and tabulated (12), and that for D194h is shown in Table II.
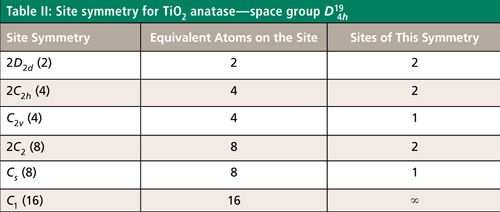
We know from Table I that anatase TiO2 has two formula units per Bravais cell (ZB = 2), two Ti atoms, and four O atoms in the Bravais cell. From Table II, we see that the only site that accommodates two equivalent atoms is D2d, which then must be the site symmetry of the two Ti atoms. Regarding the O atoms, the C2h and C2v sites both accommodate four equivalent atoms, and we must therefore choose between these two site symmetries. To choose correctly between our two options we must consult crystallographic tables to identify the proper Wyckoff site and consequently the site symmetry of the O atoms. We don’t have the space here to explain the procedure for using the tables listing Wyckoff sites, so we simply state that the site position of the O atom in anatase TiO2 corresponds to the site symmetry C2v. Those readers interested in the procedure of using the crystallographic tables to identify Wyckoff sites should consult chapter 2 of the book by Fateley and colleagues (9).
The Correlation Method-Site Symmetry to Factor Group
To make the correlation from site species to factor group species and the determination of the lattice vibrational modes, we need to understand the relationship between the translational and rotational degrees of freedom and site and factor group symmetry species. The number of translations in the site species γ is defined as tγ and the number of rotations for the site species is Rγ. The degrees of freedom can take on the values of 0, 1, 2, and 3 depending upon the degeneracy and symmetry species; the values are taken directly from the x, y, and z column of the character table. The degrees of vibrational freedom for a given site species γ is given by the symbol fγ and is related to the number of translations in that same species by the following equation:
fγ = tγ â n [1]
where n is the number of equivalent atoms in the formula unit. Likewise, the degrees of rotational freedom fγR is given by
fγR = Rγ â n [2]
The contribution of degrees of freedom by each site species γ to a factor group species ζ is given by the symbol aγ, and its relationship to the vibrational degrees of freedom is given by the following expression:
fγ = aγΣCζ [3]
where Cζ is the degeneracy of the factor group species ζ. The values of Cζ are equal to the degeneracies of the symmetry species; that is, 1 for the A and B species, 2 for the doubly degenerate E species, and 3 for the triply degenerate T species.
Spectroscopists often learn group theory for the purpose of determining the spectroscopically active vibrational modes of a molecule. Similarly, our goal here is to determine the irreducible representation of the symmetry species of crystal lattice vibrations. To do that, we need to correlate the site symmetry species of the equivalent sets of atoms to the factor group of the crystal. The irreducible representation of an equivalent set of atoms is given by
Γeqiv atoms =Σaζ â ζ [4]
where aζ equals the number of lattice vibrations of species ζ of the crystal factor group. Summing all of the irreducible representations of the equivalent atoms yields the total irreducible representation of the crystal.
Γcrystal = Γequiv atoms 1 + Γequiv atoms 2 + … [5]
The irreducible representation of the crystal contains within it the so-called optical and acoustical vibrations or phonons. Therefore, we will have to subtract the irreducible representation of the acoustical phonons from the irreducible representation of the crystal to achieve our final goal of determining the irreducible representation of the optical lattice vibrations:
Γvib = Γcrystal - Γacoustic [6]
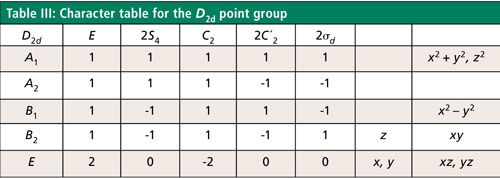
To determine Γcrystal we need to correlate the site symmetries of the equivalent atoms in the lattice to the factor group of the crystal. We have identified in the previous section the site symmetries of the Ti and O atoms in the TiO2 anatase crystal. Next, we will treat the displacements of each atom on those sites, correlate the site species to the species of the factor group, and identify the lattice vibrations of the crystal. The procedure for determining the lattice vibrations is to work with one element in the chemical formula at a time. The site symmetry of the Ti atoms is D2d and so we turn to the D2d character table shown in Table III to identify those symmetry species associated with displacements along x, y, and z axes. The D2d site species that involve vibrations along the x, y, and z directions are B2 and E. Our next step is to correlate the site species to the factor group species from which we can determine the symmetry species of spectroscopically active vibrational modes.
Factor Group Analysis of Anatase TiO2
We begin our factor group analysis by considering the Ti atoms on site D2d. We know from Table II that there are two equivalent Ti atoms (n = 2) on site D2d and from Table III that the symmetry species of translation are B2 and E. Thus, the vibrational degrees of freedom of the two equivalent Ti atoms are 2 for B2 and 4 for E. For clarity, these results and their relationship are summarized in Table IV. Next, we want to correlate the site group species of the atom to the corresponding factor group species of the crystal, which is D4h for anatase TiO2 as indicated in Table I. To do this it is necessary to consult published correlation tables that can be found in several of the references cited here (9,10,13). A complete correlation of the D2d site group species to the D4h factor group species is shown in Figure 1. However, we see from Table IV that the only the B2 and E site species have nonzero vibrational degrees of freedom. Therefore, we need only consider the correlation of those two site group species to the factor group species when determining the vibrations of the Ti atoms in the anatase TiO2 crystal.
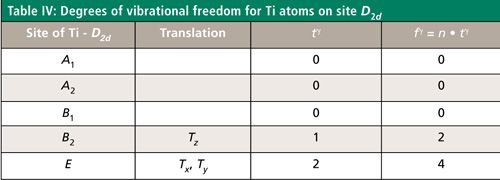
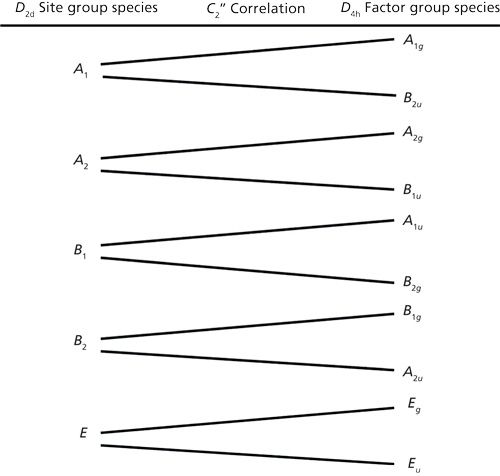
Figure 1: Correlation of the D2d site group species to the D4h factor group species.
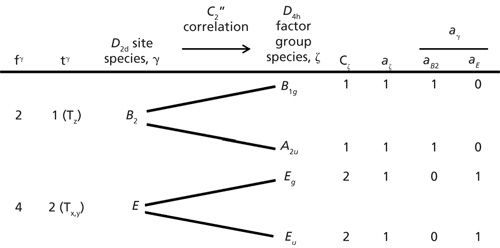
Figure 2: Correlation of the site group species D2d to the D4h factor group species for the determination of the vibrational modes involving the Ti atoms in the anatase TiO2 crystal lattice.
Figure 2 shows the correlation of the site group species D2d to the D4h factor group species for the determination of the vibrational modes involving the Ti atoms in the anatase TiO2 crystal lattice. Examine carefully the values shown in the last three columns of this figure and you will see that aζ is equal to the sum of the number of the site species contributing to the number of factor group species:
aζ = Σγaγ [7]
We have several ways of checking the accuracy of Figure 2 and confirming our work. The total degrees of freedom of our equivalent set of two Ti atoms is 3n = 6. The sum of the degrees of vibrational freedom (column 1, fγ) equals 6. Also, the sum of the number of factor group species times the degeneracy of the species (ΣζaζCζ) equals 6; that is the sum of the products in columns aζ and Cζ equals 6. So our check of the degrees of vibrational freedom of the Ti atoms confirms our work and correctness of the values in Figure 2.
Next, we generate the irreducible representation of the symmetry species associated with the vibrations of the Ti atoms. Note that in Figure 2 the aζ value for each D4hfactor group species is 1. Therefore, our D4h factor group contribution from the Ti atoms to the anatase TiO2 crystal is
ΓTi = B1g + A2u + Eg + Eu [8]
Now that we have determined the factor group species associated with the vibration of Ti atoms, we must complete our work by performing the same procedure for the O atoms. Referring back to Table II and the discussion regarding the selection of site symmetries, we see that the site group symmetry of the O atoms in anatase TiO2 is C2v. Therefore, our correlation table should relate the site group species C2v to the D4h factor group species for the determination of the vibrational modes involving the O atoms in the anatase TiO2 crystal lattice. The procedure for the correlation of the O atom site group species to the factor group species is the same as that for the Ti atoms and we show the results in Figure 3. Note that for the O atoms not all of the aζ values are nonzero and that for the doubly degenerate E species the value is 2. The aζ values provide the corresponding coefficients for the individual factor group species forming the irreducible representation of the O atoms.
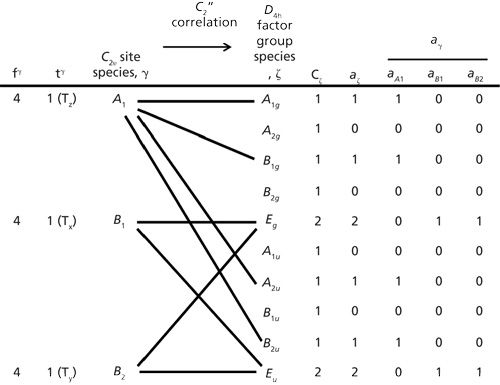
Figure 3: Correlation of the site group species C2v to the D4h factor group species for the determination of the vibrational modes involving the O atoms in the anatase TiO2 crystal lattice.
We should check our work as we did previously for the Ti atoms. The total degrees of freedom of our equivalent set of four O atoms is 3n = 12. The sum of the degrees of vibrational freedom (column 1, fγ) equals 12. Also, the sum of the number of factor group species times the degeneracy of the species (ΣζaζCζ) equals 12; that is the sum of the products in columns aζ and Cζ equals 12. So our check of the degrees of vibrational freedom of the O atoms confirms our work and the correctness of the values in Figure 3.
Next, we generate the irreducible representation of the symmetry species associated with the vibrations of the O atoms. Note that in Figure 3 not all of the aζ values corresponding to the individual D4h factor group species are nonzero. Therefore, our D4h factor group contribution from the O atoms to the anatase TiO2 crystal is constructed from only those species with nonzero values in Figure 3.
ΓO = A1g+ B1g + 2Eg + A2u + B2u + 2Eu [9]
Recall from equation 5 that the sum of all of the irreducible representations of the equivalent atoms yields the total irreducible representation of the crystal.
ΓTiO2(anatase) = ΓTi + ΓO = A1g + 2A2u + 2B1g + B2u + 3Eg + 3Eu [10]
However, we are not quite done yet. The irreducible representation of the TiO2 anatase crystal contains within it the so-called optical and acoustical vibrations or phonons. Therefore, we still have to subtract the irreducible representation of the acoustical phonons from equation 10 to achieve our final goal of determining the irreducible representation of the optical lattice vibrations. The acoustical modes have the same character as the translations in the factor group’s character table; here D4h. Consulting the D4h character table shown in Table V we find that the X and Y translations correspond to the Eu species and the Z translation corresponds to the A2u species.
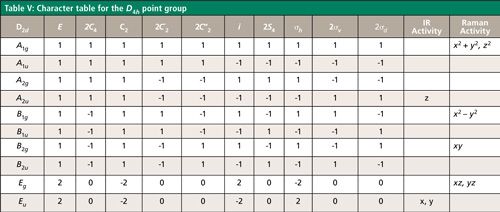
Therefore,
Γacoust = A2u + Eu [11]
Subtraction of the acoustical phonons from ΓTiO2(anatase) will, according to equation 6, will give us the irreducible representation of the optical lattice vibrations of anatase TiO2.
Γvib = A1g + 2A2u + 2B1g + B2u + 3Eg + 3Eu - (A2u + Eu ) = A1g + A2u + 2B1g + B2u + 3Eg + 2Eu [12]
and
Γvib = A1g (Raman) + A2u (IR) + 2B1g (Raman) + B2u (inactive) + 3Eg (Raman) + 2Eu (IR) [13]
Therefore, a Raman spectrum of anatase TiO2 should consist of one A1g, two B1g, and three Eg bands, whereas the IR absorption spectrum should consist of one A2u and two Eu bands. The B2u vibrational mode is silent.
It is important to realize that the exercise that we have completed has provided us with the irreducible representation of the vibrational modes of only the anatase form of TiO2; that is, the representation does not apply to the other crystalline forms such as rutile or brookite. For example, here is the irreducible representation of the vibrational modes of rutile TiO2.
ΓTiO2 rutile = A1g (Raman) + A2g (inactive) + A2u (IR) + B1g (Raman) + B1u (inactive) + B2g (Raman) + Eg (Raman) + 3 Eu (IR) [14]
A comparison of the anatase and rutile irreducible representations in Table VI reveals that the Raman and IR spectra should allow us to differentiate them by the number of bands and their symmetries.

The work that we have just done has hopefully demonstrated to you the importance and distinction between the determination of spectroscopically active vibrational modes of crystalline solids and the more familiar treatment of isolated molecules. The spectroscopist must appreciate the dependence of IR absorption and Raman scattering on the material’s crystal structure. Furthermore, a working knowledge of the selection rules and the correlation method allows the vibrational spectroscopist to use IR absorption and Raman spectroscopy to differentiate crystal forms in a fashion complementary to X-ray diffraction.
Conclusions
The correlation method for the determination of spectroscopically active vibrational modes in crystals has been presented. The correlation of the site symmetry of equivalent atoms in the chemical formula to the factor group of the crystal allows one to build the irreducible representation of the vibrational modes of the crystal one element at a time. The method has within itself checks on the correctness of the determinations based upon the degrees of freedom of the equivalent atoms and the vibrational degrees of freedom. The spectroscopist can use vibrational spectroscopy in conjunction with the correlation method to differentiate different crystalline forms of the same chemical compound.
References
- D. Tuschel, Spectroscopy29, 14–23 (2014).
- J.R. Ferraro, Appl. Spec.29, 418–421 (1975).
- D.L. Roussequ, R.P. Bauman, and S.P.S. Porto, J. Raman Spec. 253–290 (1981).

A Proposal for the Origin of the Near-Ubiquitous Fluorescence in Raman Spectra
February 14th 2025In this column, I describe what I believe may be the origin of this fluorescence emission and support my conjecture with some measurements of polycyclic aromatic hydrocarbons (PAHs). Understanding the origin of these interfering backgrounds may enable you to design experiments with less interference, avoid the laser illuminations that make things worse, or both.
Raman Microscopy for Characterizing Defects in SiC
January 2nd 2025Because there is a different Raman signature for each of the polymorphs as well as the contaminants, Raman microscopy is an ideal tool for analyzing the structure of these materials as well as identifying possible contaminants that would also interfere with performance.