Determination of Low Concentration Methanol in Alcohol by an Affordable High Sensitivity Raman Instrument
Low concentration natural methanol exists in most alcoholic beverages and usually causes no immediate health threat. Nevertheless, it is possible to have natural occurring methanol in beverages with concentration as high as 18 g/L of ethanol; or equivalent to 0.72% methanol in 40% ethanol, in alcohol (1). Current EU regulation limits naturally occurring methanol to below 10 g/L of ethanol; or equivalent to 0.4% methanol in 40% ethanol.
Duyen Nguyen and Eric Wu, Enwave Optronics, Inc.
Low concentration natural methanol exists in most alcoholic beverages and usually causes no immediate health threat. Nevertheless, it is possible to have natural occurring methanol in beverages with concentration as high as 18 g/L of ethanol; or equivalent to 0.72% methanol in 40% ethanol, in alcohol (1). Current EU regulation limits naturally occurring methanol to below 10 g/L of ethanol; or equivalent to 0.4% methanol in 40% ethanol.
Raman spectroscopy has been shown to be an effective tool in compositions analysis as well as adulteration identifications in foods (2). In the alcoholic beverage industry, the standard composition analysis method were more expensive and time-consuming gas chromatography (3). Here, we present a Raman spectroscopy method for a quick and lower cost alternative to verify the existence of low concentration methanol in alcohol.
Experiment
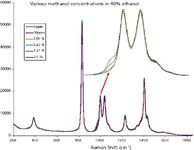
40% ethanol/water solution was prepared using 200-proof ethanol and distilled water. HPLC grade methanol was added into the 40% ethanol solution to make samples with methanol concentration ranging from 50 ppm to 2.5%. An Enwave Optronics' ProRaman instrument with laser excitation at 785 nm was used for the measurements. The sample solutions were measured in quartz cuvette in a sample holder. Figure 1 depicts the results of the measured spectra in the fingerprint region of the Raman spectra.

Figure 1: The fingerprint range spectra of the various solutions.
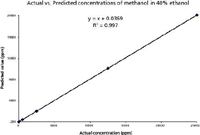
Partial least square (PLS) regression method was used for calibration and prediction model for methanol. The spectral region from 950–1200 cm-1 was chosen for developing the calibration model. The actual vs. predicted concentration value of methanol is shown in Figure 2. It is shown that the measured data and PLS prediction match very well with correlation coefficient R2 @ 0.997.

Figure 2: Actual and predicted methanol concentrations using PLS regression model.
Conclusion
An affordable, high sensitivity ProRaman instrument was used with PLS method to successfully analyze low concentration methanol in 40% alcohol. Based on our findings, the detection limit for methanol in 40% of ethanol is much better than 50 ppm and reliable quantitative determination using PLS prediction could reach 50 ppm of methanol in 40% alcohol.
References
(1) F. Bindler, E. Voges, and P. Laugel, Food Addit. Contam. 5, 343–351 (1988).
(2) W.M. Mackenzie and R.I. Aylott, The Analyst 129, 607–612 (2004).
(3) L.M. Reid, C.P. O'Donnell, and G. Downey, Trends in Food Science & Technology 17, 344–353 (2006).
Enwave Optronics, Inc.
18200 McDurmott St., Suite B, Irvine, CA 92614
tel. (949) 955-0258; Fax: (949) 955-0259
Website: www.enwaveopt.com

A Seamless Trace Elemental Analysis Prescription for Quality Pharmaceuticals
March 31st 2025Quality assurance and quality control (QA/QC) are essential in pharmaceutical manufacturing to ensure compliance with standards like United States Pharmacopoeia <232> and ICH Q3D, as well as FDA regulations. Reliable and user-friendly testing solutions help QA/QC labs deliver precise trace elemental analyses while meeting throughput demands and data security requirements.