Epitope Mapping of an Interleukin Receptor for Three Therapeutic Antibodies by Hydrogen-Deuterium Exchange Mass Spectrometry
Special Issues
Among all the analytical techniques available for epitope mapping studies, hydrogen–deuterium exchange mass spectrometry (HDX-MS) is usually the fastest and easiest to carry out. We present here the epitope mapping of three distinct monoclonal antibody (mAb) candidates targeting the same antigen, an interleukin receptor. The goal is to establish the binding mode of these mAbs, and explain possible differences observed for in vitro binding and in vivo function.
The study of protein-protein interactions is critical in the development of biotherapeutics, to develop new candidates, to understand modes of actions, and to protect intellectual property. Among all the analytical techniques available for epitope mapping studies, hydrogen–deuterium exchange mass spectrometry (HDX-MS) is usually faster and easier to carry out. We present here the epitope mapping of three distinct monoclonal antibody (mAb) candidates targeting the same antigen, an interleukin receptor. The goal is to establish the binding mode of these mAbs, and explain possible differences observed for in vitro binding and in vivo function.
Monoclonal antibodies (mAbs) constitute a major and fast-growing biotherapeutic class, thanks notably to their outstanding selectivity for specific targets. Their physicochemical characterization is complex, because of their size (around 150 kDa), numerous variants caused by post-translational modifications, and their tendency to aggregate (1). Furthermore, there is a need for better understanding of how these aspects may alter the structure and function of mAbs, as observed in vivo or in vitro by techniques such as enzyme-linked immunosorbent assay (ELISA) or surface plasmon resonance (SPR). This need prompts the study of the precise nature of the interaction between mAbs and their antigens at the molecular level. Epitope mapping consists of the determination of the binding site of the antigen (coined epitope), and provides several very useful applications:
- A way to screen mAb candidates and assist in the development of new candidates (2)
- A better understanding of the mechanisms of action (3–5)
- An additional layer of intellectual property protection (6).
A number of methods can be used to map interactions between proteins. X-ray crystallography is probably the gold standard for such endeavors (7,8), but it suffers from several drawbacks. Most notably, it is a lengthy process that relies on the amenability of the proteins to crystallize, and "only" yields a snapshot of one energetically accessible conformation. In that regard, solution-based techniques are best suited to study dynamic systems because they take into account all attainable conformations. Nuclear magnetic resonance (NMR) experiments provide similar resolution but are often too difficult to carry out in this context (9). Other methods such as circular dichroism or mutagenesis usually lack in resolution or do not provide direct evidence, respectively.
The hydrogen–deuterium exchange mass spectrometry (HDX-MS) approach is much faster and easier to carry out than the aforementioned methods. Although it does not provide atomic resolution, the approach allows the determination of epitopes at the scale of a few amino acids (regardless of the complexity of the sample), requires smaller sample amounts, tolerates impurities and formulants (such as salts and buffers), and operates in solution in near-physiological conditions. Furthermore, it provides insight into the structure and interaction dynamics on a large time scale (from a few seconds to several hours).
We describe below the epitope mapping of three distinct mAb candidates targeting the same antigen, an interleukin receptor. The goal is to establish the binding mode of these mAbs, and explain possible differences observed for in vitro binding and in vivo function.
Experimental
Principles of the Method
The analytical workflow for HDX-MS is summarized in Figure 1. Proteins in solution are diluted in an excess of deuterium oxide (D2O) so that hydrogen atoms are exchanged for deuterium atoms on the amide nitrogen of the peptide bond (10,11). Side-chain H atoms also exchange, but at too fast a rate, and are consequently entirely back-exchanged during the liquid chromatography–MS (LC–MS) analysis (that is, hydrogen atoms replace deuterium atoms). After quenching the deuteration by lowering both the temperature and the pH, the protein is digested online by a protease. The resulting peptides are quickly desalted and separated at low temperature. Finally, MS measures the uptake of deuterium using the difference in peptide mass resulting from the mass difference between exchanged deuterium (2.0141 Da) and hydrogen (1.0078 Da). This exchange of D for H occurs at rates varying by a factor of as much as 108 depending on hydrogen bonding and solvent accessibility (Figure 2) (12). Schematically, hydrogen atoms from accessible regions and hydrogen atoms not involved in H-bonds exchange faster. By measuring hydrogen–deuterium exchange rates, changes in protein structure and dynamics are determined. Note that the exchange rate is also influenced by experimental parameters such as the temperature and pH (13).
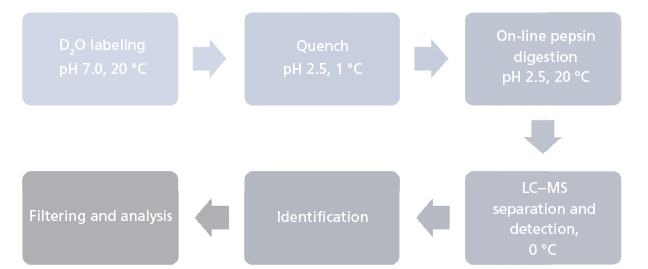
Figure 1: Analytical workflow of hydrogen-deuterium exchange mass spectrometry.
Concretely, binding a mAb on the antigen buries the amino acids from the binding sites, hence screening them from the bulk medium and ultimately slowing down the H-to-D exchange. In the approach described in this article, the proteins are digested online with a pepsin column, which generates a large number of partially overlapped peptides and allows the analysis of exchange data at the scale of a few amino acids. The epitope mapping can therefore be conducted by a straightforward comparison of the exchange data of the antigen unbound and bound to the mAb for each peptide. Peptides for which a statistically significant decrease in deuterium uptake is found are likely to be part of the epitope. By combining the results of all peptides, the epitope can be more finely characterized.
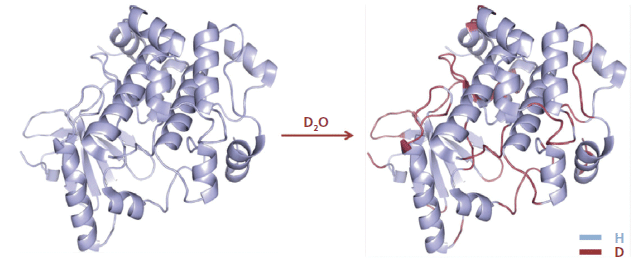
Figure 2: D-labeling of a protein in the presence of an excess of D2O.
Analytical Workflow
Briefly, the experiments, which were replicated at least three times, can be described as follows: The samples were diluted ten-fold into a deuterated buffer for 30 min, after which they were quenched at a low pH (2.5) and a low temperature (1.0 °C) to minimize the amount of back exchange. Furthermore, to ease the online digestion of the proteins in suboptimal conditions, the quench buffer was complemented with high concentrations of a reducing agent that can operate at acidic pH and a chaotropic agent, namely TCEP and guanidine.
Proteins were then injected in the LC system, where they were quickly digested in an immobilized pepsin column, at 20 °C, then desalted on a reversed-phase cartridge, and separated on an analytical reversed-phase column at 0.0 °C (again, to minimize the back exchange). The system was coupled to a high-resolution electrospray ionization quadrupole time-of-flight (ESI-Q-TOF) mass spectrometer for peptide identification and deuteration quantitation purposes, which were assisted by various software solutions (PLGS, UNIFI, and DynamX, all from Waters). Undeuterated peptides (no incubation in D2O) were used as reference point and for MSE-based identification, in which the sequence of the peptides was systematically confirmed by collision-induced dissociation (CID)-based fragmentation. Their observed retention times and theoretical isotope profiles were subsequently used to detect the corresponding deuterated peptides and quantify their deuteration.
Hardware
The HDX experiments were conducted using an HDX-2 system from Waters, consisting of an automated sample preparation bench (which performs the incubation in deuterium, quenching and injection steps at controlled temperature), two pumps (supplying the mobile phases to the digestion, desalting, and analytical columns). A module allows the temperature to be set independently for the digestion column on one hand, and desalting and analysis on the other. Deuteration and digestion were performed at 20 °C, while the quench and desalting/separation at 1 and 0 °C, respectively.
Samples and Buffers
The interleukin receptors unbound and bound to the antibody were prepared at around 25 µM in each partner, in an equilibration buffer composed of 10 mM sodium phosphate complemented with sodium chloride (100 mM) and adjusted to pH 6.8. Given that the KD of the mAb–antigen complex lies in the 10-10 M range, we can assume that more than 99.7% of 1:1 complex is formed at this concentration, hence maximizing the observable effects without resorting to the use of an excess of mAb. Given that the epitope mapping is performed by studying peptides from the antigen, it is preferable to minimize the quantity of mAb peptides that may complicate the detection, identification, and deuterium uptake quantitation of the antigen peptides, because of the large occurrences of peptide coelution resulting from the nonoptimal separation conditions (10 min gradient at 0 °C).
The deuteration buffer composition was matched to the equilibration buffer composition, but in D2O instead of water. The pH was also matched by adjusting its apparent value at 6.4, given that pD = pH – 0.4 (14). The quench buffer was composed of 100 mM sodium phosphate, 400 mM TCEP, and 4 M guanidine, and was adjusted at pH 2.3, hence ensuring that the post-quench pH of the solution was 2.5 by 1:1 mixing. Finally, mobile phases involved in the online digestion and analytical separation of the peptides were water and acetonitrile, adjusted to pH 2.5 with 0.2% formic acid.
Results
Analytical Separation
For peptide identification and deuterium quantitation purposes, it is preferable to limit coelution events as much as possible. Although a short gradient at low temperature cannot extensively separate the large number of peptides entering the column, it is still possible to ensure that there is no large skewing of peptide elution leading to a very large number of them being eluted in a short time range. Figure 3 illustrates the fairly linear elution of undeuterated peptides that was obtained for the interleukin receptor using our experimental conditions, which limited the occurrences of coelution. Furthermore, six injections of independently prepared samples exhibited very little retention time deviation for a randomly selected peptide (0.32% RSD). Calculated across 399 peptides, the average retention time (RT) standard deviation was as low as 0.009 min, which is critical to ensure proper identification of the deuterated peptides later in the experiment.
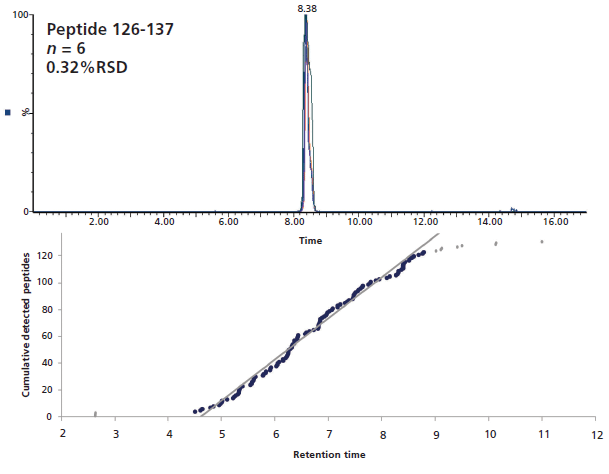
Figure 3: Six overlaid LC–MS chromatograms of a randomly selected interleukin receptor peptide (top), and cumulative peptides elution as a function of time (bottom).
Sequence Coverage
The sequence coverage, peptide length, and average peptide redundancy per amino acid are important parameters regarding the quality of the results, notably in terms of confidence and resolution. It is, of course, preferable to cover the protein sequence as much as possible to avoid missing a binding site. Shorter peptides yield higher resolution results, especially when combined with high redundancy where partially overlapped peptides allow narrowing the sequence of the binding site. A high redundancy also increases the confidence in the results because it provides a means to evaluate the consistency of the results.
An excellent sequence coverage, together with a very good average redundancy, was obtained (99.6%, 6.44 peptides per amino acid; see Figure 4) from 137 peptides identified using both the PLGS and UNIFI software. As expected, the redundancy is not homogeneous; the N-terminal half contains three disulfide bridges and is thus more difficult to digest than the C-terminal half, which does not have any. Hence, the average redundancies of the 8–90 and 178–225 regions are 4.7 and 8.2, respectively. All regions are covered sufficiently well to gather high-quality results.
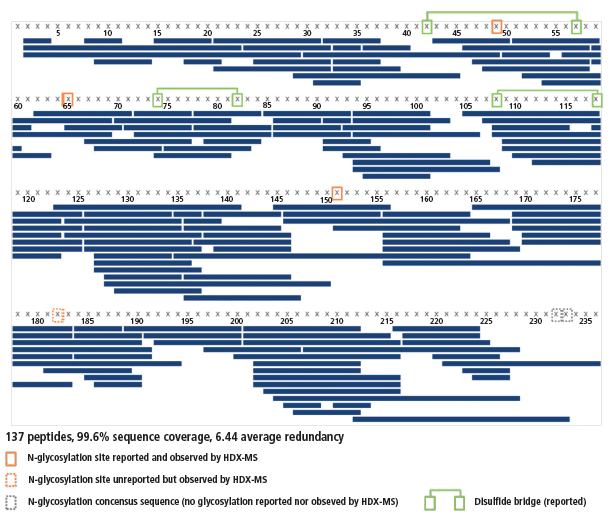
Figure 4: Sequence coverage of the interleukin receptor. Peptides are depicted by blue bars, disulfide bridges by green lines, and N-glycosylation sites by orange frames.
Epitope Determination
The interleukin receptor deuteration D was calculated as an average of the experimental replicates and compared peptide per peptide between the two states (bound versus unbound). The differences between both states were calculated by equation 1, where IL and cplx refer to the interleukin receptor and complex, respectively:

Click here to view full-size graphic
This calculation means that the binding of the mAb on a given peptide would result in a positive ΔD value for said peptide. For instance, such observations can be made for regions 71–85 and 93–125 of the antigen in presence of mAb A (Figure 5), where the difference is above 1.0 Da, an arbitrary threshold often used in the literature (15). mAb B has an additional neighboring region above this threshold (region 125–141), whereas mAb C only has a few peptides barely above the limit, suggesting a lower binding strength, or possibly a different binding mode resulting in a decreased shielding of the backbone hydrogen atoms from the bulk medium. These regions, likely constituting the epitope, are clearly highlighted in a heatmap colored by ΔD (Figure 6). Large regions (regions 1–60, 140–190, and 201–236) show virtually no difference between the two states, whereas other regions (regions 126–139 and 191–200) display slightly higher ΔD values. Incidentally, a secondary epitope site may be hypothesized in the 191–200 region of mAb A only, as also observed by orthogonal techniques (data not shown).
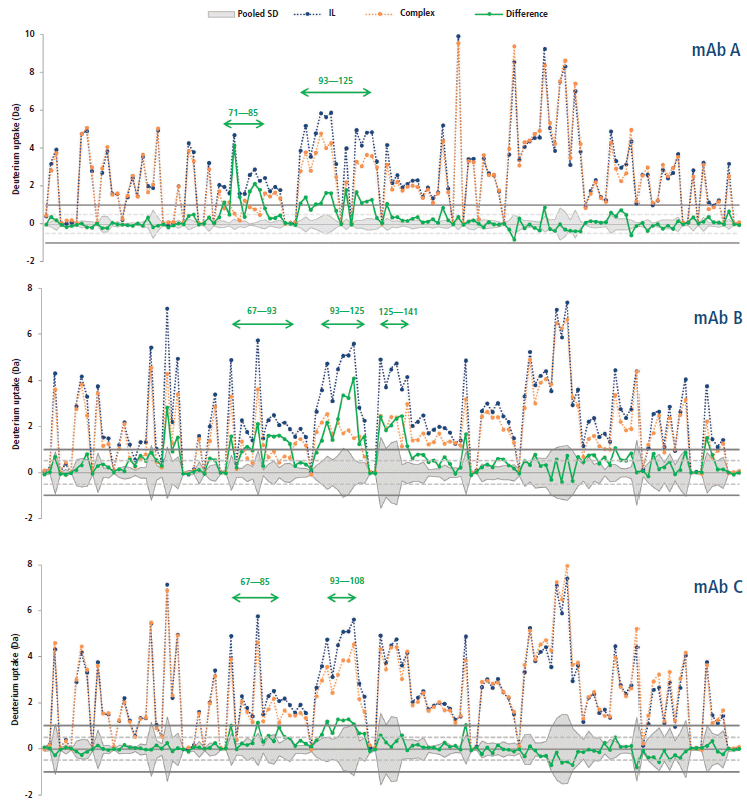
Figure 5: Deuterium uptakes of the interleukin receptor (blue) and complex (orange) peptides (from N- to C-terminal), and corresponding difference (green). The pooled standard deviation is shown as a mirrored grey area. Arbitrary thresholds at ±0.5 and ±1.0 Da are illustrated by dashed and plain gray lines, respectively.
The statistical significance of uptake differences can be assessed by calculating the corresponding pooled standard deviation SDP, following equation 2, where SD is the standard deviation inferred from the replicates.
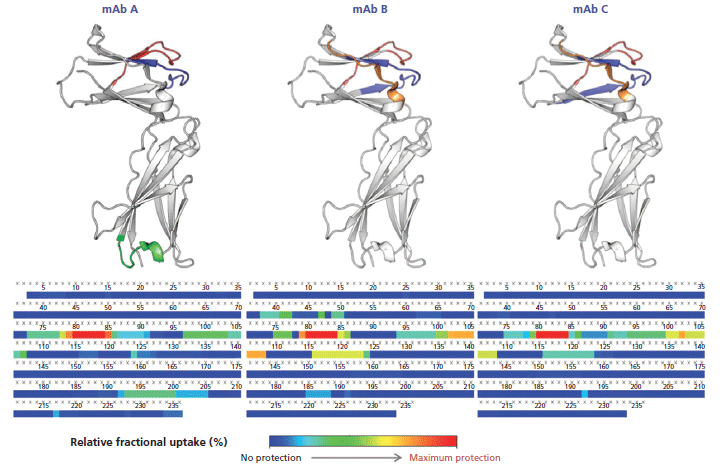
Figure 6: Heatmap of the deuteration differences between the unbound and complexed interleukin receptor (bottom). The inferred epitope site 1 (blue, red and orange) and site 2 (green) are shown on the 3D structure (top).
The hypothesized epitopes exhibit differences larger than their corresponding pooled standard deviation for several peptides, which suggests that there is a statistically significant binding event taking place within these peptides. A few peptides from the secondary site also exhibit this property for mAb A. There is no peptide displaying a significantly negative ΔD in any case, suggesting that no other change in protein conformation leading to more exchangeable hydrogen atoms is taking place upon binding.

Click here to view full-size graphic
To quickly screen all peptides for each complex, an alternative visualization of the results was set up, taking into account both the magnitude of the change in deuteration and the pooled standard deviation. This approach allows the quick identification of the peptides with the most significant changes in deuteration upon binding, hence yielding a robust epitope. This result was achieved by calculation of the SSMD (strictly standardized mean difference), following equation 3.

Click here to view full-size graphic
Each peptide's SSMD was plotted against the deuteration change magnitude DIL/Dcplx, expressed as a base 2 logarithm (Figure 7). As expected, the best peptides (located in the top right-hand corner) are located on the hypothesized primary epitope site, for all three mAb candidates. Note that the experimental conditions used in our study (1:1 molar mixture of the two proteins), together with the excellent KD of the primary epitope, disfavor the discovery of secondary sites.
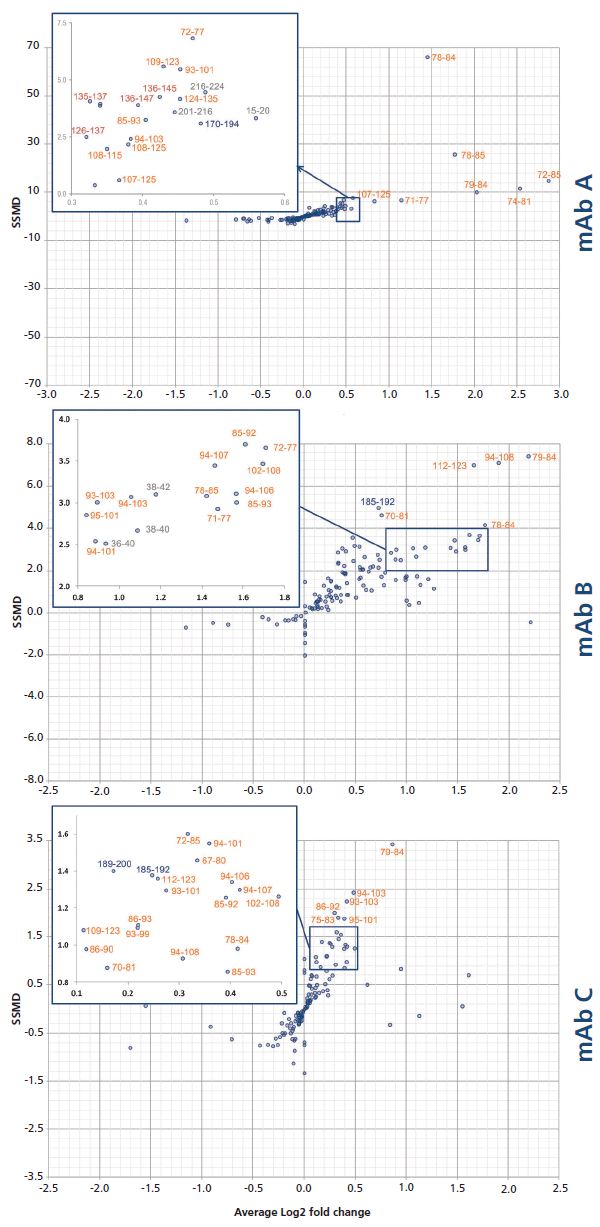
Figure 7: Dual-flashlight plot for the discovery of peptides with a statistically significant protection.
Finally, the changes in deuteration for the hit peptides are qualitatively evident from the corresponding mass spectra, which further strengthens the epitope determination (Figure 8).
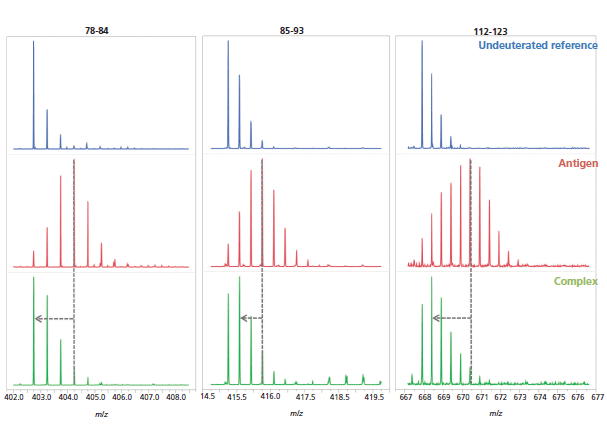
Figure 8: Examples of mass spectra of three peptides (peptides 78–84, 85–93, and 112-123) from the undeuterated antigen reference (blue, top), the deuterated antigen (red, middle), and complex (green, bottom) samples.
Conclusion
Using HDX-MS, the epitope of three mAbs were straightforwardly inferred, in solution, for an interleukin receptor target. Qualitative and quantitative analysis allowed the identification of the peptidic regions of the antigen that are protected from deuteration upon antibody binding. The resulting epitope location is analogous for all three candidates, although one mAb seems to also bind a secondary site.
References
(1) A. Beck, E. Wagner-Rousset, D. Ayoub, A. Van Dorsselaer, and S. Sanglier-Cianférani, Anal. Chem. 85, 715–736 (2013). doi:10.1021/ac3032355.
(2) G.F. Pirrone, R.E. Iacob, and J.R. Engen, Anal. Chem. 87, 99–118 (2015). doi:10.1021/ac5040242.
(3) V.C. Casina, W. Hu, J. Mao, R. Lu, H.A. Hanby, B. Pickens, Z.-Y. Kan, W.K. Lim, L. Mayne, E.M. Ostertag, S. Kacir, D.L. Siegel, S.W. Englander, and X.L. Zheng, Proc. Natl. Acad. Sci. U. S. A. 112, 9620–9625 (2015). doi:10.1073/pnas.1512561112.
(4) J.C. Geoghegan, G. Diedrich, X. Lu, K. Rosenthal, K.F. Sachsenmeier, H. Wu, W.F. Dall'Acqua, and M.M. Damschroder, mAbs 8, 454–467 (2016). doi:10.1080/19420862.2016.1143182.
(5) C. Jost, J. Schilling, R. Tamaskovic, M. Schwill, A. Honegger, and A. Plückthun, Structure 21, 1979–1991 (2013). doi:10.1016/j.str.2013.08.020.
(6) C.G. Sandercock and U. Storz, Nat. Biotechnol. 30, 615–618 (2012). doi:10.1038/nbt.2291.
(7) E. Malito, A. Carfi, and M. Bottomley, Int. J. Mol. Sci. 16, 13106–13140 (2015). doi:10.3390/ijms160613106.
(8) F. Dall'Antonia, T. Pavkov-Keller, K. Zangger, and W. Keller, Methods 66, 3–21 (2014). doi:10.1016/j.ymeth.2013.07.024.
(9) M. Bardelli, E. Livoti, L. Simonelli, M. Pedotti, A. Moraes, A.P. Valente, and L. Varani, J. Mol. Recognit. 28, 393–400 (2015). doi:10.1002/jmr.2454.
(10) J.J. Skinner, W.K. Lim, S. Bédard, B.E. Black, and S.W. Englander, Protein Sci. 21, 987–995 (2012). doi:10.1002/pro.2082.
(11) J.J. Skinner, W.K. Lim, S. Bédard, B.E. Black, and S.W. Englander, Protein Sci. 21, 996–1005 (2012). doi:10.1002/pro.2081.
(12) S.W. Englander, T.R. Sosnick, J.J. Englander, and L. Mayne, Curr. Opin. Struct. Biol. 6, 18–23 (1996).
(13) Y. Bai, J.S. Milne, L. Mayne, and S.W. Englander, Proteins 17, 75–86 (1993). doi:10.1002/prot.340170110.
(14) A.K. Covington, M. Paabo, R.A. Robinson, and R.G. Bates, Anal. Chem. 40, 700–706 (1968). doi:10.1021/ac60260a013.
(15) J. Fang, C. Doneanu, W.R. Alley, Y.Q. Yu, A. Beck, and W. Chen, mAbs 8, 1021–1034 (2016). doi:10.1080/19420862.2016.1193661.
Eric Largy, Caroline Cajot , and Arnaud Delobel are with Quality Assistance SA, in Donstiennes, Belgium. Direct correspondence about this article to arnaud.delobel@quality-assistance.be

New Study Reveals Insights into Phenol’s Behavior in Ice
April 16th 2025A new study published in Spectrochimica Acta Part A by Dominik Heger and colleagues at Masaryk University reveals that phenol's photophysical properties change significantly when frozen, potentially enabling its breakdown by sunlight in icy environments.