Femtosecond vs. Nanosecond Laser Pulse Duration for Laser Ablation Chemical Analysis
Although the choice of laser is still highly dependent on the application requirements, there are distinct fundamental effects attributed to the laser pulse duration that drive the ablation sampling process. Here, we explain the differences between nanosecond and femtosecond laser ablation.

Laser ablation for direct solid sample chemical analysis has advanced over the past 50 years with applications in many disciplines, including environmental, geological, medical, energy, security, and others. Although the choice of laser is still highly dependent on the application requirements, there are distinct fundamental effects attributed to the laser pulse duration that drive the ablation sampling process. An overview of nanosecond and femtosecond laser ablation is presented with respect to analysis based on the optically induced plasma at the sample surface (such as laser-induced breakdown spectroscopy or laser ablation molecular isotopic spectrometry) and transport of the ablated mass aerosol to an inductively coupled plasma.
Laser ablation is widely recognized as a powerful technology for direct solid sampling chemical analysis. Without requiring sample preparation in most cases, any solid sample can be analyzed for elemental and isotopic content within minutes. There are two primary approaches for detecting the ablated mass — either by measuring the photons emitted by the optical induced plasma at the sample surface or by entraining the ablated aerosol into a gas stream with delivery to a secondary source. Laser-induced breakdown spectroscopy (LIBS) and laser-ablation molecular isotopic spectroscopy (LAMIS) are based on measuring optical emission in the plasma (1–10). The inductively coupled plasma (ICP) with mass spectrometry (MS) or optical emission spectroscopy (OES) methods are based on the transport of the ablated aerosol (8,11–20). The sampling process is the same (laser ablation); detection is dictated by the application.
Laser ablation actually dominates in applications other than chemical analysis, such as cutting, welding, micromachining, and laser-assisted in situ keratomileusis (LASIK). Although chemistry is not emphasized in these other applications, their requirements are similar: efficiently use laser photons to remove mass. Over the past 50 years, research has addressed almost every parameter influence on the ablation process. The basis of this column is to provide physical concepts on a critical parameter driving efficient mass removal — the laser pulse duration. This column describes observations from nanosecond and femtosecond ablation research with comments related to chemical analysis based on both plasma emission and particle detection. Picosecond lasers are not addressed mainly because they have not been that prevalent in this field; applications are primarily driven by the availability of commercial lasers. Until about 15 years ago, the majority of research emphasized nanosecond pulsed lasers, which had replaced microsecond and longer pulsed lasers. There are early references on long-pulse laser ablation (21) but for the most part, chemical analysis would be challenging if not for the development of short pulsed (nanosecond and femtosecond) lasers. Based on a series of concepts established from time-resolved measurements, we provide an overview of the processes under which ablation occur. Foremost, we admit upfront that much of the pulsed laser ablation research is empirical — there is no unified theory that predicts the quantity of mass ablated, the chemistry of the plasma, or the aerosol properties from an ablation event. The discussion herein does not delve into specific mechanisms, but instead presents concepts based on observations from reproducible time-resolved measurements.
Fundamentals
Laser Beams
The laser beam provides defined photon energy (wavelength) and power (number of photons per unit time) that is incident on a sample surface for a specific duration of time. For the most part, the wavelength of the laser is not resonant with any specific elemental transitions in the sample (although some research has looked into resonance excitation). In Figure 1, we show the first step in the process in an illustration of a generic sample and spatial representation of nanosecond and femtosecond pulses. In this case, both lasers have the same color or wavelength. This is a first order approximation, because the optical bandwidth of each laser is different. In Figure 1, the femtosecond laser pulse is essentially a delta function in time and space compared to the extended nanosecond pulse. Common values of the laser pulse duration for commercial Nd:YAG and Ti:sapphire lasers are 6 ns and 100 fs, respectively. At any instant, the 100-fs laser pulse is 30 µm long and the 6-ns laser pulse is 1.8 m long. The newer Yb-based fiber lasers have pulse durations of approximately 300 fs. In these cases, the nanosecond laser pulse is 60,000 times longer than the Ti:sapphire and 20,000 times longer than the Yb femtosecond laser pulses. The slight differences in the femtosecond pulse durations will be discussed later; for now, we assume they are similar although on a pure fundamental level there can be subtle differences in excitation and the ablation processes.
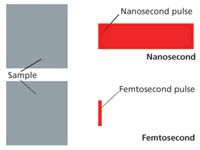
Figure 1: Initial general concept diagram showing spatial extent for red nanosecond and femtosecond pulsed laser beams aiming at the same sample from right to left.
Optical Penetration Depth
Figure 2 shows where things get interesting for the laser-material interaction. First, the optical penetration depth of the laser is different even though the sample and laser wavelength are the same. From a linear one-photon Beer's law model, this would not be the case. However, high peak intensity (energy/area-time) of the laser drives nonlinear processes, in this case multiphoton (n = 2,3, . . . ) absorption. Therefore, the optical penetration depth of the energy is less and the energy per unit volume is greater for femtosecond laser pulses compared to nanosecond laser pulses. The optical penetration depth depends on the sample and the laser irradiance (energy/area-time). In most publications, the parameter of interest is reported as the energy per unit area (fluence), defined by the laser beam spot size on the sample. Although studies show good correlations to fluence, energy per unit volume drives the ablation process (22). Energy is needed to break bonds and move atoms (and particles) from solid to vapor phases. Again, this is only part of the process, as we ignore changes in reflectivity and other processes that are time dependent. Energy imparts work on or in the sample — energy of the photons (laser wavelength), number of photons (pulse energy), and irradiance (power per unit area). Based on an effective optical penetration depth, there is a well-defined volume or number of atoms that have bonds, bond energies, latent processes, and so on, that will play a part in the explosion (ablation) of mass from the irradiated sample. The energy becomes dissipated into different processes, including electronic excitation, ionization, heating, shock, and vaporization. Exact mechanisms, from photons in to kinetic energy of vapor, photon emission (atomic, ionic, and molecular) to aerosol formation are not completely established, and are the basis of many fundamental endeavors. The images in Figure 2 are an example of shock wave and nonlinear absorption induced optical index change for nanosecond and femtosecond laser pulse interactions in a transparent sample.
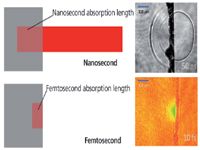
Figure 2: Concept diagram shows the laser pulses entering the same sample from right to left. Optical penetration depth of laser energy in the sample is different because of linear (nanosecond) and nonlinear multiphoton absorption (femtosecond) processes. Top image shows shockwaves induced by optical absorption of the nanosecond pulsed laser inside and outside a glass sample (60). Bottom image represents a transient change in the optical properties from the high intensity femtosecond pulse (26). The irregular vertical line is the glass surface in both images.
Femtosecond and Nanosecond Laser Pulses
A second concept presented in Figure 2 is that the femtosecond pulse is effectively finished on this time scale, say 300 fs after firing each laser, whereas the nanosecond pulse is still irradiating the surface. Ramifications of this behavior are discussed with reference to Figure 3. Keeping with a high-level overview, Figure 3 shows empirical processes distinct for femtosecond and nanosecond laser pulses. The first thing to notice is that the plasma (electrons, atoms, molecular, and particles) is propagating into the laser beam for the nanosecond pulsed laser; laser energy is coupled into the plasma. Even using femtosecond time-resolved imaging above the sample surface, no physical entity has been measured, leaving the surface on the femtosecond time scale; electrons have been measured picoseconds after the laser pulse (23–32). Optical photographs in Figure 3 of laser plasmas established from a copper sample with the same laser energy, spot size, and wavelength confirm the robustness of a nanosecond laser-heated plasma versus a more delicate femtosecond plasma, which is related to plasma heating. The proportion of laser energy absorbed or even reflected by this plasma depends on many conditions, including time, temperature, electron, and mass density. Laser plasma heating is a likely reason why nanosecond pulsed lasers are more common for LIBS applications because they offer a more robust, longer persistence plasma. Ideally, the ablated mass is a vapor, heated to excite atoms, ions, and molecules for optical emission by LIBS and LAMIS. Over a short time, as the plasma expands and cools, the vapor nucleates and condenses to form particles that are available for entrainment and transport to the ICP.
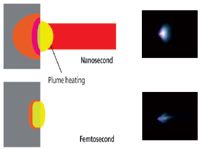
Figure 3: Concept diagram shows that the nanosecond laser is still illuminating the sample while the plasma is expanding, whereas the femtosecond pulse is over before any mass can leave the surface. The heated region is deeper for the nanosecond versus the femtosecond pulse. Images are photographs of the laser plasma, showing the effect of laser-plasma heating from the nanosecond plasma (61).
Heating
The concepts presented in Figure 4 illustrate that heating and the heat affected zone (HAZ), which is proportional to the square root of the pulse duration, are significantly larger for nanosecond pulses. For a laser pulse duration of 100 fs, the HAZ in an alloy is about 4 nm compared to approximately 1000 nm for a 6-ns pulse. Figure 4 shows a large heated and melted region as the energy in the nanosecond pulse has had time to dissipate into the sample; phonon modes initiate about 10 ps after the initial laser beam interaction with a sample, so a 100-fs laser pulse is over before a molecule can vibrate. The HAZ describes part of the mechanism because it is the amount of energy in this zone as a function of time; how the atoms and molecules respond to this energy per unit volume and time is an ongoing research program in many disciplines. Heating to a melt phase is considered detrimental in the ablation process because the sample can undergo preferential vaporization. Heating also drives elemental migration within the bulk, effectively changing the stoichiometry in the sample. Accuracy of analysis can be compromised by single and successive pulsed laser ablation if heating is sufficient to drive these processes. For accurate analytical chemistry, the ablated mass should be stoichiometric to the sample composition. (The word "should" is used here because quantitative analytical chemical analysis can be achieved under fractionation conditions if matrix-matched standards are available and ablate exactly the same as the sample, which is often not the case.) A final comment about Figure 4 is that this is the time period in which LIBS and LAMIS are performed. The exact time depends on the laser pulse duration and energy. Common times are approximately 1 µs for nanosecond pulsed LIBS, several microseconds for LAMIS, and several hundred nanoseconds for femtosecond pulsed LIBS, all after the laser pulse. The graph in Figure 4 shows the different plasma persistence from nanosecond and femtosecond ablation with the same wavelength, energy, and spot size; pulse duration was the only different parameter.
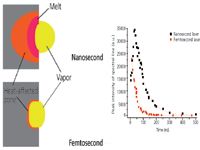
Figure 4: Concept diagram shows the heat affected zone (HAZ) in the sample. HAZ is proportional to the square root of the pulse duration and therefore there is much greater heating for nanosecond than femtosecond pulses. The graph shows relative decay rates of measured optical emission from two plasmas initiated with lasers having all properties equal except the pulse duration (25).
Producing Particles
Figures 5 and 6 describe the particle (aerosol) character of the ablated mass. We believe there are at least two processes for producing particles: some are ejected from the surface as distinct particles (fracture, spallation, or melt flush) (Figure 5) and others undergo nucleation and condensation from vapor to form nanoparticles (Figure 6). Particles are important for laser-ablation ICP-MS, but deleterious for LIBS and LAMIS. Ideally, there would be no ejected particles, or if there were, they would not originate from melt flushing and would be stoichiometric. Ejected particles also can be too large to be entrained, transported, or digested in the ICP. Particles from the condensate will be of nanometer size and are better suited for ICP analysis. Ejected particles are observed shortly after the laser pulse; whereas condensed particles are formed later in time as the plasma expands and cools.
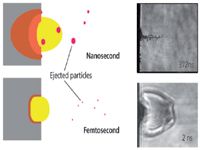
Figure 5: Concept diagram representing direct ejection of particles. The particle sizes and size distribution are related to the heated volume. The images at right are examples of time-resolved shadowgraphs for ejected particles from a surface (on the left). The spatial resolution of the images can resolve particles greater than a few hundred nanometers.
We know from differential mobility analysis (DMA) and scanning electron microscopy (SEM) measurements that the particle size distribution is strongly dependent on the sample and laser properties. Sticking with this overview of only laser pulse duration, there are numerous studies showing that the particle size and size distribution are smaller and narrower, respectively, for femtosecond than for nanosecond laser pulses (33–35). This observation holds for both the ejected and nucleated particles. Some reasons for smaller particles from femtosecond ablation include less melting, higher energy per volume, smaller HAZ, and in many cases, less total mass ablated per pulse, so that the nucleated particles are smaller; nucleation and condensation are based on the vapor density. The higher expansion rate of the femtosecond plasma also supports a more rarified vapor. The shadowgraph images in Figure 5 show ejected particles from nanosecond laser ablation and only the shockwave from femtosecond ablation; ejected particles could not be observed in these types of measurements under the energy conditions generally used for femtosecond sampling into the ICP-MS system. SEM images in Figure 6 show particles from nanosecond and femtosecond ablation when all conditions, except the pulse duration, were constant. Again, these analyses are general cases; laser parameters can be adjusted to provide smaller or larger particles from any sample. We are addressing the parameter space that is optimized for ablation chemical analysis commonly used for LIBS, LAMIS, and laser-ablation ICP-MS applications. A caveat about particle size measurements using a DMA system: it does not distinguish agglomerated particles from primary particles. As particle sizes become smaller, agglomeration is enhanced. Therefore, DMA measurements should be supported by SEM images.
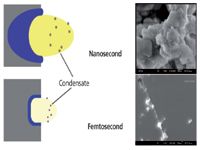
Figure 6: Concept diagram showing the sample and plasma cooling stage. Plasma cooling leads to nucleation and condensation of nanoparticles. The scanning electron microscopy images (right) show particles collected from ablation with two lasers having the same parameters except for the pulse durations (61).
After the Ablation Process
Figure 7 shows the sample after the ablation process is finished and images of craters produced using nanosecond and femtosecond laser ablation with all parameters equal except the pulse duration. Again, these figures are only for discussion to demonstrate commonly observed effects. The HAZ is larger for the nanosecond case and shows a rim around the crater; a smaller area of the original sample was influenced by the femtosecond laser, and the ablated mass was removed by nonthermal photophysical processes without producing a rim due to melt flushing. The total amount of mass removed (ablated) will strongly depend on the energy in the laser pulse. Generally, microjoules or millijoules of energy per pulse are used for femtosecond or nanosecond laser ablation, respectively. Therefore, less mass will be removed for the femtosecond pulse. Nanosecond pulsed lasers in the deep UV can produce clean craters without a significant rim, and rim formation has been observed under nonoptimal femtosecond cases. Again, many parameters govern the ablation process and can be varied to produce a wide range of effects. Irrespective of the rim, the fundamentals of the HAZ remain intact; using femtosecond laser ablation less heating, more energy per bonds, and more efficient use of photon energy for ablation are obtained.

Figure 7: Concept diagram shows the sample after all processes are finished. The affected region in the sample is related to the pulse duration. Melting leads to rim formation around the crater (ablated mass). The images are white-light interferograms of copper surfaces after ablation using nanosecond (top) and femtosecond (bottom) pulses having the same energy, wavelength, and spot size (14).
Advantages for Analytical Chemistry
Given these attributes of femtosecond laser pulses we ask the following question: How is analytical chemistry affected? Precision and accuracy have been reported to be improved in many ICP-MS studies (36–39). Improved precision using femtosecond laser ablation has been attributed to smaller particles and a narrower particle size distribution. In addition, the lower amount of mass does not overload the ICP. Onset of vaporization, ionization, the ion cloud, and chemical interference effects are highly dependent on the aerosol (dry, in this case). Accuracy is improved by using the femtosecond laser because of minimized heating of the sample. But there are other attributes beyond these performance metrics. Common criticisms of laser ablation are inhomogeneity of the sample, representative sampling, and sensitivity. However, all of these concerns can be mitigated by using high repetition rate femtosecond laser ablation. High repetition rate femtosecond laser ablation sampling has been shown to support bulk sample analysis by faster scanning over small sample areas (40–44). The amount of sample needed will be related to the inhomogeneity, and in most cases, will be much less than that required for sample dissolution in acid and subsequent liquid nebulization. It is more practical to remove smaller amounts of mass from each low-energy femtosecond laser pulse with high repetition rates to get the mass quantity sufficient for analysis, instead of relying on a single high-energy nanosecond laser pulse to remove the same amount of mass. The ICP benefits from the finer and more continuous high repetition rate femtosecond laser ablation process, which is similar to a liquid nebulizer. There are many corollaries for laser ablation with liquid nebulizers such as controlling the amount of mass and providing a continuous stream of sample to the ICP with the right particle distribution. Early nebulizers wasted sample because the droplet size distribution, which affects precision and accuracy, was not suitable for the ICP. The same goes for laser ablation: As we improve the particle size and distribution, performance improves.
Laser ablation provides amazingly sensitive absolute detection — at the femtogram and attogram levels (37,45–52). The reason for the relative insensitivity (compared to liquid nebulization) is the small amount of mass that is sampled during ablation. By using high repetition rate femtosecond lasers, the amount of mass can be increased to provide limits of detection comparable to those obtained using liquid nebulization, without requiring as much mass as liquid nebulization. Laser ablation is better suited for solids analysis (Why use acid digestion and more sample than necessary?) As the laser continues to ablate to achieve sufficient mass, elemental migration and preferential vaporization need to be minimized. These processes are mitigated by using femtosecond laser pulses with the very small HAZ.
Conclusions
Fundamental processes have been studied for years, and we ignored processes like shockwaves, spallation, Coulomb explosion, phase explosion, plasma chemistry, spatial gradients in the plasma, and more. Even if we do not fully understand the ablation processes, reproducible control of the interaction to produce an ideal aerosol for ICP-MS or an ideal plasma for LIBS or LAMIS can be achieved; understanding the fundamentals drives advancement. In spite of our inability to completely unravel underlying mechanisms, the beauty of this technology is that the process is reproducible using set parameters (just like those of any analytical technique) for laser energy, pulse duration, fluence, and wavelength. Analytical performance metrics are improved using femtosecond rather than nanosecond laser ablation. This does not mean that nanosecond pulsed laser ablation is not a viable solution for many applications. Good analytical chemistry can be performed with a nanosecond pulsed infrared (IR) laser if matrix-matched standards exist and if the ICP-MS is optimized for such ablation conditions. For most LIBS applications, nanosecond pulsed IR lasers are common to establish a robust long-persistence plasma (1,2). Femtosecond laser ablation provides advantages for applications that need excellent precision, high efficiency, and do not have matrix-matched standards (53). Finally, the femtosecond laser pulse duration is (to the best of our knowledge) the only way to ablate with nanometer spatial dimensions, both lateral and depth (45,54–59). Again, the HAZ defines the volume of sample affected by the energy, allowing imaging and depth profiling on the nanometer scale.
Acknowledgments
The authors would like to thank Dr. Tim Suen for the design of the pulse-duration concept slides. R.E.R., X.L.M., and J.J.G. acknowledge support from the Chemical Science Division, Office of Basic Energy Sciences, and the Defense Nuclear Nonproliferation Research and Development Office of the US Department of Energy (DOE) under contract number DE-AC02-05CH11231 at the Lawrence Berkeley National Laboratory. J.Y. acknowledges support from the DOE SBIR Program.
References
(1) D.W. Hahn and N. Omenetto, Appl. Spectrosc. 66(4), 347–419 (2012).
(2) D.W. Hahn and N. Omenetto, Appl. Spectrosc. 64(12), 335–366 (2010).
(3) R. Fantoni, L. Caneve, F. Colao, L. Fornarini, V. Lazic, and V. Spizzichino, Spectrochimica Acta-B-Atomic Spectroscopy 63(10), 1097–1108 (2008).
(4) R. Noll, V. Sturm, ü. Aydin, D. Eilers, C.D. Gehlen, M. HÖhne, A. Lamott, J. Makowe, and J. Vrenegor, Spectrochimica Acta-B-Atomic Spectroscopy 63(10), 1159–1166 (2008).
(5) D. Santos, L.C. Nunes, G.G.A. de Carvalho, M.S. Gomes, P.F. de Souza, F.O. Leme, L.G.C. dos Santos, and F.J. Krug, Spectrochimica Acta-B-Atomic Spectroscopy 71–72, 3–13 (2012).
(6) V.K. Singh and A.K. Rai, Lasers Med. Sci. 26(5), 673–687 (2011).
(7) A.P.M. Michel, Spectrochimica Acta-B-Atomic Spectroscopy 65(3), 185–191 (2010).
(8) R.E. Russo, A.A. Bol'shakov, X. Mao, C.P. McKay, D.L. Perry, and O. Sorkhabi, Spectrochimica Acta-B-Atomic Spectroscopy 66(2), 99–104 (2011).
(9) X. Mao, A.A. Bol'shakov, I. Choi, C.P. McKay, D.L. Perry, O. Sorkhabi, and R.E. Russo, Spectrochimica Acta-B-Atomic Spectroscopy 66(11–12), 767–775 (2011).
(10) X. Mao, A.A. Bol'shakov, D.L. Perry, O. Sorkhabi, and R.E. Russo, Spectrochimica Acta-B-Atomic Spectroscopy 66(8), 604–609 (2011).
(11) J. Koch and D. Gunther, Appl. Spectrosc. 65(5), 155–162 (2011).
(12) R. Hergenroder, O. Samek, and V. Hommes, Mass Spectrometry Reviews 25(4), 551–572 (2006).
(13) R. Hergenroder, Spectrochimica Acta-B-Atomic Spectroscopy 61(3), 284–300 (2006).
(14) R.E. Russo, J. Gonzalez, and C. Liu, LabPLus International (2006).
(15) J.S. Sabine Becker, Int. J. Mass Spectrom. 242(2–3), 183–195 (2005).
(16) D. Gunther and B. Hattendorf, TrAC, Trends Anal. Chem. 24(3), 255–265 (2005).
(17) R.E. Russo, X. Mao, C. Liu, and J. Gonzalez, J. Anal. At. Spectrom. 19(9), 1084–1089 (2004).
(18) B. Hattendorf, C. Latkoczy, and D. Gunther, Anal. Chem. August A, 342 A (2003).
(19) D. Gunther, Anal. Bioanal. Chem. 372(1), 31–32 (2002).
(20) R.E. Russo, X. Mao, H. Liu, J. Gonzalez, and S. Mao, Talanta 57(3), 425–451 (2002).
(21) K. Rink, G. Delacretaz, and R.P. Salathe, Appl. Phys. Lett. 61(3), 258–260 (1992).
(22) M. Shannon, X. Mao, A. Fernandez, W. Chan, and R.E. Russo, Anal. Chem. 67, 4522–4529 (1995).
(23) S. Mao, F. Quere, S. Guizard, X. Mao, R.E. Russo, G. Petite, and P. Marsili, Applied Physics A 79(7), 1695–1709 (2004).
(24) X. Zeng, X. Mao, S.-B. Wen, R. Greif, and R.E. Russo, Journal of Physics D Applied Physics 37, 1132–1136 (2004).
(25) X. Zeng, X.L. Mao, R. Greif, and R.E. Russo, Applied Physics A 80(2), 237–241 (2004).
(26) X. Mao, S. Mao, and R.E. Russo, Appl. Phys. Lett. 82, 697 (2003).
(27) S. Mao, X. Mao, R. Greif, and R.E. Russo, J. Appl. Phys. 89, 4096 (2001).
(28) S. Mao, X. Mao, R. Greif, and R.E. Russo, Appl. Phys. Lett. 76, 31 (2000).
(29) S. Mao, X. Mao, R. Greif, and R.E. Russo, Appl. Phys. Lett. 77, 2464 (2000).
(30) S. Mao, X. Mao, R. Greif, and R.E. Russo, Appl. Phys. Lett. 76, 3370 (2000).
(31) S. Mao, R. Greif, X. Mao, and R.E. Russo, J. Heat Transfer 122, 424 (2000).
(32) R.E. Russo, X. Mao, H. Liu, J.H. Yoo, and S. Mao, Applied Physics A 69(7), 887–894 (1999).
(33) J. Gonzalez, C. Liu, S.-B. Wen, X. Mao, and R.E. Russo, Talanta 73(3), 577–582 (2007).
(34) J. Gonzalez, C. Liu, S.-B. Wen, X. Mao, and R.E. Russo, Talanta 73(3), 567–576 (2007).
(35) J. Koch, S. Schlamp, T. RÖsgen, D. Fliegel, and D. Gunther, Spectrochimica Acta-B-Atomic Spectroscopy 62(1), 20–29 (2007).
(36) Z. Yang, B.J. Fryer, H.P. Longerich, J.E. Gagnon, and I.M. Samson, J. Anal. At. Spectrom. 26(2), 341–351 (2011).
(37) M. Shaheen and B.J. Fryer, J. Anal. At. Spectrom. 25(7), 1006–1013 (2010).
(38) J. Gonzalez, D. Oropeza, X. Mao, and R.E. Russo, J. Anal. At. Spectrom. 23(2), 229–234 (2008).
(39) R. Freydier, F. Candaudap, F. Poitrasson, A. Arbouet, B. Chatel, and B. Dupre, J. Anal. At. Spectrom. 23(5), 702–710 (2008).
(40) J. Gonzalez, D.D. Oropeza, X. Mao, H.P. Longerich, and R.E. Russo, J. Anal. At. Spectrom. 27, 1405–1412 (2012).
(41) E. Ricard, C. PÉcheyran, G. Sanabria Ortega, A. Prinzhofer, and O.F.X. Donard, Anal. Bioanal. Chem. 399(6), 2153–2165 (2010).
(42) F. Claverie, B. Fernandez, C. PÉcheyran, J. Alexis, and O.F.X. Donard, J. Anal. At. Spectrom. 24(7), 891–902 (2009).
(43) J. Gonzalez, A. Fernandez, D. Oropeza, X. Mao, and R.E. Russo, Spectrochimica Acta-B-Atomic Spectroscopy 63(2), 277–286 (2008).
(44) G. Ballihaut, F. Claverie, C. PÉcheyran, S. Mounicou, R. Grimaud, and R. Lobinski, Anal. Chem. 79(17), 6874–6880 (2007).
(45) V. Zorba, X. Mao, and R.E. Russo, Spectrochimica Acta-B-Atomic Spectroscopy 66(2), 189–192 (2010).
(46) A. Matusch, C. Depboylu, C. Palm, B. Wu, G.U. HÖglinger, M.K.-H. SchÄfer, and J.S. Becker, J. Am. Soc. Mass Spectrom. 21(1), 161–171 (2010).
(47) S. Johnston, G. Gehrels, V. Valencia, and J. Ruiz, Chem. Geol. 259(3), 218–229 (2009).
(48) M. Guillong and C.A. Heinrich, J. Anal. At. Spectrom. 22(12), 1488–1494 (2007).
(49) D.E. Jacob, Geostand. Geoanal. Res. 30(3), 221–235 (2006).
(50) C. Latkoczy and D. Gunther, J. Anal. At. Spectrom. 17(10), 1264–1270 (2002).
(51) R.E. Russo, X. Mao, O.V. Borisov, and H. Liu, Encyclopedia of Analytical Chemistry A5110M, 1–22 (2000).
(52) D. Gunther and C. Heinrich, J. Anal. At. Spectrom. 14(9), 1363–1368 (1999).
(53) A.M. Duffin, G.L. Hart, R.C. Hanlen, and G.C. Eiden, J. Radioanal. Nucl. Chem. 1–6 (2012).
(54) V. Zorba, J. Syzdek, X. Mao, R.E. Russo, and R. Kostecki, Appl. Phys. Lett. 100(23), 234101–234101–5 (2012).
(55) V. Zorba, X. Mao, and R.E. Russo, Anal. Bioanal. Chem. 396(1), 173–180 (2010).
(56) D.J. Hwang, H. Jeon, C.P. Grigoropoulos, J. Yoo, and R.E. Russo, J. Appl. Phys. 104(1), 13110–13110 (2008).
(57) C.P. Grigoropoulos, D.J. Hwang, and A. Chimmalgi, MRS Bulletin 12, 1–7 (2007).
(58) D.J. Hwang, H. Jeon, C.P. Grigoropoulos, J.H. Yoo, and R.E. Russo, Appl. Phys. Lett. 91, 251118 (2007).
(59) D.J. Hwang, C.P. Grigoropoulos, J.H. Yoo, and R.E. Russo, Appl. Phys. Lett. 89, 254101 (2006).
Richard E. Russo is with the Lawrence Berkeley National Laboratory and Applied Spectra, Inc. Xianglei Mao is with the Lawrence Berkeley National Laboratory. Jhanis J. Gonzalez is with the Lawrence Berkeley National Laboratory and Applied Spectra, Inc. Jong Yoo is with Applied Spectra, Inc.

