High-Resolution Time-of-Flight Mass Spectrometry for Rapid Petroleum Characterization
The application of high-resolution TOF-MS to petroleomics is presented, and the basic theory of each type of ultrahigh-resolution mass spectral platform is briefly explained.
High-resolution time-of-flight mass spectrometry (TOF-MS) was investigated as an alternative to Fourier transform mass spectrometry (FT-MS) for the direct analysis of heteroatomic species in crude petroleum. The practical implications of this technique's advantages and drawbacks were explored. The favorable resolution profile observed for high-resolution TOF-MS versus FT-MS instruments yields enhanced spectral peak capacity at higher mass-to-charge ratios (m/z), allowing more extensive characterization of heavy components within crude petroleum.
To study the individual components of a mixture as complex as crude petroleum, an ultrahigh-resolution technique is required. Comprehensive two dimensional gas chromatography (GC×GC) evolved to enable the separation of what had been called the "unresolved chromatographic mass" ubiquitous to one-dimensional petroleum chromatograms. Direct infusion ultrahigh-resolution mass spectrometry (MS) resolves signals of important petroleum constituents that are not amenable to GC such as asphaltenes and high-molecular-weight heteroatomic species (1,2).
Characterization of heteroatomic species present in crude petroleum is critical to the environmental and the economic impact of petroleum recovery, refining, and use as well as for ascertaining the nature and history of petroleum deposits. Accordingly, considerable resources have been invested in developing analytical technologies and methods for the characterization of heteroatomic content in crude petroleum. Petroleomics (1,2) refers to comprehensive approaches to such characterization as well as the acquisition of other information.
The first mass spectral technology to allow sufficiently detailed petroleomic characterization was Fourier transformation ion cyclotron resonance (FT-ICR) MS (1,2). The ultrahigh spectral resolution achieved by FT-ICR enables multiple thousands of individual crude petroleum components to be measured simultaneously in a single direct infusion experiment that typically lasted only a few minutes. The magnitude of information content delivered in a short time made FT-ICR the authoritative, and for a long time, the only technology for rapid comprehensive characterization of heteroatomic species in crude petroleum, because of the requirement for resolution approaching 100,000.
More recently, alternative technologies to FT-ICR have been introduced. Electrostatic ion-trap Fourier transform MS (Orbitrap, Thermo Fisher Scientific) is one such alternative (3). As another FT-based technology, it shares similar strengths and weaknesses with FT-ICR. High-resolution time-of-flight mass spectrometry (TOF-MS) is a more complementary alternative, with different advantages and drawbacks.
This article presents the application of high-resolution TOF-MS to petroleomics. The basic theory of each type of ultrahigh-resolution mass spectral platform is explained briefly. Results from high-resolution TOF-MS analysis of various crude petroleum samples are presented with a short discussion of the meaning of these results.
Theory
Resolution
Conventional expressions of spectral resolution have shifted from definitions based on spectral peak width at 5% or 10% of the apex height, to definitions based on spectral peak width at 50% of the apex height, or full width half maximum (FWHM). This was driven by the evolution of mass spectral technology, and possibly also by instrument vendors' desire to present specifications with more impressive-looking numbers.
The first high-resolution mass spectrometers, magnetic sector instruments, yielded peak shapes very close to Gaussian. Sector instruments still lead all other high-resolution platforms with respect to Gaussian nature of peak shape. This peak shape fidelity made the 10% valley definition of resolving power meaningful and natural.
Sector instruments were largely replaced by FT-ICR instruments as the latter achieved resolution that was orders of magnitude superior to that achieved by the former. However, apodization and zero-filling applied when transforming the ICR image current to a mass spectrum can significantly impact peak shape, and much higher Lorentzian character can result. As Lorentzian character increases, peaks will appear narrower on top, and mass resolving power expressed at FWHM will increase. The penalty for this inflation of resolving power at FWHM (RFWHM) is peaks that are wider near the base and have diminished resolving power expressed using historical definitions.
Among newer high-resolution platforms, electrostatic FT instruments are generally subject to the same peak shape considerations as ICR instruments, and data treatment can introduce significant Lorentzian character. TOF instruments can yield spectral peak shapes somewhere between those generated by sector instruments and FT-based instruments, except that ion physics and instrument tuning generally affect peak shape more than mathematical considerations.
The mass resolving power required to distinguish any pair of isobars depends on their intensities relative to each other. As intensity becomes increasingly disparate, higher mass resolving power is needed to observe separate peak apexes. Most isobars recorded are of unequal intensity, and the ability to separate a small signal from the foot of a large signal is important to maximize the information content of a mass spectrum. Therefore, peak width near the base may be more relevant than peak width at FWHM.
The mass resolving power required to distinguish any pair of isobars also depends on their mass-to-charge ratio (m/z). At higher m/z values, higher mass resolving power is required. Therefore, an ideal, hypothetical high-resolution mass spectrometer would exhibit mass resolving power that increased linearly with m/z.

Figure 1: Expected Gaussian spectral peak widths for selected mass spectrometers: (a) absolute units (mDa), (b) relative units (ppm).
Figure 1 shows expected spectral peak width curves at 10% of peak height as a function of m/z for several high-resolution instruments. The peak width curves for the 7-T FT-ICR system and the standard electrostatic ion-trap FT-MS system are taken directly from descriptions of these instruments published by Makarov and colleagues (4). The 0.76-s transient time, the apodization, and zero-filling are exactly as described in this publication. The peak width curves for the high-resolution TOF-MS instrument are calculated from resolving power curves with asymptotic limits of R FWHM = 50,000, and R FWHM = 100,000. Figure 1 also assumes perfectly Gaussian peak shape for all instruments.
Figure 1 clearly shows that FT-based instruments yield narrower spectral peaks at low m/z, and high-resolution TOF-MS instruments yield superior resolution at higher m/z values. Crude petroleum contains important analytes of m/z >1000, such as asphaltenes and high-molecular-weight tetracarboxylic acids (ARN acids). The opposing trends of the curves for FT-based instruments and high-resolution TOF-MS instruments renders these technologies complementary.
Spectral Information Content
Spectral resolution translates into spectral information content. Spectral information content may be expressed as the total number of chemically relevant signals resolvable over a given range of m/z values. This number is related to the spectral peak width and to the range of mass defects available for chemically relevant signals.
The approximate upper limit of chemically possible mass defect is the Kendrick line, or the line of Kendrick mass defect = 0. This line of mass defect is taken from the Kendrick mass scale (5) which defines the mass of 12 CH2 ≡ 14, rather than the mass of 12 C ≡ 12. Only higher isotopologues of saturated hydrocarbons will have a mass defect greater than the Kendrick line. The lower limit of chemically possible mass defect depends significantly on heteroatomic content. Because the constituents of crude petroleum are composed principally of carbon, the line of conventional mass defect = 0 may be used as a rough lower limit of chemically possible mass defect for petroleum constituents. The distance between the Kendrick line and the carbon line increases as nominal mass increases.
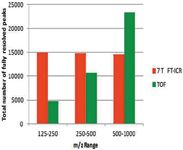
Figure 2: Spectral peak capacity.
From the curves in Figure 1, and the range of chemically possible mass defects described above, the total number of resolvable signals may be calculated. Figure 2 compares the total possible information content that could be captured by two instruments for three different m/z ranges. Klitzke and colleagues presented empirical verification of information content captured by two instruments similar to those discussed herein (6). Figure 2 reinforces the complementary capabilities of FT-based and high-resolution TOF-MS systems.
Experimental
Sample Preparation
Crude petroleum samples from various sources were diluted to about 2 mg/mL with a 1:1 mixture of toluene and methanol as described previously (6). From preparation to infusion, care was taken that the samples contacted only clean glass, PTFE, or PEEK surfaces, and finally the stainless steel electrospray emitter.
Mass Spectrometry
The prepared samples were infused at a rate of 10 µL/min to a LECO electrospray ionization (ESI) source that was interfaced with a LECO Citius LC-HRT high-resolution TOF-MS system. The instrument was operated in both negative-ion mode and positive-ion mode. Ion source parameters and optics voltages were optimized to maximize total ion transmission for each sample. For most samples, the high-resolution TOF-MS system was operated with the ultrahigh-resolution flight path (R FWHM ≈ 100,000). To study the effect of flight path on the overall mass spectrum, a single sample was acquired in positive-ion mode using all three available flight paths: nominal resolution (R FWHM ≈ 1500), high resolution (R FWHM ≈ 50,000), and ultrahigh resolution (R FWHM ≈ 100,000).
In ultrahigh-resolution mode, the high-resolution TOF-MS system passes the ions of interest through the full flight path twice. This limits the first acquired time-of-flight and the last acquired time-of-flight to a 1:2 ratio, which corresponds to a 1:4 ratio of acquired m/z. In other words, the acquisition is limited to a range of m/z 100–400, or m/z 400–1600, or any other 1:4 ratio. Because the most abundant signals in crude petroleum samples typically lie between m/z 150 and m/z 600, a single acquisition between these endpoints can capture sufficient information to adequately characterize the sample. If a wider spectral range is required, multiple acquisitions can be stitched together.
Data Processing
All data were acquired and processed with LECO ChromaTOF-HRT software. For most samples, the data acquisition system distilled the profile transient data to centroided stick data before recording to disk. This normal mode of operation records all chemically relevant information without wasting disk space to record meaningless data points in between true signals. In addition to TOF and intensity information, each centroid datum also includes the measured width of the original profile peak. A centroid including TOF, intensity, and spectral peak width information is referred to as stick data. Because profile spectral peak width information is included, reconstructed profile spectra can be easily generated from stick data. To verify fidelity of the stick data, a single sample was acquired as both stick data and full profile data.

Figure 3: Flight path comparison: (a) ultrahigh resolution (RFWHM = 100,000), (b) high resolution (RFWHM = 50,000), (c) nominal resolution (RFWHM = 1500).
After acquisition, LECO ChromaTOF-HRT software was used to internally recalibrate the m/z axis and assign chemical formulas. Negative ion data were recalibrated using abundant highly saturated O2 class signals. Positive ion data were recalibrated using abundant highly saturated N class signals.
Results
Spectral Features
Figure 3 compares the positive-ion ESI spectrum of the same sample acquired using three flight paths. No bias of intensity with respect to m/z is introduced by changing the flight path. Accordingly, all other results presented herein come from data acquired in ultrahigh-resolution mode.

Figure 4: Resolved C30H33N and C27H37NS: (a) profile data, (b) stick data.
Isobaric critical pairs arising from the exchange of C3 with SH4 are among the most important signals to resolve in a crude petroleum spectrum, because accurate assessment of sulfur content by direct infusion ESI-MS depends on the ability to measure these signals independently. Figure 4 shows an isobaric doublet attributed to [C30H33N + H]+ (expected m/z = 408.26858) and [C27H37NS + H]+ (expected m/z = 408.27195), from the same sample acquired in profile spectrum mode and stick spectrum mode. For context, Figure 5 shows a wider segment of the profile spectrum and the stick spectrum surrounding these isobars. The data from this pair of acquisitions confirms fidelity of the stick spectra. The most significant difference between the spectra can be seen at the baseline. The profile spectra contain multitudes of data points recorded across segments of mass defect that are devoid of true chemical signal, while the stick spectra exhibit negligible noise across these segments. Accordingly, all other results presented herein come from stick data.
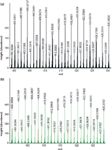
Figure 5: Wider segments of the spectra shown in Figure 4: (a): profile and (b): stick spectra.
Negative ion ESI spectra of crude petroleum samples tend to present more heteroatomic classes than positive-ion ESI spectra, and more challenging isobaric doublets can be present. Figure 6 shows resolved M+1 signals from an abundant N1 class carbazole that overlap monoisotopic signals from two less abundant classes: N2 and O3. Signals shown in Figure 6 are listed in Table I. In the lower m/z region, as in Figure 6, these classes are resolved or partially resolved, and can be measured accurately. At higher m/z values, 15 N isotopes of abundant N1 class carbazoles may inflate the N2 class measurement, and 13 C isotopes of such carbazoles will completely obscure monoisotopic O3 class signals. In such cases, O3 class abundance could be estimated by accurately de-isotoping the data.

Table I: Resolved to partially overlapping N1, N2, and O3 class signals
Successfully de-isotoping spectra would require initial data of high isotopic fidelity. Although FTMS provides unmatched resolving power (>1,000,000), isotope intensity and the ability to de-isotope accuractely is a weakness of these systems compared to high-resolution TOF-MS. Figure 7 plots M+1 isotopic fidelity of the 100 most intense O2 class naphthenic acids in a typical negative-ion ESI spectrum. A couple of apparent outliers are attributed to spurious isobars of unknown origin; further investigation was not pursued.
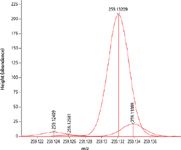
Figure 6: Stick spectrum.
Characterization and Comparison of Samples
High-resolution MS allows rapid characterization and comparison of crude oil samples. Three samples from different sources, herein arbitrarily designated A, B, and C, were concomitantly analyzed. Figure 8 shows the summed intensity of selected heteroatom classes in each of these samples. Sample A appears richer in nitrogen than the other samples, and sample C appears enriched in some thiophenated species. The summed intensities also suggest that sample A is more acidic than the other samples.
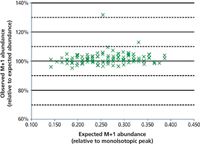
Figure 7: Isotopic fidelity of 100 naphthenic acids in a crude petroleum negative ion ESI spectrum obtained by high-resolution TOF-MS.
Rings plus double bond equivalents (RDBE) plots illustrate useful information regarding the species present in each sample. Figure 9 compares the O2 class RDBE profile for each of the three samples. The increased overall intensity of sample A predicts a higher risk of processing equipment corrosion. All three profiles exhibit similar shoulders above an RDBE count of 5, consistent with the presence of oxidized aromatic species, thereby indicating similar extents of degradation.

Figure 8: Summed intensities of selected heteroatom classes in each of the three different crude petroleum samples.
Figure 10 compares the N class RDBE profile for each of the three samples. The intense series of carbazole benzologues observed in sample A, and present relatively weakly in samples B and C, predict different requirements for hydrodenitrogenation in the crude processing.
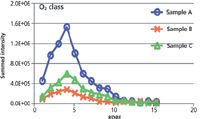
Figure 9: O2 class rings plus double bond equivalents (RDBE) comparison of three samples.
Conclusions
High-resolution TOF-MS, operated near a mass resolving power of 100,000 (FWHM), can rapidly characterize critical aspects of crude petroleum samples, and allow meaningful comparison of samples from various sources.
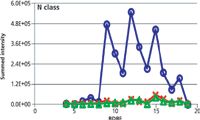
Figure 10: N class RDBE comparison of three samples.
In spectral accuracy, and in the relationship between resolution and m/z, high-resolution TOF-MS complements FT-based mass spectral techniques. FT-based techniques may achieve superior mass accuracy, whereas TOF instruments offer a combination of mass accuracy and isotopic fidelity that can be exploited for unambiguous formula assignment. FT-based techniques exhibit superior resolution at low m/z values, and TOF instruments excel at higher m/z values. High-resolution TOF-MS provides robust isotope information which may be further leveraged while this is an Achilles heel for FT-MS. Therefore, high-resolution TOF-MS can complement FT-MS in a high performance characterization laboratory, or serve as a low-cost alternative for rapid petroleomic characterization.
References
(1) A.G. Marshall, G.T. Blakney, S. Beu, C. Hendrickson, A. McKenna, J.M. Purcell, R.P. Rodgers, and F. Xian, Eur. J. Mass Spectrom. 16, 367–371 (2010).
(2) A.G. Marshall and R.P. Rodgers, Proc. Natl. Acad. Sci. 105(47), 18090–18095 (2008).
(3) A.E. Pomerantz, O.C. Mullins, G. Paul, J. Ruzicka, and M. Sanders, Energy and Fuels 25(7), 3077–3082 (2011).
(4) A. Makarov, E. Denisov, and O. Lange, J. Amer. Soc. Mass Spectrom. 20(8), 1391–1396 (2009).
(5) E. Kendrick, Analytical Chemistry 35(13), 2146–2154 (1963).
(6) C. Klitzke, Y. Corillo, K. Siek, J. Binkley, J. Patrick, and M. Eberlin, Energy and Fuels 26(9), 5787–5794 (2012).
Kevin Siek, Joe Binkley, and Jeffrey S. Patrick are with LECO Corporation in St. Joseph, Michigan. Direct correspondence to: kevin_siek@leco.com
Leveraging Electrochemical Impedance Spectroscopy for Lithium-Ion Battery Temperature Prediction
January 17th 2025Researchers have developed a non-invasive, highly accurate method using electrochemical impedance spectroscopy (EIS) to predict the temperature of lithium-ion batteries in real time.
Agilent Presents Awards to 3 Professors for Lithium-Ion Battery Research
January 15th 2025The Solutions Innovation Research awards were presented to Professor Anders Bentien of Aarhus University, Professor Walter Gössler of the University of Graz, and Professor Gregory Offer of Imperial College London.
Using NIR Spectroscopy in Low-Level Petroleum Hydrocarbon Detection
November 25th 2024Researchers in China have developed a novel workflow for near-infrared reflectance spectroscopy (NIRS or NIR) that enhances the detection of low-level petroleum hydrocarbon pollution in soils, revealing new diagnostic features and significantly improving sensitivity for environmental monitoring.