Imaging of Trace Elements Using Laser Ablation–Inductively Coupled Plasma–Mass Spectrometry: Emerging New Applications
Metallomics seeks to understand the metallobiochemistry of cells and organisms in health and disease. This article explains the principle of laser ablation–inductively coupled plasma–mass spectrometry (LA-ICP-MS) for imaging applications and highlights its potential to provide additional insights in bioanalysis and metallomics.
The qualitative and quantitative determination of trace elements is a stronghold of inductively coupled plasma–mass spectrometry (ICP-MS). Whereas in most cases the concentrations of a series of elements are determined in the bulk sample (often requiring a digestion upfront), the use of laser ablation (LA) in combination with ICP-MS allows further insight into an isotope of a given element within a sample, with the added benefit of avoiding labor intensive and contamination-prone digestion processes. LA-ICP-MS also allows the analysis of small samples with highly localized differences in trace elemental concentrations. Higher sensitivity and better interference removal using triple quadrupole instrumentation, as well as faster laser systems with specialized ablation cells enabling fast washout of material from individual laser pulses, has paved the way for new applications for LA-ICP-MS. The software supported recombination of data generated in a series of line scans covering the entire area of a sample. This was in conjunction with information on the laser position over time (using ablation rate, spot size, and stage movement velocity), allowing for the creation of a full image of elemental distributions in a sample. This is especially useful for biological samples, where the role of trace elements involved in biological processes is often unknown. This article will outline the principle of LA-ICP-MS for imaging applications, highlighting its potential to gain additional insights into the field of bioanalysis and metallomics. More specifically, the technique will be used to track the effect of environmental pollution on the distribution of heavy metals in the brain of a sentinel species in a highly urban area.
The qualitative and quantitative determination of trace elements is a stronghold of inductively coupled plasma–mass spectrometry (ICP-MS). Whereas in most cases the concentrations of a series of elements are determined in the bulk sample (often requiring a digestion upfront), the use of laser ablation (LA) in combination with ICP-MS allows further insight into an isotope of a given element within a sample, with the added benefit of avoiding labor intensive and contamination-prone digestion processes. LA-ICP-MS also allows the analysis of small samples with highly localized differences in trace elemental concentrations. Higher sensitivity and better interference removal using triple quadrupole instrumentation, as well as faster laser systems with specialized ablation cells enabling fast washout of material from individual laser pulses, has paved the way for new applications for LA-ICP-MS. The software supported recombination of data generated in a series of line scans covering the entire area of a sample. This was in conjunction with information on the laser position over time (using ablation rate, spot size, and stage movement velocity), allowing for the creation of a full image of elemental distributions in a sample. This is especially useful for biological samples, where the role of trace elements involved in biological processes is often unknown. This article will outline the principle of LA-ICP-MS for imaging applications, highlighting its potential to gain additional insights into the field of bioanalysis and metallomics. More specifically, the technique will be used to track the effect of environmental pollution on the distribution of heavy metals in the brain of a sentinel species in a highly urban area.
Metallomics takes an integrated approach to understanding the metallobiochemistry of cells and organisms in health and disease, utilizing analytical tools to elucidate the biological roles of metals in both space and time (1). In humans, every tenth protein depends on zinc for structure, catalysis, or regulation, and, together with other metal ions, every second protein contains a metal ion essential for its function. Most importantly, both the metal composition and the distribution in cells and tissues change during physiological and pathophysiological processes, with consequences in disease development, progression and treatment (2–4). Every cell utilizes a wide range of metal ions (such as sodium, potassium, magnesium, calcium, iron, molybdenum, manganese, zinc, and copper) and nonmetals (such as chloride, bromide, iodide, and selenium) in conjunction with the elemental building blocks of biological molecules (such as carbon, oxygen, nitrogen, hydrogen, sulfur, and phosphorus). Thus, depending on their specialized functions and activities, each type of cell has a unique metal ion composition or “metallome.” These attributes can be exploited to distinguish cells with altered characteristics (such as highly proliferative or malignant, diseased, or transitioning toward cell death through regulated or unregulated pathways), or senescent in a range of disease settings (such as dementia, diabetes, and cancer).
Prior to the development of elemental bioimaging achieved through coupling instrumentation, such as laser ablation to inductively coupled plasma–mass spectrometry (ICP-MS), metal analysis of biological samples largely consisted of bulk quantification and speciation approaches. However, it became clear that this bulk tissue concentration level information lacked the spatial resolution necessary to fully explore the roles of biological metals at the cellular and subcellular levels. Advancing our understanding of the role of biometals in fundamental biology and disease, therefore, required increased information on the spatial localization of metals in tissues, and this need has been met, to a large extent, through a number of elemental bioimaging techniques including, but not limited to, synchrotron X-ray spectroscopy, secondary ion mass spectrometry (SIMS), and LA-ICP-MS (5).
Materials and Methods
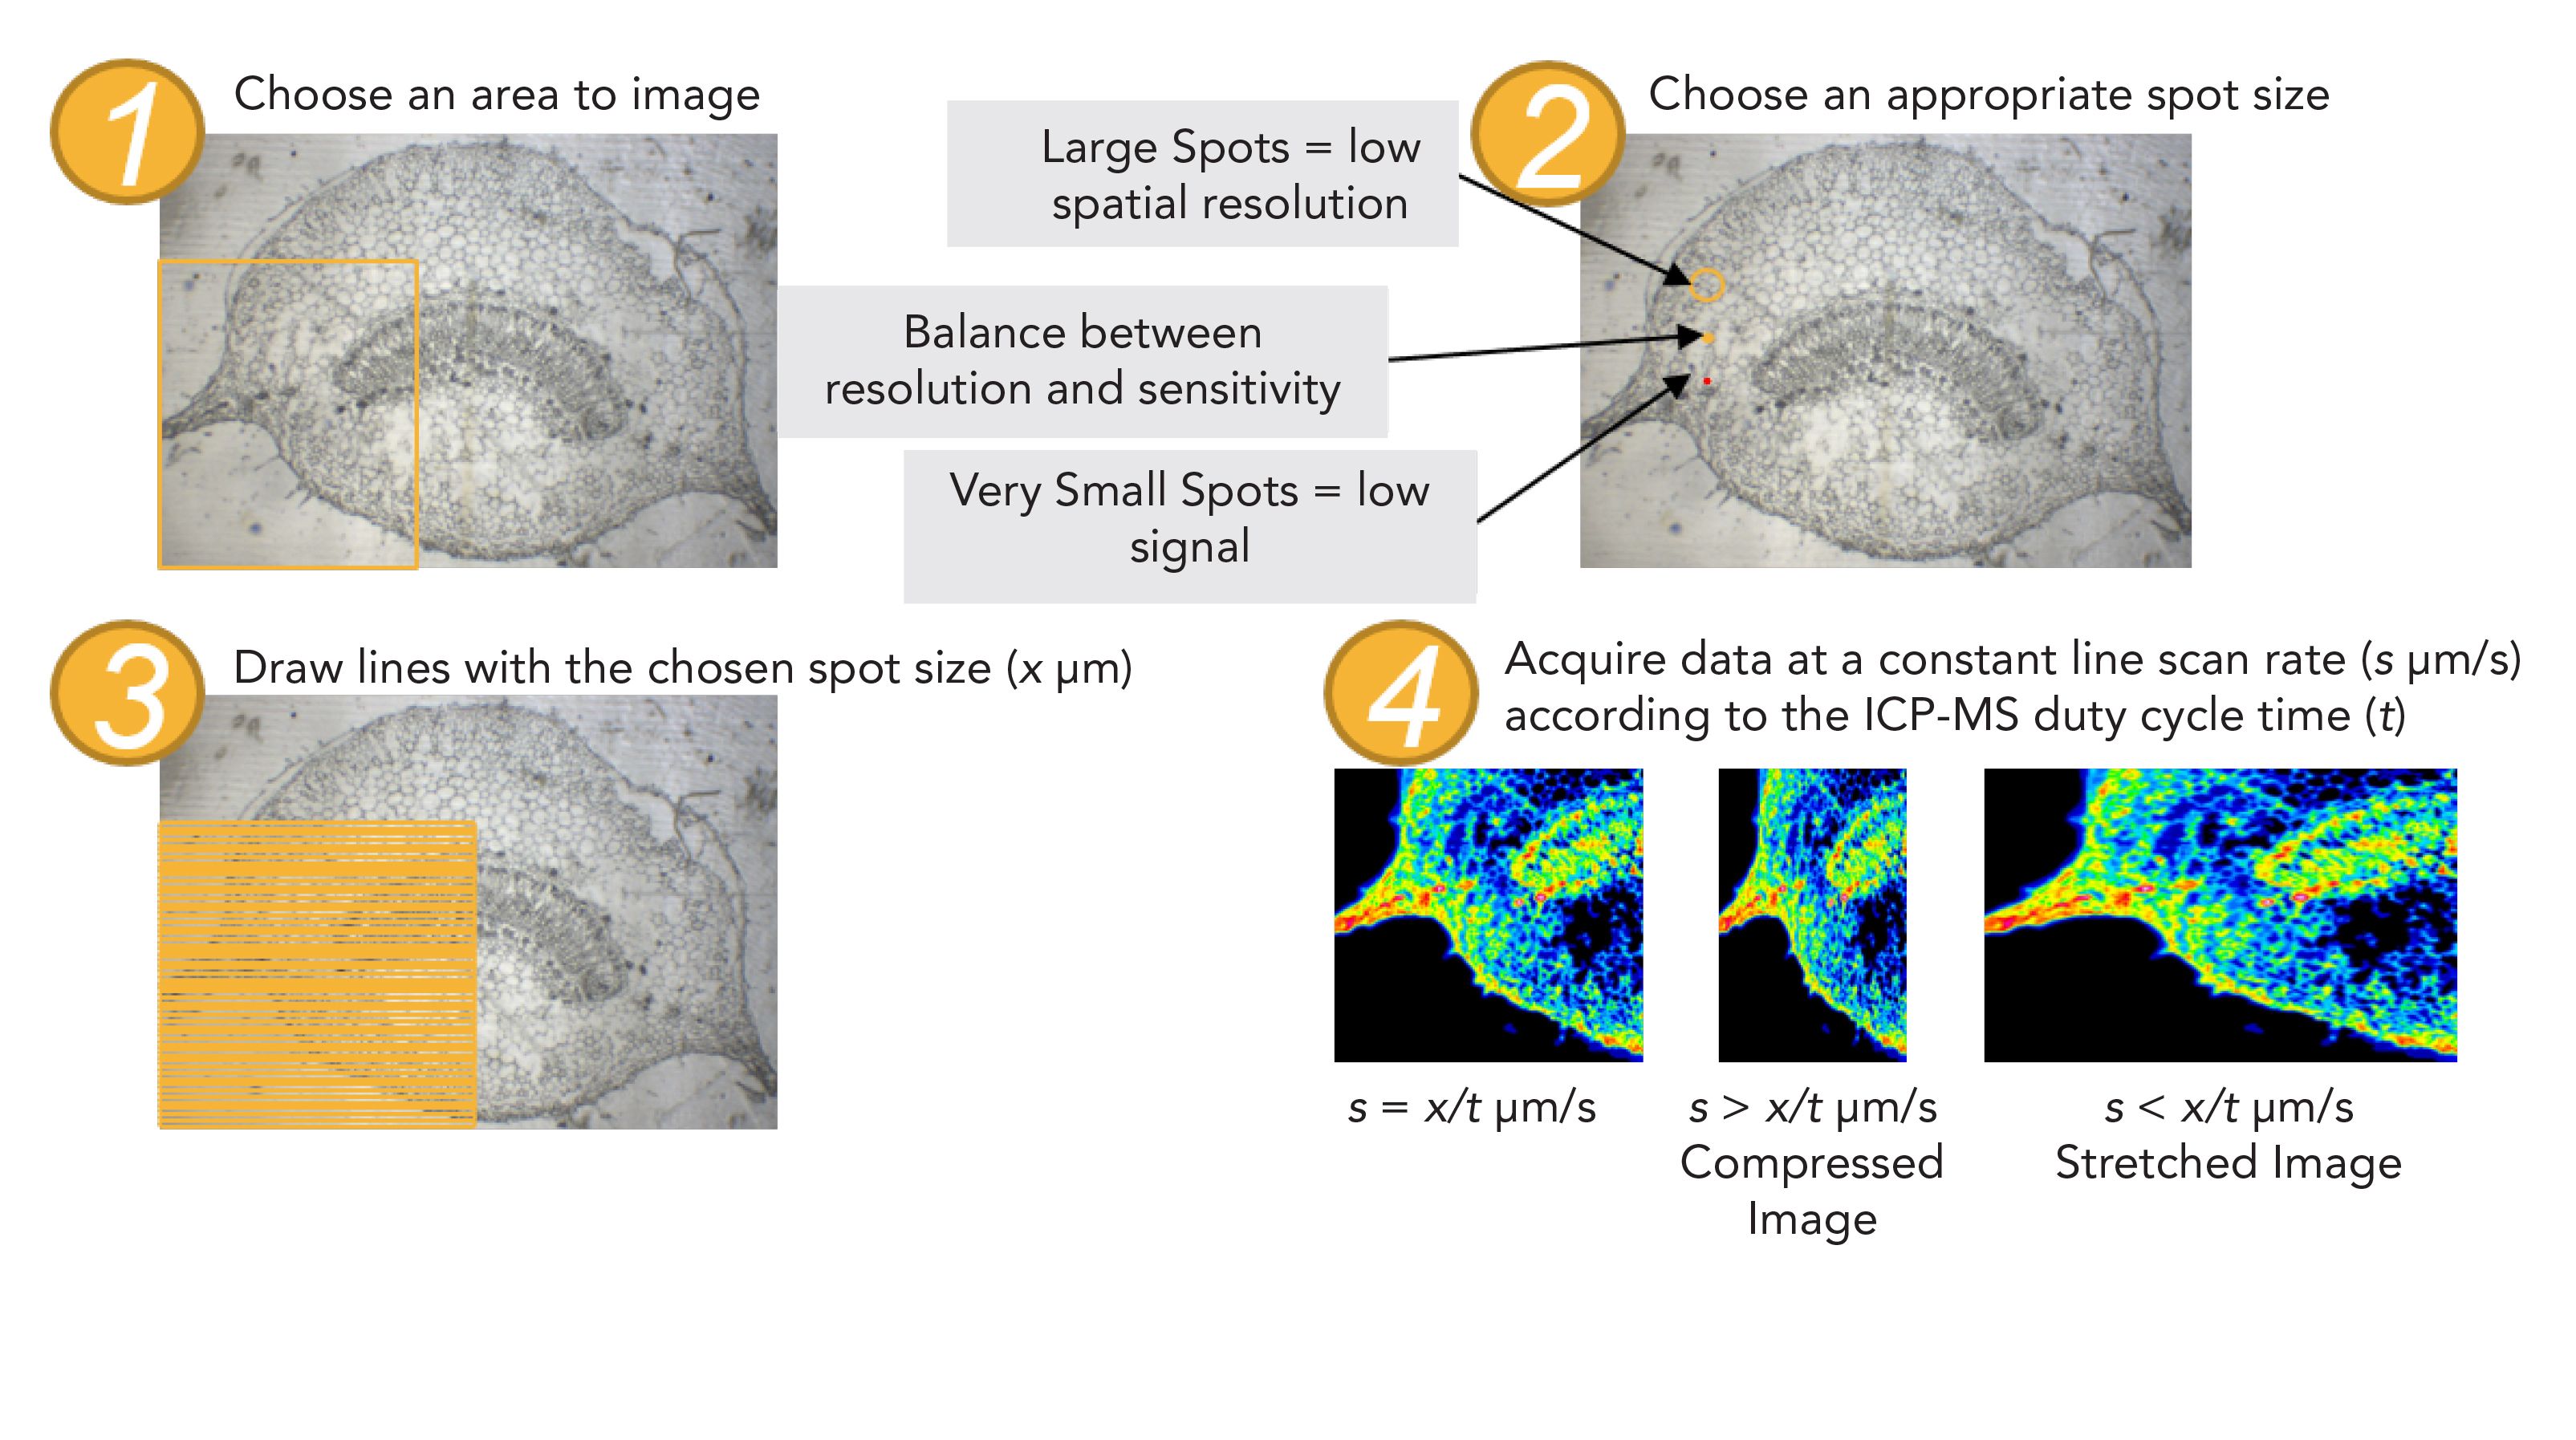
Elemental images or maps refer to an LA-ICP-MS analysis that provides information on the elemental distribution across a sample’s two-dimensional area. An example would be the surface of a biological tissue section. As the laser is fired at the sample surface, the sample is moved at a defined and constant rate. This process allows the time profile of a line scan to be translated into a distance profile. Gathering multiple profiles across the sample generates a 2D image of the elemental distribution in the sample (3D after the vertical reconstruction of sequential 2D image maps), where signal intensity is directly proportional to concentration. To avoid artifacts, the duty cycle of the ICP-MS instrument and the translation speed of the laser must be synchronized. Figure 1 highlights this process of image generation.
Figure 1: Procedure for image generation using LA-ICP-MS to avoid potential artifacts. Steps 1 through 4 are illustrated.

To image a given sample, a suitable area or region must be chosen through complementary imaging techniques such as classical histology or unstained microscopy images. Samples are typically provided for analysis as thin sections on microscopy slides. Depending on the sample type and level of structural preservation required, samples are either formalin-fixed paraffin-embedded (FFPE), or cryopreserved with or without embedding material. If an embedding medium is used, a material of suitable purity for trace elements must be selected to avoid unnecessarily high backgrounds.
To balance the analysis time versus image size, the spot size of the laser must be optimized. This parameter affects the spatial resolution of the image and the sensitivity and the speed of the analysis. Larger spot sizes ablate more material, and therefore allow a greater quantity of sample to reach the plasma while the image generation is achieved in a shorter time. Spot sizes of 10–25 µm can provide reasonable spatial resolution depending on tissue type and the biological questions posed. Smaller spot sizes (below 5 µm) provide superior cellular resolution, but require high sensitivity to obtain a signal-to-noise ratio (S/N) of 10, often used as a minimum for quantitative work. Subcellular resolution (below 1 µm) can be obtained through an approach called oversampling (6).
The correct choice of the laser wavelength and carrier gas is also important. A combination of a laser system in the deep ultraviolet (UV) range (such as 193 nm), in combination with helium as a carrier gas, often provides the best results. Several key comparative studies highlight the performance characteristics between 193, 213, and 266 nm laser systems (7–9).
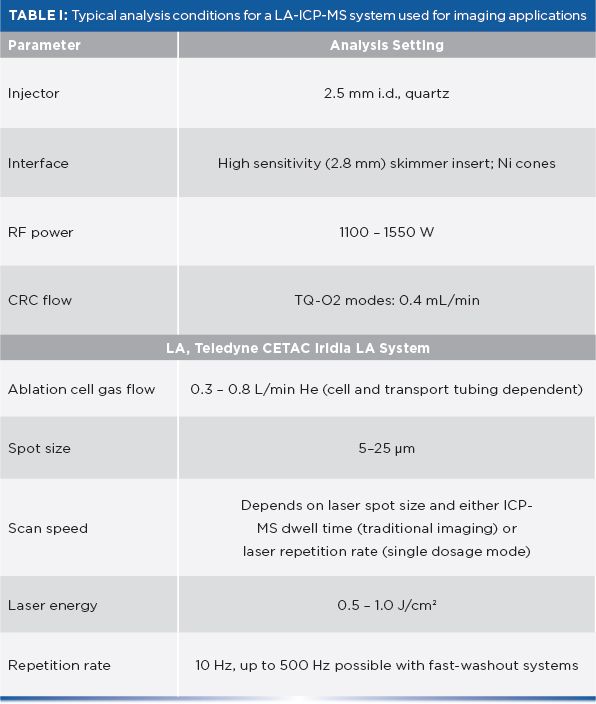
To obtain high-quality images with enough contrast to differentiate detailed structures, it is important that the ICP-MS system used for analysis provide high signal-to-noise ratios for the elements under study. This includes not only detection sensitivity, but also the complete suppression of interferences. Particularly important elements in metallomics studies, such as iron, manganese, copper, or zinc, may be significantly biased by polyatomic and other interferences, such as 40Ar16O+ (on 56Fe), 54Fe+ and 56Fe+ (on 55Mn), 40Ar23Na+ (on 63Cu) or 32S2+, 32S16O2+ on 64Zn. There is also growing interest in understanding nutrient metabolism, and imaging additional elements such as Se, P, and S, is again biased by significant polyatomic interferences. Complete removal of these interferences in combination with high detection sensitivity is often only achieved using triple quadrupole–based ICP-MS instruments. Typical conditions for analysis often are similar to those summarized in Table I.

Results
An increasing body of evidence has linked air pollution exposure to impacts on the brain, ranging from cognitive impairments in childhood (10) to increased incidence of dementia in the aged population (11). Metal dyshomeostasis has been implicated in a range of neurodegenerative disorders (12), and there is preliminary evidence linking these disorders to the accumulation of metals in the brains of dogs (13) and humans in highly polluted areas (14). Uncertainties remain, however, about how exogenous metals accumulate in the brain, with some evidence supporting the uptake of metal-rich nanoparticles by the olfactory neurons in the nose to the olfactory bulb region of the brain, and some speculation about particles that have reached the systemic circulation crossing the blood–brain barrier (13–14). Allowing for either uptake pathway, there is even less knowledge about how particles and particle-associated metals move through the parenchyma of the brain, or whether they accumulate. Studying these questions is challenging due to the requirement to address long-term accumulative processes and in the limited access to relevant material in the clinical setting.
To overcome this, the option of using animal sentinel species to determine metal concentrations and distributions within their brains was explored, focusing on urban populations with clear exposure contrasts to traffic-related air pollutants. This study focused on the use of the Eastern gray squirrel (Sciurus carolinensis), because these are routinely culled as part of population control efforts in London and throughout the United Kingdom. Therefore, they provide a unique resource to explore the impact of environmental pollution on long-term metal accumulation in the brain. In this article, preliminary data exploiting LA-ICP-MS to explore elemental patterns within the brains of squirrels collected from inner London (high pollution) and outer London (low pollution) are presented. Following culling, whole brains were removed by pathology technicians at the Zoological Society of London before being snap frozen. The frozen samples were then cyrosectioned at 20 mm thickness before air drying on glass microscopy slides prior to LA-ICP-MS at 40 mm resolution for 63Cu, 57Fe, and 208Pb, using 31P as a morphology indicator.
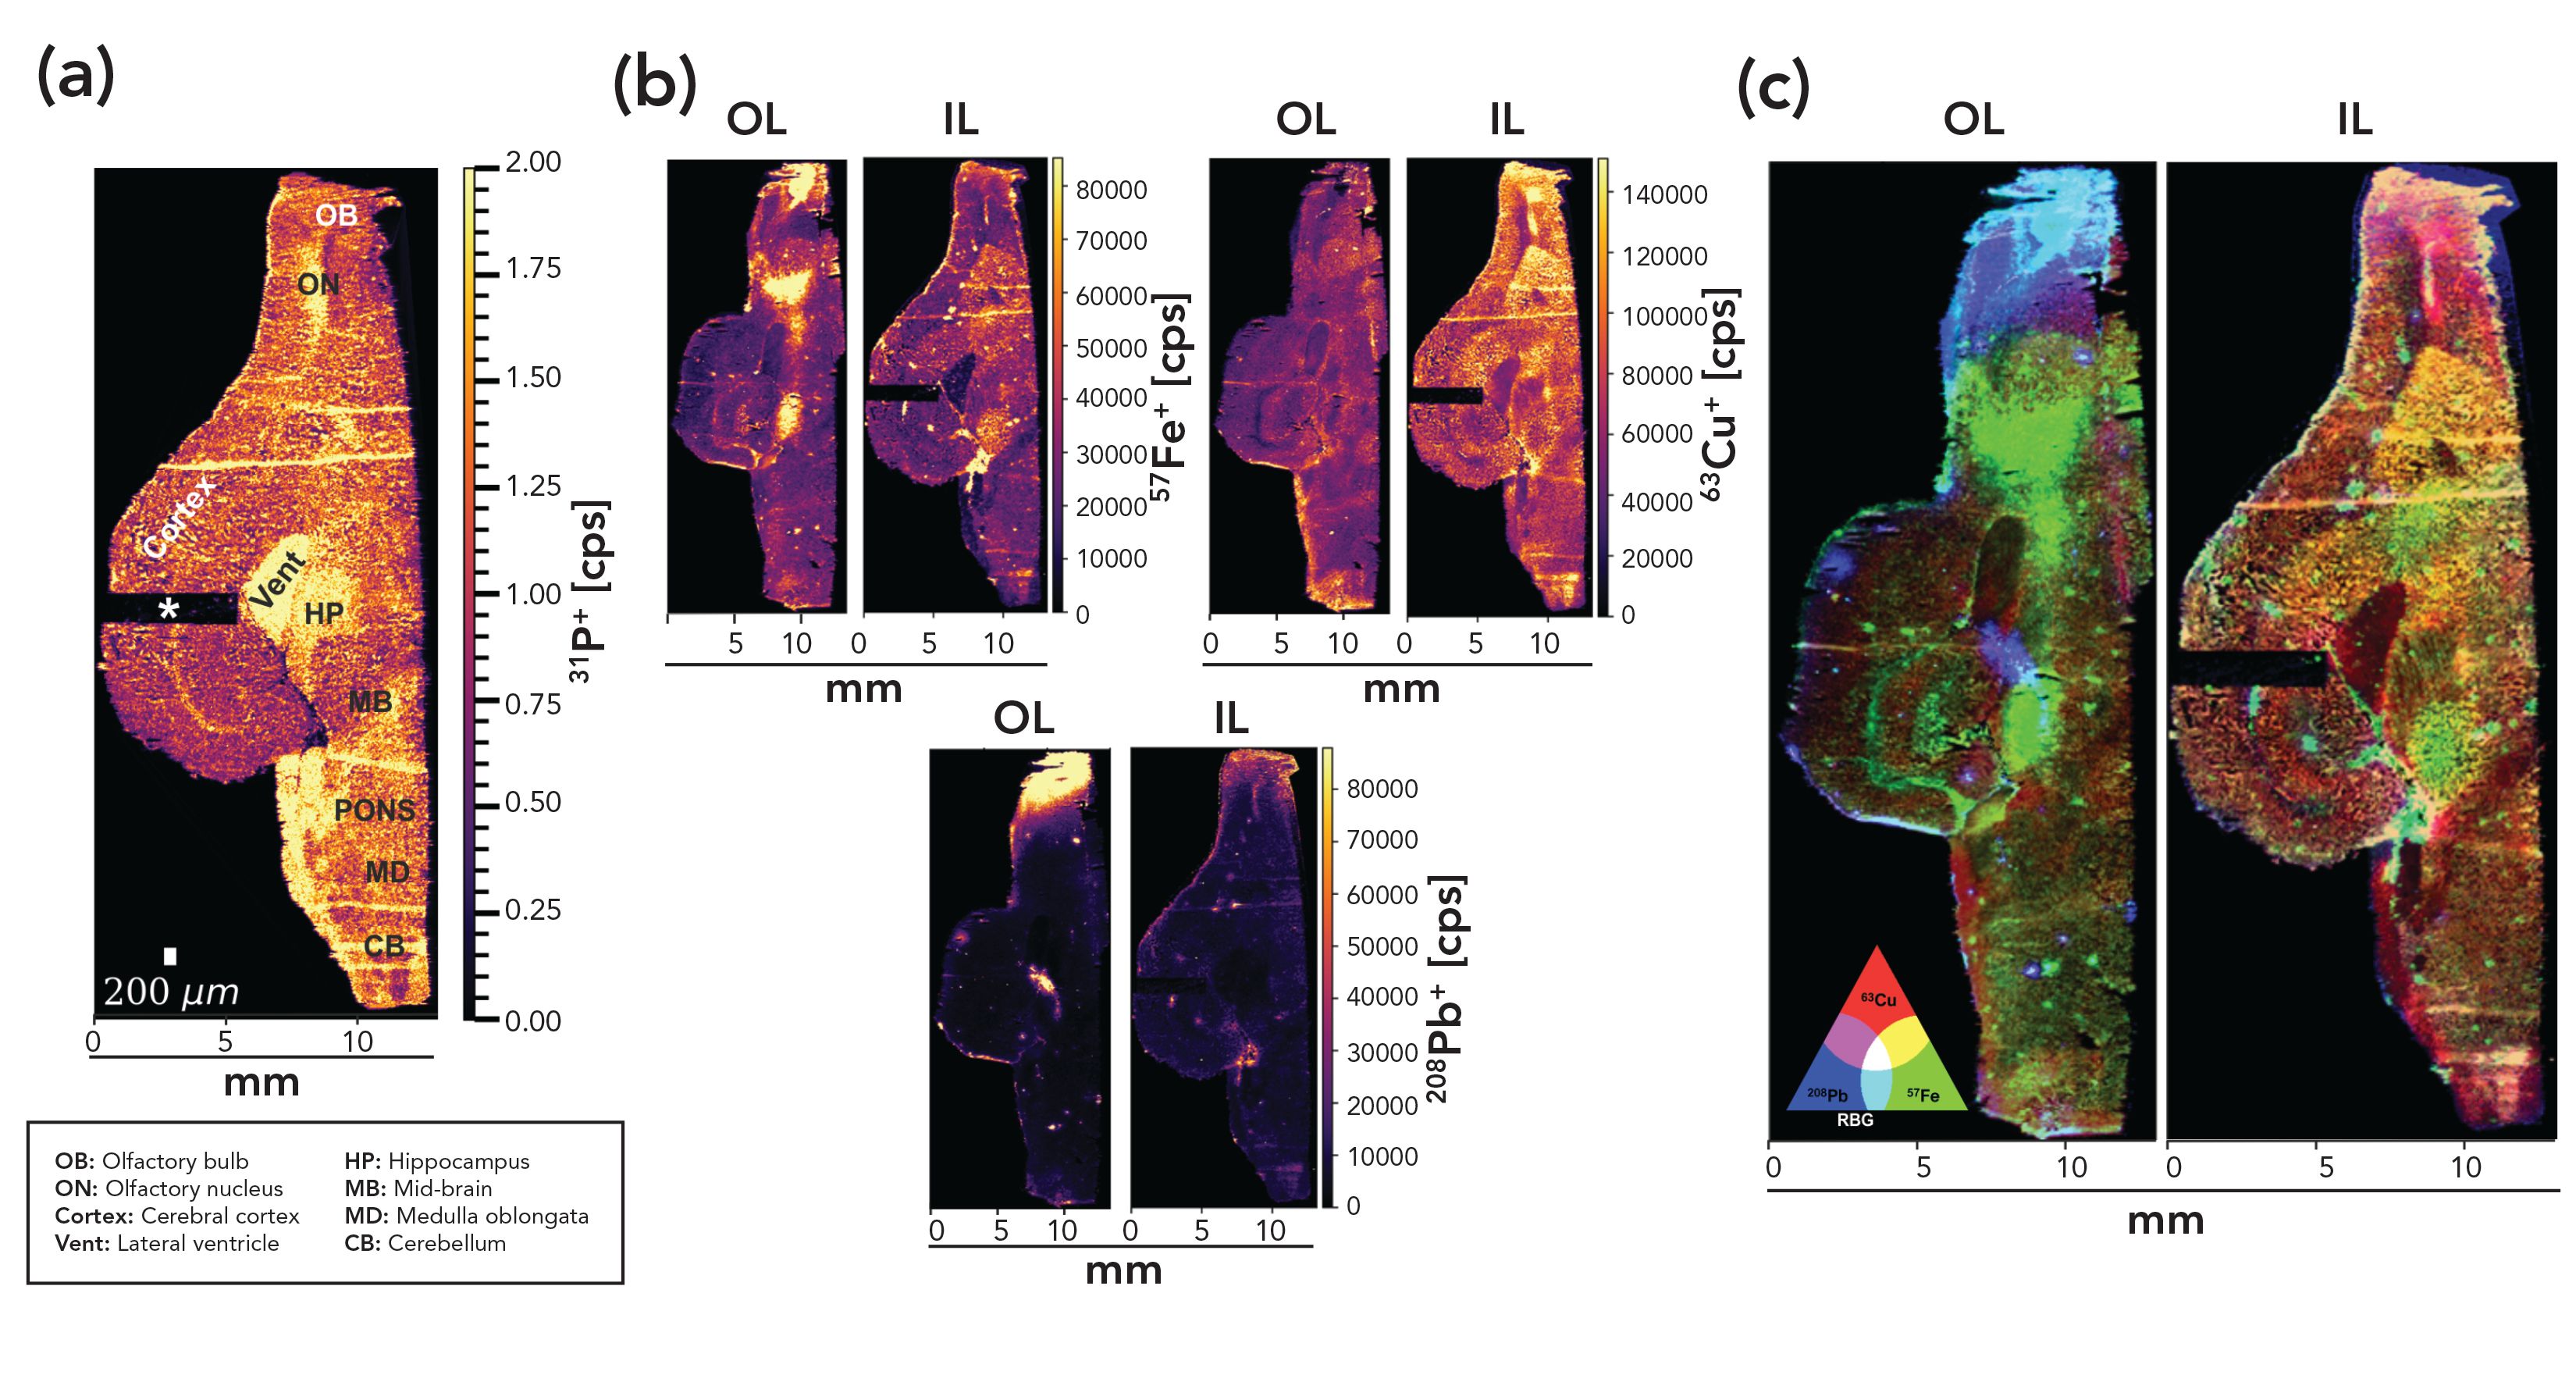
The representative images are presented in Figure 2. This data are preliminary, but clear contrasts are apparent in the spatial distribution of the selected elements between the low- and high-pollution sites (clearest in panel C). The data show that Cu (often associated with brake dust) is elevated in the olfactory bulb region of animals living in inner London whereas Pb appeared elevated in this brain region in the animals from outer London. Additionally, Cu concentrations appeared to be higher throughout the brains of the squirrels collected from inner London. Overall, Fe appeared higher in the outer London sample with evidence of high concentrations in the mid-brain region and clear high-intensity foci scattered throughout the parenchyma.
Figure 2: Laser Ablation ICP-MS images of an axial section of representative squirrel brains from inner London (IL) and outer London (OL) at a resolution of 40 μm. Panel (a) shows 31P concentrations from OL, used as a general morphological indicator, with the anatomical brain regions indicated. ‘*’ indicates an area that was used to optimize the ablation method. Panel (b) shows Cu, Fe and Pb concentrations. Panel (c) illustrates the combined elemental distribution in the samples.

As stated, these images at this time are simply indicative of the power of this technique to provide semiquantitative spatial data on metal concentrations within the brain, and it is planned to expand this work to a more comprehensive set of samples to complement our work using traditional ICP-MS analysis of digested samples from discrete brain regions. Ultimately, the power of these techniques requires that elemental maps be related to classical pathohistological examination of the tissues so that metal intensity can be correlated to markers of overt neurological disease, or, through the application of other multi-model analytical techniques, correlated to mechanistic pathways linking air pollutant exposure to disease initiation and progression.
Conclusions
LA-ICP-MS allows isotopic mapping of a range of elements in biological samples to be performed with high sensitivity and high resolution. One major caveat of LA-ICP-MS is its destructive nature, particularly when applied to biological samples. In contrast to its application in geology, where nanometer-thick layers can be removed from surfaces of hard materials, when applied to elemental bioimaging, it typically completely ablates and removes cells and tissues from their support substrates during the analysis.
The resolution that can now be achieved using LA-ICP-MS, particularly with oversampling approaches, is beginning to open up new applications in subcellular imaging (15), which is still highly dependent on cell size and the concentration of elements of interest. In the field of elemental bioimaging, rapid developments in laser hardware, affording smaller spot sizes and therefore higher-resolution mapping, now require the sensitivity to measure such small amounts of material. Depending on the type of ICP-MS (single quadrupole, triple quadrupole, sector field, time-of-flight), sensitivity may be a limiting factor to image endogenous metals at high resolution (such as 1 µm), especially when found in lower concentrations. However, particularly in metallomics, the power of this analytical technique lies in its incorporation into correlative multimodel imaging and molecular mass spectrometry workflows so that information relating to the chemical environment associated with specific elements is characterized and can be placed within the context of specific biological processes and their underlying mechanisms.
Acknowledgments
We would like to acknowledge Dr. Alexander Morrell and Maral Amrahli for their expertise and assistance in image processing at the London Metallomics Facility.
References
- W. Maret, Adv. Exp. Med. Biol. 1055, 1–20 (2018).
- Y. Zheng, X.K. Li, Y. Wang, and L. Cai, Hemoglobin. 32, 135–145 (2009).
- D. Riesop, A.V. Hirner, P. Rusch, and A. Bankfalvi, J. Cancer Res. Clin. Oncol. 1–11 (2015).
- W. Maret, Prev. Nutr. Food Sci. 22, 1–8 (2017).
- T.J. Stewart, Metallomics. 11, 29–49 (2019).
- S.J.M. Van Malderen, JT van Elteren, and F. Vanhaecke, Anal. Chem. 87(12), 6125–6132 (2015).
- M. Guillong, I. Horn, and D. Gunther, J. Anal. Atom. Spectrom. 18(10), 1224–1230 (2003).
- A. Vogel, and V. Venugopalan, Chem. Rev. 103(2), 577–644 (2003).
- T. Van Acker, S. Van Malderen, L. Colina-Vegas, R. Ramachandran, and F. Vanhaecke, J. Anal. At. Spectrom. 34(10), 1957–1964 (2019).
- C.J. Griffiths and I.S. Mudway, BMJ 363, k4904 (2018).
- R. Peters, et al., J. Alzheimers Dis. 70(s1), 145–163 (2019).
- C.E. Cicero, et al., Environ. Res.159(8), 2–94 (2017).
- L. Calderón Garcidueñas, et al., Toxicol. Pathol. 31(5), 524–538 (2003).
- B.A. Maher et al, Proc. Natl. Acad. Sci. USA. 113 (39), 10797–10801 (2016).
- T. Van Acker, T. Buckle, S.J.M. Van Malderen, et al., Anal. Chim. Acta. 1074, 43–53 (2019). doi:10.1016/j.aca.2019.04.064
Daniel Kutscher and Dhinesh Asogan are with Thermo Fisher Scientific, in Bremen, Germany. Ian Mudway is with the RC Centre for Environment and Health, at King's College London and Imperial College London, in the United Kingdom. Patricia Brekke and Matthew W. Perkins are with the Institute of Zoology Zoological Society of London, in the United Kingdom. Charlie Beales and Theodora J. Stewart are with the London Metallomics Facility of King’s College London and Imperial College London, in the United Kingdom. Xiaohan Wang is with King’s College London, in the United Kingdom. Wolfgang Maret is with the Department of Nutritional Sciences of King’s College London, in the United Kingdom. Direct correspondence to: daniel.kutscher@thermofisher.com •

Trending on Spectroscopy: The Top Content of 2024
December 30th 2024In 2024, we launched multiple content series, covered major conferences, presented two awards, and continued our monthly Analytically Speaking episodes. Below, you'll find a selection of the most popular content from Spectroscopy over the past year.
Best of the Week: Hyperspectral Imaging, ICP-MS Analysis of Geological Samples, Product Roundup
October 18th 2024Top articles published this week include an article about hyperspectral imaging in human skin research, a peer-reviewed article about analyzing geological samples using atomic spectroscopy techniques, and an equipment roundup piece about the latest products in the industry.