Interpreting Raman Spectra of Functionalized Polymers: Applying the Tricks of the Trade
The interpretation of Raman spectra is discussed for a series of functionalized celluloses.

In several of my earlier columns I discussed the interpretation of Raman spectra. This column continues that theme, examining the spectra of a series of functionalized celluloses. It is interesting to see what is consistent from material to material, and what is different. In particular, it is useful to identify marker bands for the various functional groups. In addition, when identifying an unknown, it is important to identify a collection of functional group bands that would all be present when that functional group is part of a molecule.
Cellulose is a polymer of glucose whose functional unit has been recently identified as anhydrocellobiose, a glucose dimer with the β-1,4 linkage between all glucose units (1,2). Actually, it has taken more than 30 years to understand the structure of cellulose by applying a combination of techniques, including chemical analysis, X-ray diffraction, electron diffraction, and nuclear magnetic resonance (NMR), Fourier transform infrared (FT-IR), and Raman spectroscopies. Because the symmetry of the cellulose molecule is quite low, prediction of vibrational group frequencies is not straightforward. As a result of systematic studies, however, the structure of the various crystalline forms of cellulose is now established and the Raman bands have been assigned.
According to Atalla (1,2) there are essentially five regions in the fingerprint range of the spectra with spectral bands that can be assigned to particular types of motion. Between ~1200 and 1400 cm-1, the bands correspond to methine bending, methylene rock and wag, and C–O–H in-plane bending. Between ~1000 and 1200 cm-1, there are ring bond stretches and C–O stretches. The angle bends (CCC, OCC, COC, OCO), ring and C–O stretches, and methylene bending appear between 700 and 800 cm-1. Between ~400 and 600 cm-1 are the heavy atom bending, C–O and ring bending, and some ring stretching. And between 200 and 400 cm-1 are ring torsions. Any cellulose derivative will still have bands composed of these motions; in addition, there will be extra bands, resulting from additional functional groups, as well as modifications to the cellulose bands themselves, depending on details of how the extra functional groups interact with the cellulose chains and their packing.

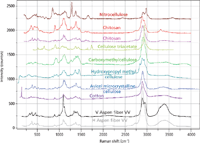
Figure 1: Raman spectra of cellulose and a set of cellulose derivatives. From bottom to top: aspen fiber oriented horizontally with laser and Raman polarization perpendicular to the fiber, aspen fiber oriented vertically with laser and Raman polarization parallel to the fiber, cotton fiber, Avicel microcrystalline cellulose, hydroxypropyl methylcellulose, carboxymethylcellulose, cellulose triacetate, chitosan (2Ã), and nitrocellulose.
Figure 1 shows polarized spectra of purified cellulose fibers from the aspen tree, cotton, microcrystalline cellulose (MCC), hydroxypropylmethylcellulose (HPMC), carboxymethylcellulose (CMC), cellulose triacetate (CTA), chitosan, and nitrocellulose (NC). In the CH stretching region, one can assign the band near 2900 cm-1 to the five methine CH groups and the one methylene group; a broad OH band centered at 3400 cm-1 with a polarization-dependent shoulder near 3300 cm-1 is assigned to the heavily H-bonded OH stretch. When some or all of the OH groups are replaced — for instance by NH2 groups (in chitosan) or acetyl groups (in cellulose triacetate) — clearly some or all of the OH band intensities will disappear. The chain packing depends in detail on the H bonding (1,2), so how much of a change the loss in OH groups will have on the fingerprint region will depend on how much the cellulose chain is modified by the chemical substitution. For the case of chitosan, the fingerprint spectrum is surprisingly similar to that of cellulose. For acetylated cellulose, the details of the pattern change significantly, but the regions defined in the previous paragraph are still present. We also show a spectrum of nitrocellulose where most of the OH groups have been replaced by O–NO2 groups. In the fingerprint region there are three extra bands of fairly high intensity that we will be able to assign to the nitro groups.
Just one word about crystalline form: As David Tuschel and I have noted in past columns, the information revealed by Raman spectra can be quite enlightening as to the crystal state of organic as well as inorganic materials. But for the sake of this column, I am going to ignore the subtle differences between the crystal forms of a given polymer and will focus instead on the chemical differences.
Spectra
Now we will examine the spectra in Figure 1 in more detail. The bottom two spectra are of a fiber of aspen wood that was treated chemically to remove the lignin and hemicelluloses (samples from Prof. Atalla, Cellulose Sciences International). These spectra represent polarized spectra of a fiber oriented perpendicularly (bottom trace) and parallel (second spectrum from the bottom) to the polarization direction of the laser and Raman light. Clear effects of the molecular orientation can be seen. The third spectrum from the bottom is that of a cotton fiber. Cotton provides a source of pure cellulose, and is also oriented, but the molecular orientation in the cotton fiber may not be quite the same as in the wood fiber. In addition, note that there is a strong band near 142 cm-1in the spectrum of cotton that is assigned to TiO2 (anatase) and presumably has been added for white pigmentation. The next spectrum up is that of microcrystalline cellulose, and it does not differ very much from the previous spectra, except perhaps for relative intensities.

Table I: CH bands of Raman spectra for saturated organics
The fifth spectrum from the bottom is hydroxypropyl methylcellulose. Hydroxypropyl methylcellulose is a cellulose in which some of the hydroxyl groups have been substituted with methyl (CH3) or hydroxypropyl (CH2CHOHCH3) side groups. Since the original cellulose is dominated by methine CH groups (five methine protons to two methylene protons), there is now the possibility to identify the additional methylene CH2 and the methyl CH3 groups in the spectra. What is interesting about this material is that the placement and degree of substitution can be quite variable, and there are many proprietary formulations designed for specific physical and chemical properties such as dissolution, gelling capability, viscosity, and water retention, that have application in a variety of industries (3). If one looks at the Raman spectrum in the CH region (<3000 cm-1) of saturated organics, it is possible to separate the CH contributions from the ring methine and the methylene and methyl stretches (Table I).

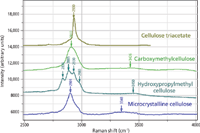
Figure 2 (a): Raman spectra in the CH/OH region.
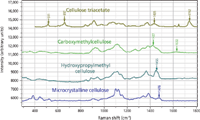
Figure 2 shows the spectra of microcrystalline cellulose, hydroxypropyl methylcellulose, carboxymethylcellulose, and cellulose triacetate to focus better on their differences. In Figure 2a, even without band-fitting, three peaks and a shoulder can be clearly identified in the CH envelope of the hydroxypropyl methylcellulose, even though microcrystalline cellulose has only one band, with a small shoulder. Clearly careful band-fitting would enable one to extract information about the composition of hydroxypropyl methylcellulose (the amount of hydroxylpropyl and methyl substitution). In the fingerprint region (Figure 2b), there is also enhanced intensity at 1455 cm-1, the region where CH2 and CH3 groups exhibit deformation bands.

Figure 2 (b): Raman spectra in the fingerprint region of (from bottom to top) microcrystalline cellulose, hydroxypropyl methylcellulose, carboxymethylcellulose, and cellulose triacetate.
Above the spectrum of hydroxypropyl methylcellulose is the spectrum of carboxymethylcellulose. In this case it appears that the substituted functional group — CH2COOH — has added a certain degree of disorder to the material because the spectral bands, including the CH envelope, are all broadened. However, as in the hydroxypropyl methylcellulose, there is some evidence for OH groups. In the fingerprint region, in addition to the increased intensity in the region of CH2 deformations (1427 cm-1) there is a broad feature at about 1630 cm-1 that can be assigned to the carboxylate group.
The next spectrum up in Figures 1 and 2 is that of cellulose triacetate, derived from cellulose (sample from Herman Noether). We expected to see a carbonyl group from the acetate (-CH3CO) substitution, and the band at 1742 cm-1 confirms this expectation. The CH region is interesting. Superimposed on the broad methine CH near 2900 cm-1 is a sharp band at 2930 cm-1 that is assigned to the methyl CH groups. If you want to rationalize the relative intensities, note that there are five methine and two methylene CH groups on each ring, and nine methyl CH groups on the substitutions (for three acetate groups). The methyl peak dominates in this region because it is so sharp and there are almost twice as many methyl protons than the sum of the others. In the lower part of the fingerprint region there are extra features that should involve deformations of the carbonyl group.
This leaves two more substituted celluloses to discuss — chitosan and nitrocellulose. Chitosan is derived from chitin, which can be extracted from the exoskeleton of arthropods (crustaceans and insects) and fungi cell walls as well as from some other marine sources. Chitin is synthesized from N-acetyl glucose amine in the same β-1,4 linkage seen in cellulose; note that at the 2 position is an acetyl amine without an O atom linking to the ring. Chitosan is made by deacetylating chitin, often in aqueous solution with excess sodium hydroxide. As much as 60–100% of the final product is deactylated. Chitosan is water soluble, biocompatible, and biodegradable, enabling many biomedical applications.
The spectrum of chitosan is shown in the second and third traces from the top of Figure 1. What is surprising is how similar the spectrum is to cellulose, especially in the fingerprint region. In fact, the first time I recorded the spectrum of chitosan I did not know what it was and went to Wikipedia to find out. I was surprised to find that it is a cellulose derivative, with substitution of the OH groups for NH2 groups, which apparently does not disrupt the molecular backbone conformation. I contacted Prof. Atalla, who told me that he did look at chitosan at one point and found that, in fact, the NH2 substitution did not really perturb the lattice, confirming what we observed. But there is a low-intensity doublet at about 1605 and 1660 cm-1 that we assign to the scissoring NH2 motion. At frequencies greater than 3000 cm-1, there are some changes, as one would expect when substituting NH2 groups for OH groups. Two spectra of chitosan particles are shown, because in examining this sample (the history of which was not known to us) we observed some characteristic differences, which, upon comparison with the aspen fiber, may indicate differences in orientation.
The top spectrum in Figure 1 is that of nitrocellulose, an important energetic material used in munitions products, as well as a component, together with camphor, of celluloid, which was widely used in the past in photography and in the movie industry. There is considerable interest in industry today for a simple method to measure the degree of nitration of these products. At first glance the spectrum looks quite different from that of cellulose. But we note that the extra bands occurring in the fingerprint region (at 1655, 1283, and 847 cm-1) can be assigned respectively to the asymmetric NO2 stretch, the symmetric NO2 stretch, and the NO stretch. The CH region, however, does present a puzzle. The lower-frequency band near 2904 cm-1 closely matches the prominent band of cellulose. A question remains about what is causing the second band at 2979 cm-1, and I am afraid that I am currently unable to say.
Interpretation
The assignments I use in this article are based on my readings of the standard textbooks on IR and Raman spectroscopy. For this work I referred to the books by Socrates (4) and Mayo and colleagues (5). There is a community of spectroscopists who understand this well and can look at an unknown spectrum and identify the molecule that gave rise to the spectrum. Unfortunately this is an art that is no longer being taught in graduate programs. On the other hand, scientists who work in laboratories providing analytical services are required or expected to produce this type of information, especially in an industrial environment where product quality and deliverables depend on information. For this reason many laboratories are acquiring spectral libraries and software to search those libraries to identify unknowns. Experienced researchers who use these capabilities express caution, but spectral searching can be useful. We have recently been trained in the use of Bio-Rad's Know-It-All informatics software (6). This system includes many capabilities in addition to a searching facility. In particular, the AnalyzeIt Raman feature provides functional group analysis. When a user clicks on a peak, the software suggests which functional groups could account for that peak. Then the user is able to select a set of chemical types that could include the functional group identified. For each chemical type spectral behavior is displayed, and the user can then find the closest match to the spectral behavior of her unknown. The software also allows one to construct a chemical structure that can be included in the final report.
I do not mean to imply that implementing these approaches will be easy for a novice, but with the right resources (time and equipment) it can be accomplished. I may sound like an expert, but my formal training was not in chemistry, and the reality is that I have difficulty connecting the names of molecules and functional groups with their structures. But the information is readily available now. If I am sorting through a problem and need to know what an acetyl group is (as I did this morning), I do a Google search and almost always end up in Wikipedia with a satisfactory explanation.
Why am I telling you my story? Technology is moving rapidly, and we all need skills to find a place for ourselves. Raman spectra can provide analytical information, but there are skills required to get at that information. In this column, I have selected a set of cellulose derivatives to illustrate the skills that analysts will need. I hope that this discussion has been useful and that you are encouraged to dive in.
Fran Adar is the Worldwide Raman Applications Manager for Horiba Jobin Yvon (Edison, New Jersey). She can be reached by e-mail at fran.adar@horiba.com.

Fran Adar
References
(1) R.H. Atalla, in Comprehensive Natural Products Chemistry: Carbohydrates and their Derivatives Including Tannins, Cellulose and Related Lignins, Vol. 3, B.M. Pinto, Ed. (Elsevier, Amsterdam, 1999), Chapter 3.16.
(2) R.H. Atalla and A. Isogai, in Comprehensive Natural Products II: Chemistry and Biology, L. Mander, Ed. (Elsevier, Oxford, 2010), Chapter 6.16.
(3) Support for this comment comes from http://en.wikipedia.org/wiki/Hypromellose. Other information on the chemistry and applications of these materials is derived from other pages in Wikipedia.
(4) G. Socrates, Infrared and Raman Characteristic Group Frequencies, 3rd Edition (John Wiley and Sons, Chichester, 2001).
(5) D.W. Mayo, F.A. Miller, and R.W. Hannah, Course Notes on the Interpretation of Infrared and Raman Spectra (Wiley-Interscience, Hoboken,New Jersey, 2004).
(6) KnowItAll, Bio-Rad Laboratories, Inc. Philadelphia, Pennsylvania.

A Proposal for the Origin of the Near-Ubiquitous Fluorescence in Raman Spectra
February 14th 2025In this column, I describe what I believe may be the origin of this fluorescence emission and support my conjecture with some measurements of polycyclic aromatic hydrocarbons (PAHs). Understanding the origin of these interfering backgrounds may enable you to design experiments with less interference, avoid the laser illuminations that make things worse, or both.
Raman Microscopy for Characterizing Defects in SiC
January 2nd 2025Because there is a different Raman signature for each of the polymorphs as well as the contaminants, Raman microscopy is an ideal tool for analyzing the structure of these materials as well as identifying possible contaminants that would also interfere with performance.