Measurement of the Temperature Dependence of Water Using a Near-Infrared Raman Spectrograph
The spectral behavior of water is studied using Raman with an NIR spectrograph and dual wavelength lasers for measurements of both the fingerprint and the OH stretching regions. Raman spectra are recorded between 5 ⁰C and 80 ⁰C, and treated with both band-fitting and the 2D-COS algorithm revealing improved insights into the spectral behavior of water.
The Raman spectrum of water measured on a fixed grating near-infrared (NIR) spectrograph with a dual wavelength laser enables recording the signal in both the fingerprint and the OH stretching region. This article will show spectra recorded between 5 °C and 80 °C, and treated with both band-fitting and the 2D-COS algorithm. The results will show the complementarity of the two data treatments in providing different insights to the spectral behavior.
The Raman spectrum of deionized water was recorded at temperatures between 4 °C and 80 °C in a near-infrared (NIR) Raman spectrograph (MacroRam), which is designed around a fixed grating spectrograph and a 785 nm laser. When the Raman spectrum is dominated with broad overlapping bands, it often becomes difficult to use the spectrum for structural analysis. In this case, we will examine the behavior of the spectrum of water as a function of temperature between 4 °C and 80 °C. In principle, there should be an HOH deformation, and symmetric and antisymmetric combinations of the motions of the two OH functional groups. In the liquid phase, while the deformation near 1640 cm-1 appears to be a single band, the spectrum in the OH stretching region (3000 to 3700 cm-1) is clearly composed of more than two bands. The assumption is that there are complicated effects of H-bonding in the OH-stretching region that can account for this behavior. Our goal here was to determine what structural insight could be gained by comparing band-fitting with 2D-COS analysis. Because the OH stretching vibration is beyond the range of the detector with this excitation wavelength, we used the dual wavelength laser from IPS (1). The OH region of the spectrum (3000 to 3800 cm-1) was excited at 680 nm, which places the spectrum at the same wavelength range as the fingerprint part of the spectrum excited at 785 nm. Thus, by using the 680 nm laser line, one gets good sensitivity, even in the OH region of the spectrum. Figure 1 shows the full spectrum of water recorded with this laser at 4 °C and 70 °C. The laser was delivered with a fiber optic, and the Raman light was collected with a fiber bundle. Because there was no effort to make polarization measurements, the spectra reflect the isotropic component.
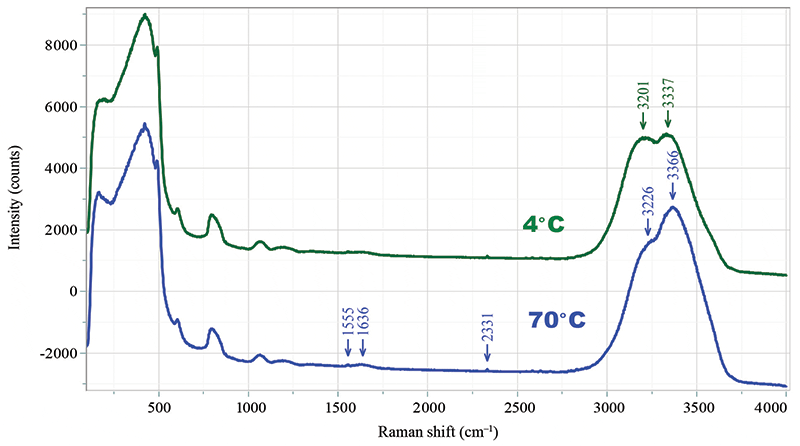
Figure 1: The full Raman spectrum of di-ionized water recorded on an NIR Raman spectrograph with a dual wavelength (785/680 nm) laser.
The Raman spectrum of water has been studied by several groups as a means to understand the structure of water as a function of temperature, in the context of the H-bonding (2,3). In our measurements, the entire spectrum below 1300 cm-1 is dominated by the bands of the silica cuvette. In the midrange of the spectrum, one can see the O2 and N2 dissolved in the water at 1556 and 2331 cm-1, as well as the HOH bend at ~1640 cm-1. While there are water bands of interest in the region dominated by the silica (3), we are going to focus on the OH stretching bands above 2900 cm-1.
Temperature Dependence of the Water Spectrum
In the past, I have done temperature-dependent studies of proteins dissolved in water buffer, and observed the important changes with temperature, which can be seen in Figure 2. At first glance, one assumes that the OH envelope can be fit by two bands, but closer inspection indicates that there is more going on. Attempts to fit the spectra to two bands never yielded good fits, as shown in Figure 2; the figure also shows five-band fits, which produced absolutely flat residuals in the spectra. Note that others have also fit the OH spectra to five bands (2).
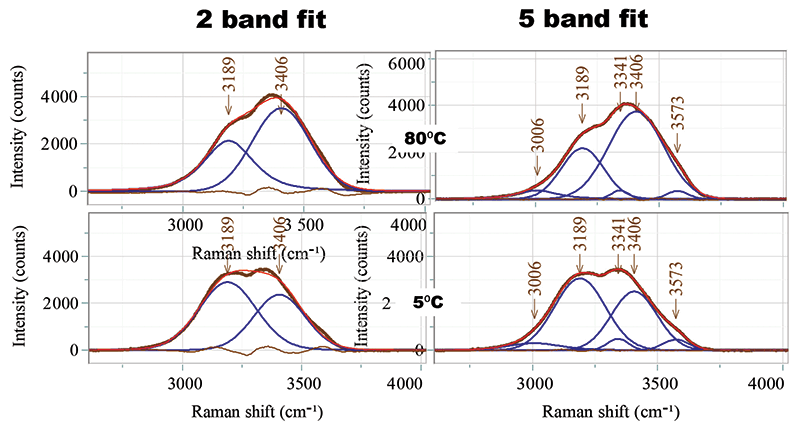
Figure 2: Spectral fits of the OH spectra of water at 80 °C and 5 °C. On the left are shown two-band fits with significant residuals displayed in purple. On the right are five-band fits with vanishing residuals.
Figure 3 shows the spectra taken as a function of decreasing temperature. On the right side is the integrated intensity between the cursors shown in the spectral multifile. However, after band-fitting the entire hyperspectral cube shown in Figure 3, we can plot the peak position, the integrated intensity, and the peak width as a function of time (which means temperature because the sample was cooling), and that behavior is shown in Figure 4.
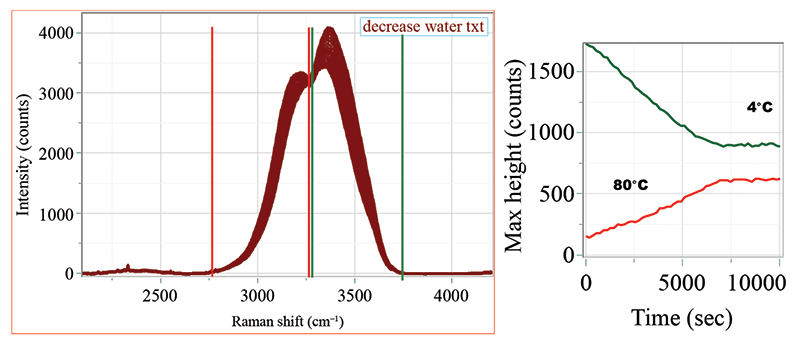
Figure 3: Spectra of water in the OH stretching region (on the left) taken as a function of time while cooling from 80 °C to 4 °C. The vertical red and green lines indicate the brackets used to calculate the integrated intensities. On the right is shown the integrated intensities as a function of time and temperature.
Temperature-Dependence of the Fitted Bands
Figure 4 shows the results of the band-fitting of the entire file. A total of five peaks were used for the fitting. In addition to the strong peaks near 3200 and 3400 cm-1, peaks were added on the low side, on the high side, and one between the two strong bands. The peak positions were fixed during the fitting procedure. The integrated intensities of the strongest peaks near 3200 and 3400 cm-1 are changing in opposite directions, which is consistent with what is seen in Figure 3. The widths of the middle band (~3340 cm-1 in purple) and the high band (~3580 cm-1 in yellow) are both about 100 cm-1, considerably sharper than the other bands, although their behavior with temperature are somewhat different. The width of the lowest frequency band (blue) has almost the same width as the strong bands, but it increased as the sample was cooled.
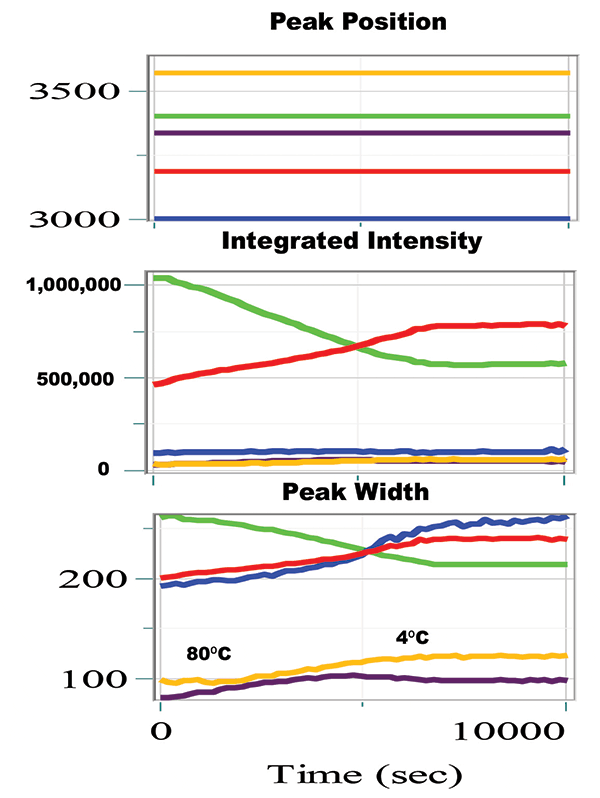
Figure 4: The peak position, integrated intensity in each peak, and the peak width as a function of time and temperature.
MCR Analysis
Another method of analysis that is possible is to subject the hyperspectral cube with temperature dependence to multiplicative curve resolution (MCR), something that was done in the cited publication (2). Figure 5 shows the results of this calculation, but doesn't seem to offer any insight. The two factors identified are very close to the cold spectrum (red) and the warm spectrum (green), and the addition of a third factor did not produce an additional independent spectrum. Because the spectra were acquired while cooling, the cold spectrum increases as the warm spectrum decreases.
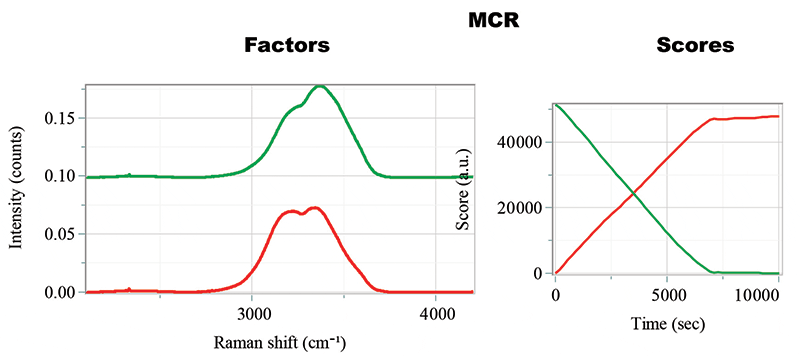
Figure 5: Factors and Scores from the MCR calculation.
2D-COS Analysis
Because spectral fitting is an "art", and in particular that the fits are often not unique, when these spectra are fit more than once, there is some variation in the results (in fact, that is why the fitting shown in Figure 4 was done by fixing the peak positions). For this reason I felt that implementing 2D-COS might be a more rigorous technique, so I was optimistic that applying 2D-COS to this set of measurements might provide a more "accurate" reflection of the behavior of the various overlapping features in the spectra.
What will the 2D-COS show us in comparison? Figure 6 shows the results of the 2D-COS application to this set of measurements. The synchronous and asynchronous plots are shown with four sets of intensity scales. The reason for this is that I only observe two peaks in the 2D-COS plots; one peak is center at 3114 cm-1, and the second at 3460 cm-1, neither of which overlays with the peaks in the band-fitted spectra. I was surprised that I did not see a correspondence with fitted spectra, so I used multiple plots to determine what was "hidden" in the results. In fact, changing the scale for plotting did not reveal any new structure. But I was able to accurately determine the centers of the 2D-COS structures, and determine if they corresponded to peaks in the original spectra.
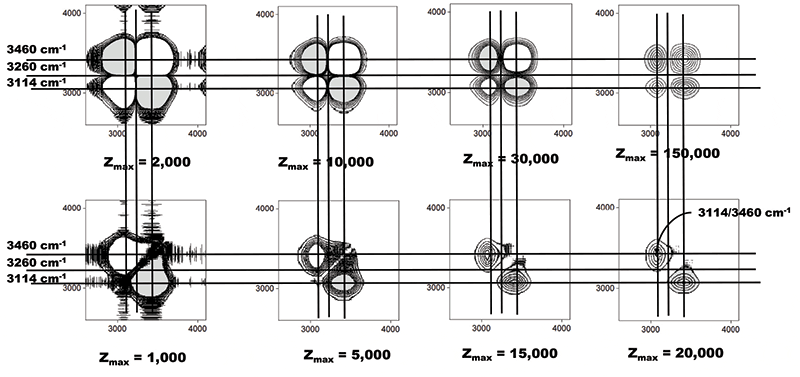
Figure 6: 2D-COS of the OH stretching part of the water spectrum, displayed with varying intensity scales. Synchronous plots on top, and asynchronous on the bottom.
Figure 7 shows the 2D-COS results plotted along with the 5 °C and 80 °C fitted spectra, in order to determine more detail in the results. What we find is that the center of the 2D-COS higher frequency structure is at 3460 cm-1 which is shifted from the higher frequency strong band in the spectra at 3406 cm-1. The lower frequency structure is peaked near 3114 cm-1, which is shifted from the lower frequency strong band at 3189 cm-1.
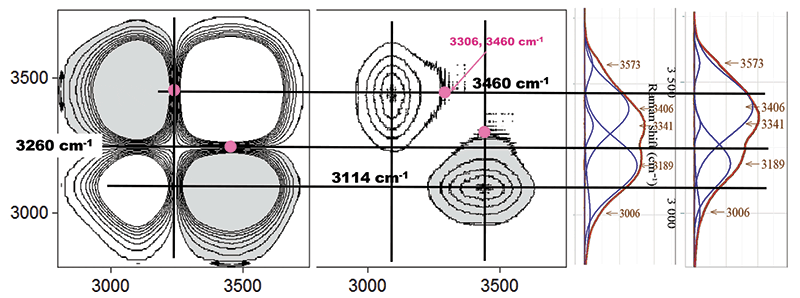
Figure 7: 2D-COS results enlarged and superimposed on the 4 °C and 80 °C band-fitted spectra.
How do we make sense of the 2D-COS results compared to the band-fitted results? The important fact to keep in mind is that the 2D-COS is sensitive to anything in the spectrum that is changing, while the band-fitting reports bands whether they are changing or not. In fact, because there are asynchronous peaks, there must be more than two components (this follows from the fact that when there are only two components, one is simultaneously replaced by the other, and there is no asynchronous component). Notice as well that the asynchronous peak spans the space for both positive and negative synchronous peaks. If the peaks in the 2D-COS plots do not correspond to the peaks in the band-fitted spectra, that means that changes in all the peaks are contributing to the changes encoded in the 2D-COS.
What is interesting is that the intensities of the three small spectral features are fairly constant over this temperature range, yet their widths are all varying, but with different behaviors, which can be seen in Figure 4. Actually, the band-fitted spectra show us that only the two strong bands are changing in intensity to any significant amount; one is increasing in intensity, and one is decreasing, and they are broad enough that they overlap. This accounts for the inflection point in the 2D-COS plots at 3260 cm-1. All of this, of course, is a result of hydrogen bonding and the formation and evolution of various clusters in the water, which is discussed with much more detail in the references (2,3).
Interestingly, temperature-dependent NIR (near IR) measurements have also been measured and subjected to 2D-COS analysis (4). It is gratifying to see that similar conclusions have been drawn here. There is a broad asymmetric combination band of the symmetric and anti-symmetric OH stretches that appears as two components in the 2D-COS. PCA was applied and it was shown that 99% of the spectral variations occurred at 7089 and 6718 cm-1 corresponding to the νsym + νantisym combination in two different species of water whose relative concentrations were changing with temperature. While the full story of the structure of water (2,3) is much more complicated than what I have described here, it is always encouraging to see that different techniques produce similar information.
Closing Comments
Something that did not occur to me while I was doing this work is whether changing the peak positions of the band-fitted spectra would provide a different comparison to the 2D-COS. After submitting the manuscript, I did vary the fitting parameters, and confirmed that these fits are not unique. A future study where the fitting would be varied systematically might provide better insight, but I leave this to a future column.
I was motivated to do these measurements for several reasons. I wanted to see the results of using this analytical approach to analyze water, whose OH band would not be detectable with a 785 nm laser. But I have also been fascinated by the potential of 2D-COS to reveal differences that are difficult to see spectrally because of band overlap. Unfortunately (for me) the story is much more complicated than I expected, a fact that was revealed to me by Professor Isao Noda. Again I am grateful to him for helping through this painful learning process, and I hope that my candor in describing what I am doing will be helpful to my readers.
References
(1) Innovative Photonic Systems, Monmouth Junction, NJ 08852.
(2) Q. Sun, Vib. Spectrosc. 51, 213–217 (2009).
(3) T. Morawietz, O. Marsalek, S.R. Pattenaude, L.M. Streacker, D. Ben-Amotz. and T.E. Markland, J. Phys. Chem. Lett. 9, 851–857 (2018).
(4) I. Noda and Y. Ozaki, Two-Dimensional Correlation Spectroscopy: Applications in Vibrational and Optical Spectroscopy (John Wiley & Sons, Chichester, England, 2004).
Fran Adar

Fran Adar is the Principal Raman Applications Scientist for Horiba Scientific in Edison, New Jersey. Direct correspondence to: SpectroscopyEdit@UBM.com.

Advanced Raman Spectroscopy Method Boosts Precision in Drug Component Detection
April 7th 2025Researchers in China have developed a rapid, non-destructive Raman spectroscopy method that accurately detects active components in complex drug formulations by combining advanced algorithms to eliminate noise and fluorescence interference.