Article
Special Issues
Spectroscopy Supplements
Micronutrient Analysis from Soil to Food: Determination by ICP-OES
Author(s):
The nutritional value of food depends on many components, including vitamins and minerals. While both of these occur naturally, they are also commonly added during processing to increase the nutritional content. Naturally occurring nutrients enter plants (and ultimately animals who consume plants) from the soils in which they grow, so it is equally important to monitor the nutrient content of both soil and final food products. Since the number of elemental nutrients is limited and they are present at relatively high concentrations, ICP-OES is an ideal technique for their measurement in soil and food. This work will focus on the elemental nutrient analysis of soils and two categories of food products: milk and fruit juice, whose nutritional content is particularly important as they are commonly consumed by young children.
The nutritional value of food depends on many components, including vitamins and minerals. While both of these occur naturally, they are also commonly added during processing to increase the nutritional content. Naturally occurring nutrients enter plants (and ultimately animals who consume plants) from the soils in which they grow, so it is equally important to monitor the nutrient content of both soil and final food products. Because the number of elemental nutrients is limited and they are present at relatively high concentrations, inductively coupled plasma–optical emission spectrometry (ICP-OES) is an ideal technique for their measurement in soil and food. This work focuses on the elemental nutrient analysis of soils and two categories of food products: milk and fruit juice, whose nutritional content is particularly important because they are commonly consumed by young children.
With consumers pursuing healthy diets with ever-increasing vigor and the nearly year-around availability of fresh produce in developed countries, balancing one’s diet has become less challenging. With a balanced diet, major vitamins are consumed naturally in amounts that no longer need supplementation, so attention is shifting from major vitamins to a more detailed assessment of micronutrients in food.
The micronutrient content of food is composed of a variety of minerals. Many of these micronutrients are endemic to the food itself, but are also influenced by environmental factors, including the quality of the water and makeup of the soil in which the food is grown (1). Plants take up nutrients from the soil, which is commonly fortified with fertilizers to ensure healthy plant and crop growth and enhance quality, and those fertilizers can consequently also affect the mineral content of the plants and produce (2–4).
To understand the micronutrient contribution to the quality of foods, it is important to determine their mineral content as well as that of the soil where plants are grown. Since the number of elements to detect is relatively small (generally <10) and the concentrations of these elements are high, these analyses can be accomplished with flame atomic absorption spectroscopy (FAAS) (5,6), inductively coupled plasma–optical emission spectrometry (ICP-OES) (7,8), or inductively coupled plasma–mass spectrometry (ICP-MS) (9,10), with each technique having its own benefits.
FAAS is inexpensive, fast, and simple to operate, but it is a single analyte technique, meaning that only one element can be analyzed at a time. Therefore, each sample must be run multiple times-once per element of interest. As a result, the speed advantages of FAAS are largely negated when analyzing multiple elements.
ICP-OES and ICP-MS can measure multiple elements in a single analytical run. ICP-OES has the advantages of being less expensive, more matrix-tolerant, and generally easier to operate than ICP-MS, but ICP-MS has the benefit of being able to measure much lower concentrations of elements present. Considering the number of micronutrient elements and that they are generally present at high levels, ICP-OES offers an excellent compromise between speed, cost, and simplicity for this analysis.
Regardless of the analytical technique used, solid samples must first be digested before analysis so that the elements are suspended in an analysis-ready solution. Given the diverse nature of soil and food samples, microwave-assisted digestion is capable of delivering the best speed and quality for the digestion of this wide range of samples.
This work focuses on the determination of micronutrient mineral elements in food in the form of fruit juice, milk, and soil samples using microwave sample preparation and ICP-OES analysis.
Experimental
Samples and Sample Preparation
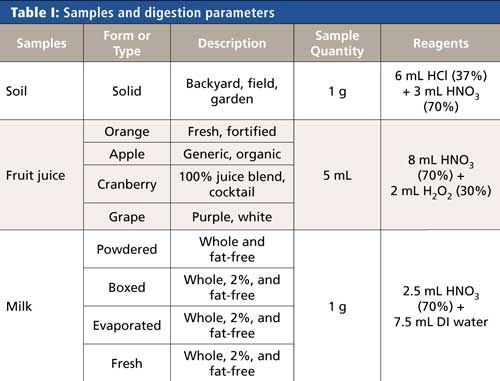
The soil samples were collected from several sources: residential yards and gardens as well as commercial farms and pastures. Milk and juice samples were purchased in local grocery stores and represent a variety of different types within each food category; Table I summarizes the samples analyzed and presented here. In addition to these samples, reference materials were prepared and measured alongside the samples when they could be obtained.
All samples were prepared via microwave digestion using a Titan MPS microwave sample preparation system (PerkinElmer Inc.) with standard 75-mL digestion vessels. Although most milks and juices are liquid and can potentially be analyzed without digestion, these samples were digested to break down the complex matrices and increase the accuracy and ease of analysis. The digestions for all types of samples were accomplished using the microwave program shown in Table II.

Because the sample matrices differ, slightly different sample amounts and reagents were used for the digestion, as shown in Table I. Because of the complex nature of soils, the addition of hydrochloric acid to nitric acid was found to improve the extraction efficiency, and hydrogen peroxide added to nitric acid was beneficial in breaking down the high sugar content of the fruit juices. After the samples were added to the digestion vessels, predigestion spikes were added next (when used), followed by the digestion reagents. Before closure and heating, the vessels were left open for 10 min to allow any early reactions to occur safely. After digestion was complete, samples were transferred to autosampler tubes and diluted to a final volume of 50 mL or a final weight of 50 g with deionized water.
Instrumental Conditions
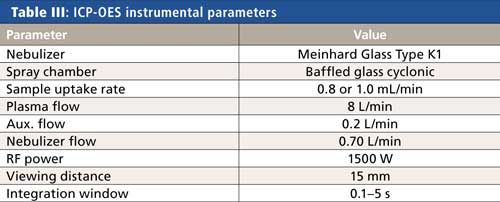
All analyses were performed on an Avio 200 ICP-OES system (PerkinElmer Inc.) using the conditions shown in Table III. Measurements were made against multipoint external calibration curves, where the standards were made up at the same acid concentration of the samples. With the excellent linearity of ICP-OES, the calibration standards did not have to bracket the concentration ranges being measured to deliver analytically precise and accurate results.
Results and Discussion
Validation
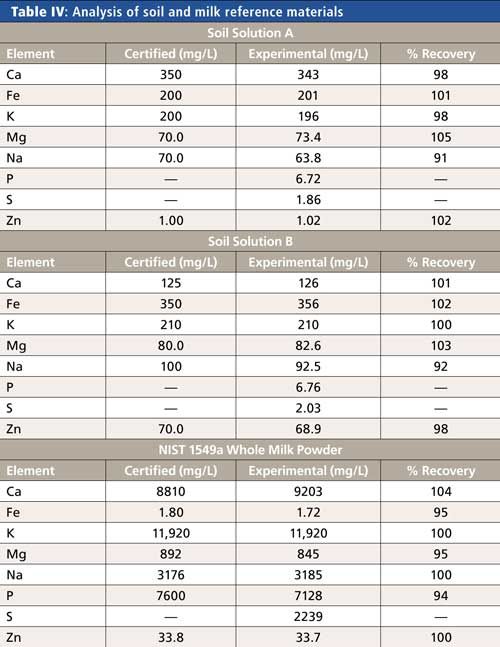
To verify the accuracy of the methodology for each matrix, certified reference materials were measured where available (Soil Solutions A and B, High Purity Standards; 1549a Whole Milk Powder, National Institute of Standards and Technology [NIST]), with the results appearing in Table IV. The recoveries for all elements in all reference materials are within 10% of the certified values, indicating accuracy of the methodology.
Sample Analysis
With the method accuracy validated and confidence in the sample preparation step confirmed via reference materials, the soil and food samples were analyzed, with results appearing in Figures 1–3.
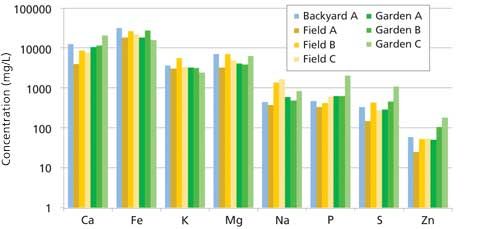
Figure 1: Results from analyses of soil samples. (Backyard in blue; fields in shades of yellow; gardens in shades of green.)
Since all the soils were productive and collected from a relatively small geographic area, there was not an expectation of large variation in elemental concentrations between the samples, which was confirmed by analysis. It is interesting to note in Figure 1 that the “Garden C” sample appears to be recently amended with fertilizer, because the P, S, and Zn concentrations are well above the mean of the other samples. Although these samples did not display great variation, the usefulness and capability provided by direct analytical analysis of the micronutrient concentrations in soil would allow for the careful selection and judicious use of targeted micronutrient fertilizers when needed and help prevent both soil depletion and the damaging overuse of fertilizer.
The results for the fruit juice samples are shown in Figure 2. In general, the mineral content does indeed vary among juice types, indicating that there is value in assessing the micronutrient concentrations of food. It can be seen that in some cases the concentrations of individual micronutrients can have differences of nearly two orders of magnitude from juice to juice, representing the differences in processing and the nutritional value of the ingredients used. When comparing the orange juices, “Orange-B” has a significantly higher Ca content than “Orange-A,” which supports the “Orange-B” label claim that this juice is fortified with calcium. Looking at the cranberry juices, “Cranberry-B” has a higher mineral content than “Cranberry-A,” which is expected since “Cranberry-B” is a 100% juice blend and “Cranberry-A” is a juice cocktail (that is, 25% juice).
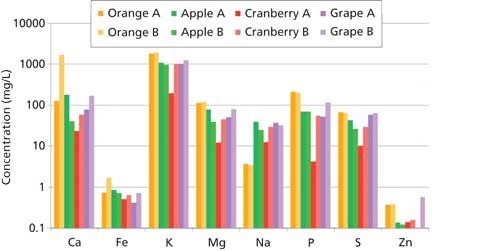
Figure 2: Results from analyses of juice samples. (Orange juice in shades of orange; apple juice in shades of green; cranberry juice in shades of red; grape juice in shades of purple.)
Various dairy samples were analyzed encompassing four dairy products (fresh, boxed, evaporated, and powdered milk) with three fat contents (fat-free [0%], 2%, and whole); the results appear in Figure 3. The powdered milk and evaporated milk samples have the highest micronutrient concentrations (as expected) because of the concentrated nature of the samples themselves. The fresh and boxed milks have similar micronutrient concentrations, demonstrating that ultra-heat treating the milk to create a shelf-stable product does not appear to negatively affect the mineral content. Finally, the mineral concentrations appear to be independent of the fat content, with the fat-free, 2%, and whole milks each having similar micronutrient concentrations for a specific milk type (that is, evaporated, fresh, and boxed).
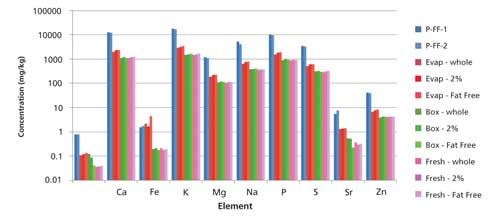
Figure 3: Results from analyses of milk samples. (Powdered milks in shades of blue; evaporated milks in shades of red; boxed milks in shades of green; fresh milks in shades of pink.)
Spike Recovery Studies
To assess any issues with the sample preparation process, all samples were spiked at the levels shown in Table V before digestion. Spike recoveries were not performed for potassium in the juice samples or calcium in the calcium-fortified orange juice since these were present at such elevated levels (as shown in Figure 2) that they obscure the spike signal and essentially eliminate the ability to calculate recovery values.
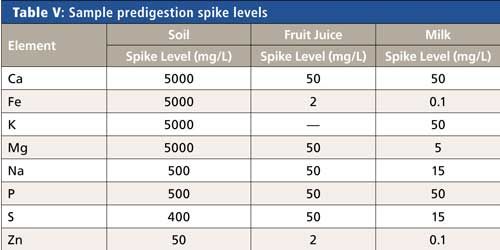
Nevertheless, all other spikes were recovered within 10% of the spike values, demonstrating that no analyte loss or contamination occurred during the sample preparation process and that it effectively removed the matrix. Combining these results with those of the reference materials (Table IV) provides validation of the accuracy of the methodology from sample preparation to analysis.
Summary
This work has demonstrated the ability to analyze micronutrients in soil and food products using ICP-OES along with microwave-assisted sample preparation. Microwave-assisted digestion allows for a nearly unified sample preparation method across all samples, as well as providing superior digestion results. Combining this sample preparation approach with the strong capabilities of the ICP-OES analytical technique, it becomes straightforward to assess the micronutrient content of foods for safety and label claim requirements, determine if the soil in which the plants are grown requires the addition of minerals to maximize crop quality, and ensure that the correct micronutrient blend is added via fertilizers to the soil as needed. From farmer to consumer, this analysis technique ensures that resources are used efficiently and that the healthfulness and quality of the food we eat meets our high expectations.
References
- B.J. Atwell, P.E. Kriedemann, and C.G.N. Turnbull, Plants in Action: Adaptation in Nature, Performance in Cultivation, B.J. Atwell, P.E. Kriedemann, and C.G.N. Turnbull, Eds. (Macmillan Education AU, 1999), Chap. 3.6.
- Nutrition and Transport in Plants, http://www.mhhe.com/biosci/genbio/raven6b/graphics/raven06b/other/raven06_39.pdf.
- Nutrient Cycling and Maintaining Soil Fertility in Fruit and Vegetable Crop Systems, University of Minnesota Extension, http://www.extension.umn.edu/garden/fruit-vegetable/nutrient-cycling-and-fertility/.
- J.G. Masabni and F.J. Dainello, Vegetable Grower’s Handbook: 4th Edition (Texas A&M University, 2009), Chap. 3.
- Atomic Absorption Spectroscopy (AAS) Tutorial, http://www.ausetute.com.au/aas.html.
- Basic Principles of Atomic Absorption and Atomic Emission Spectroscopy, http://www.philadelphia.edu.jo/academics/ajaber/uploads/CH%20 %208%20and%2010%20-Basic%20Principles%20of%20Atomic%20 Absorption%20and%20Atomic%20Emission%20Spectroscopy.pdf.
- S. Ghosh, V. Laxmi Prasanna, B. Sowjanya, P. Srivani, M. Alagaraja, and D. Banji, Asian J. Pharma Ana. 3(1), 24–33 (2013).
- C.B. Boss and K.J. Fredeen, “Concepts, Instrumentation, and Techniques in Inductively Coupled Plasma Optical Emission Spectrometry,” PerkinElmer, Inc., 2004.
- R. Thomas, Practical Guide to ICP-MS (Marcel Dekker, Inc., 2004).
- A. Bazilio and J. Weinrich, The Easy Guide to: Inductively Coupled Plasma Mass Spectrometry (ICP-MS) (University of Massachusetts, 2012), http://www.ecs.umass.edu/eve/facilities/equipment/ICPMS /ICPMS%20quick%20guide.pdf.
Nick Spivey and Ken Neubauer are with PerkinElmer Inc., in Shelton, Connecticut. Direct correspondence to: christopher.spivey@perkinelmer.com and kenneth.neubauer@perkinelmer.com
Newsletter
Get essential updates on the latest spectroscopy technologies, regulatory standards, and best practices—subscribe today to Spectroscopy.
