Rapid and Accurate LC–MS-MS Analysis of Nicotine and Related Compounds in Urine Using Raptor Biphenyl LC Columns and MS-Friendly Mobile Phases
Special Issues
A rapid, accurate, and reproducible method was developed for high-throughput testing of nicotine, cotinine, trans-3’-hydroxycotinine, nornicotine, norcotinine, and anabasine in urine. Data show that a fast and highly efficient analysis of these basic compounds can be achieved with the Raptor Biphenyl column using standard reversed-phase LC–MS mobile phases that are compatible with a variety of LC–MS instrumentation.
A rapid, accurate, and reproducible method was developed for high-throughput testing of nicotine, cotinine, trans-3’-hydroxycotinine, nornicotine, norcotinine, and anabasine in urine. Data show that a fast and highly efficient analysis of these basic compounds can be achieved with the Raptor™ Biphenyl column using standard reversed-phase LC–MS mobile phases that are compatible with a variety of LC–MS instrumentation.
Nicotine is the major tobacco alkaloid that underlies addiction in tobacco users. Anabasine and anatabine are the most abundant minor alkaloids in tobacco (1). Anabasine is frequently used as a unique marker for recent tobacco use as it can only be detected in the urine of tobacco users and is not present in the urine of those who use nicotine replacement therapies (for example, nicotine patches). In humans, more than 70% of nicotine is transformed to cotinine, which is subsequently converted to trans-3’-hydroxycotinine, the main nicotine metabolite detected in urine (2). Nornicotine and norcotinine are minor metabolites (0.5-2%) produced by the demethylation of nicotine and cotinine, respectively. The urinary measurement of nicotine metabolites has several applications, including public tobacco exposure monitoring, nicotine replacement therapy evaluation, drug therapy assessment, forensic toxicology analysis, and life or health insurance applications. In addition, nicotine metabolites can be used as the biomarkers for pharmacogenomics evaluation and disease profiling (3).
A variety of chromatographic methods have been developed for nicotine metabolite analysis. However, most methods use high-pH chromatography with relatively high concentrations of additives to increase retention, improve peak shape, and reduce tailing. The intent of this application was to develop a method for the analysis of nicotine-related compounds in urine using solutions that are “friendly” to LC–MS-MS systems. A Raptor™ Biphenyl column was chosen as the analytical column because it provides good retention and peak shape for the target analytes when used with standard low-pH, reversed-phase mobile phases. The clinical applicability of this method was demonstrated by the accurate and reproducible analysis of fortified analytes in urine.
ExperimentalInstrument and Analytical Conditions
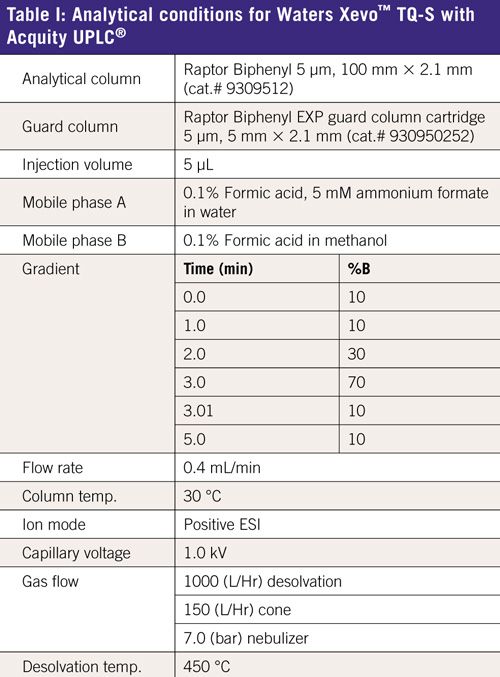
The instrument and analytical conditions are listed in Table I. The analyte MRMs are shown in Table II.


Sample/Calibration Standard Preparation
Blank urine from an unexposed non-tobacco user was fortified to prepare calibration standards and fortified QC samples. A 5000 ng/mL standard mix was prepared in urine and diluted with urine to make calibration standards at 2, 5, 10, 25, 50, 100, 250, 500, 1000, 2500, and 5000 ng/mL (only continine and trans-3′-hydroxycotinine were tested at 2500 and 5000 ng/mL levels). Three levels of QC samples (7.5, 75, and 750 ng/mL for nicotine, nornicotine, norcotinine, and anabasine; 75, 750, and 10,000 ng/mL for cotinine and trans-3′-hydroxycotinine) were prepared in urine for accuracy and precision testing. The 10,000 ng/mL QC sample for cotinine and trans-3′-hydroxycotinine was diluted 5-fold in water before the sample preparation procedure. Analyses were performed on three different days.
All fortified standards and QC samples were processed with a liquid-liquid extraction (LLE) procedure. An aliquot of 250 µL urine was mixed with 50 µL of internal standard solution (250 ng/mL in methanol) and 50 µL of 5N sodium hydroxide in a 4 mL glass vial. Extraction was performed by adding 1.5 mL of 50:50 methylene chloride:diethyl ether and stirring for 1.5 min. After centrifugation at 4000 rpm for 5 min, 1 mL of the organic phase was transferred to a 1.5 mL HPLC vial and mixed with 10 µL of 0.25 N hydrochloric acid before evaporating to dryness at 35 °C under a gentle stream of nitrogen. The dried extract was reconstituted with 200 µL of water.
Results
Since nicotine, norcotinine, and anabasine all share the same mass transitions, it’s necessary to chromatographically separate these three compounds for accurate quantitation. As shown in Figure 1, baseline resolution was obtained for nicotine, norcotinine, and anabasine with the Raptor™ Biphenyl column. Simultaneous analysis of all six analytes was performed with a fast 3-min gradient and a 5-min total analysis time for each injection. Note that good peak shape was obtained for all analytes with the use of standard, low-pH, reversed-phase mobile phases. The Raptor™ Biphenyl column allowed an MS-friendly mobile phase to be used without any evidence of the peak tailing that is often observed in the analysis of these basic compounds, unless high-pH mobile phases with higher concentrations of additives are used.


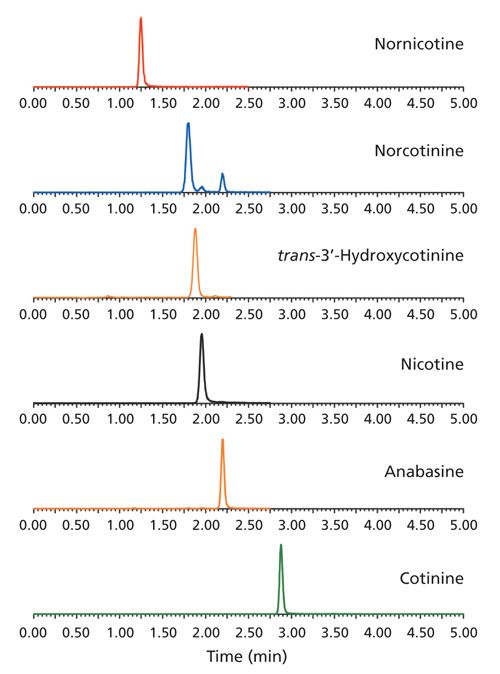
Figure 1: Good chromatographic separations and peak shapes for nicotine-related compounds were achieved using the Raptor™ Biphenyl column and a simple, low pH, MS-friendly mobile phase.
Analysis of blank urine samples spiked with internal standards and subjected to the extraction procedure confirmed there were no significant matrix interferences for the target analytes. Analysis of the calibration standards established the linear ranges for each compound as 2-1000 ng/mL (nicotine, nornicotine, norcotinine, and anabasine); 5-5000 ng/mL (cotinine); and 10-5000 ng/mL (trans-3′-hydroxycotinine). To achieve detection across these wide concentration ranges, a detuning of the MS detector was necessary for all analytes in order to avoid saturation of the MS signal at the highest concentration. Using weighted quadratic regressions, r2 was ≥ 0.995 for all analytes, and the percent deviation was within 15% of the nominal concentration (≤ 20% for the lowest concentrated standard). Based on the signal-to-noise value for the 10 ng/mL standard, the LLOQ is estimated to be 0.4 ng/mL for all analytes.
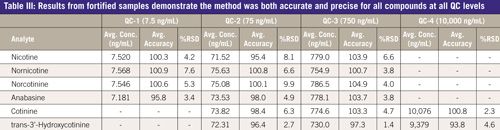
Method accuracy was demonstrated using percent recovery and these values fell well within 10% of the nominal concentration for all QC levels (93.8-104.9%). Good method precision was also obtained, as indicated by %RSD ranges of 0.6-8.2% and 1.4-9.9% for intraday and interday results respectively. The interday accuracy and precision data are summarized in Table III.


The minor tobacco alkaloid, anabasine, can only be detected in the urine of current tobacco users; it is not present in the urine of non-smokers or nicotine patch/gum users. Using the method established here, specific and sensitive urinary analysis of anabasine was used to distinguish different types of tobacco users. As shown in Figure 2, different levels of anabasine were detected from a light smoker, a moderate smoker, and a non-smoking nicotine patch user.


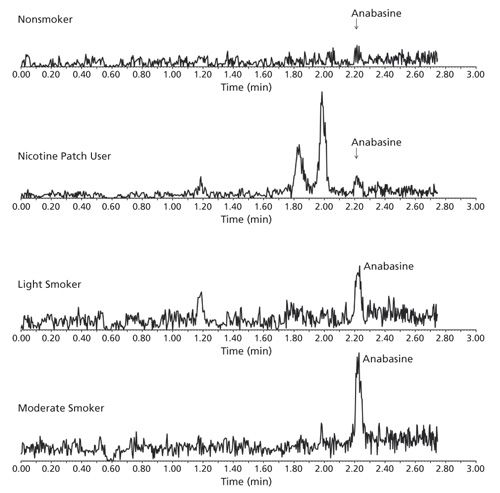
Figure 2: Specific detection of anabasine made it possible to distinguish different types of tobacco/nicotine product use.
The minor tobacco alkaloid, anabasine, can only be detected in the urine of current tobacco users; it is not present in the urine of non-smokers or nicotine patch/gum users. Using the method established here, specific and sensitive urinary analysis of anabasine was used to distinguish different types of tobacco users. As shown in Figure 2, different levels of anabasine were detected from a light smoker, a moderate smoker, and a non-smoking nicotine patch user.
Conclusions
While many current methods for the analysis of nicotine-related compounds require the use of high-pH mobile phases with additives that may damage the analytical system, the method established here using the Raptor™ Biphenyl column produced good results using a simple, MS-friendly mobile phase. The method provided excellent performance for the simultaneous analysis of nicotine, two major metabolites (cotinine and trans-3′-hydroxycotinine), two minor metabolites (nornicotine and norcotinine), and a minor tobacco alkaloid, anabasine, in human urine. Accurate and reproducible analysis was achieved in less than 5 min of chromatographic analysis time, making the column and method well suited to low-cost, high-throughput analysis of nicotine-related compounds.
References
(1) P. Jacob, L. Yu, A.T. Shulgin, and N.L. Benowitz, Minor Tobacco Alkaloids as Biomarkers for Tobacco Use: Comparison of Users of Cigarettes, Smokeless Tobacco, Cigars, and Pipes, Am. J. Public Health,89(5), 731-736 (1999).
(2) N.L. Benowitz, J. Hukkanen, and P. Jacob, Nicotine Chemistry, Metabolism, Kinetics and Biomarkers, Handb Exp. Pharmacol.192, 29-60, (2009).
(3) K.S. Derby, K.C.C. Caberto, S.G. Carmella, A.A. Franke, and S.S. Hecht, Nicotine Metabolism in Three Ethnic/Racial Groups with Different Risks of Lung Cancer, Cancer Epidemiol Biomarker Prev, 17, 3526-3535 (2008).


Restek Corporation
110 Benner Circle, Bellefonte, PA 16823
tel. (800) 356-1688, fax (814) 353-1309
Website: www.restek.com