Quantitation of Albumin and Creatinine in Urine by MALDI-TOF Mass Spectrometry
Special Issues
Chronic kidney disease or kidney complication resulting from another systematic disorder can impact the organ’s blood filtering capability resulting in the passage of blood-born proteins through the kidneys and into urine. Clinical analyses for blood proteins in urine are performed to assess proper kidney function or to monitor a diagnosed disorder. Serum albumin is a common target in these clinical assays and detection of elevated SA levels in urine is termed Albuminuria. Because of normal variability in urine content and volume multiple measurements are often made in comparison to creatitine levels within the same urine sample and reported as a ratio (ACR). Demonstrated here is a novel means for quantifying albumin and creatinine directly from the same urine sample using MALDI-TOF mass spectrometry. Standard addition of albumin and deuterated creatinine (d3) into control urine produced a linear and quantitative response (R2 = 0.99 and 0.98) and is used to quantify both analytes across their clinically relevant ranges. This MS-based method represents a simple, fast, attractive alternative to currently clinical methods.
Chronic kidney disease or kidney complications resulting from another systematic disorder can impact the organ’s blood filtering capability and cause the passage of high molecular weight, blood-born proteins through the kidneys and into the urine. Clinical analyses for blood proteins in urine are performed to assess proper kidney function or to monitor a diagnosed disorder. Serum albumin is a common target in these clinical assays, and the condition of elevated levels in urine is termed albuminuria. Because of normal variability in urine content and volume, multiple measurements are often made in comparison to creatinine levels within the same urine sample and reported as an albumin/creatinine ratio (ACR). This article describes a novel means for quantifying albumin and creatinine directly from the same urine sample using matrix-assisted laser desorption–ionization time-of-flight-mass spectrometry (MALDI-TOF-MS). The standard addition of albumin and deuterated creatinine into control urine produced a linear and quantitative response (R2= 0.99 and 0.98) and was used to quantify both analytes across their clinically relevant ranges. This MS-based method represents a simple, fast, and attractive alternative to current clinical methods.
____________________________________________________
The term albuminuria refers to the condition of having serum albumin (albumin) in the urine (1–3). Normally, the kidneys act as filters (4) to the blood using semi-permeable membranes and concentration gradients to selectively retain desirable substances while removing wastes, thereby regulating and maintaining appropriate blood composition (5,6). Typically, blood proteins, including albumin, are largely retained by the kidneys and not expelled in the urine; however, several factors may impact this function and allow albumin to pass through. Transient physical conditions such as heavy exercise (7), a kidney stone (8), or a temporary illnesses such as a urinary tract infection (9) can lead to temporary albuminuria. However, repeated chronic positive measurements of albuminuria can be a sign of acute kidney damage (10,11) or a more serious disorder like chronic kidney disease (12,13), diabetic kidney disease (14), metabolic syndrome (15), nephritic syndrome (16), or cardiovascular disease (17,18). Additionally, albuminuria was detected in one of every three people with diabetes, one of every seven people with high blood pressure but no diabetes, and one of every six people older than 60 years (1).
According to the National Kidney Foundation (1), ~8% of adults have a moderate level of albuminuria termed microalbuminuria and ~1% have a higher level of albuminuria termed macroalbuminuria. As the “micro” and “macro” prefixes imply, the severity of albuminuria is categorized by the amount or concentration of albumin present in a urine sample (19). However, because of the normal variation in urine content resulting from factors such as hydration, diet, physical condition, medicines, and so forth (20), the concentration of albumin in urine can vary; therefore, the measurement of albumin is often and preferably compared against the measurement of creatinine (21,22) in that same urine sample. Creatinine is a by-product of muscle metabolism, and it is normally released into the urine at a constant rate, which is a characteristic that makes it useful for gauging overall urine “dilution.” The amount of albumin is reported in reference to the amount of creatinine as an albumin (mg)/creatinine (g) ratio (ACR). A ratio of <30 mg/g is considered normal, a value in the 30–300 mg/g range is defined as microalbuminuria and a ratio of >300 mg/g is defined as macroalbuminuria.
Current protocols (23,24) for the measurement of albumin in urine are largely (94%) immunoassay-based and the majority of these (85%) rely on measurement of turbidity. Urinary creatinine is typically measured by a colorimetric method developed by Jaffe (25) and applied by Folin (26) more than 100 years ago. Although in both cases the general methodology is considered adequately sensitive and cost-effective, these measurements are made on independent analytical platforms, each with distinct sample preparation protocols and requiring specialized reagents and instrumentation. In both cases, the analytical signals are derived from properties of solution and result from chemical reactions that may not go to completion and that can be compromised by interfering substances (27–29). When albumin is quantified with antibodies, the signal obtained is dependent on the antibody preparation, and the details of how individual antibody molecules interact with the albumin bio-forms that are present.
A method is described here that uses matrix assisted laser desorption-ionization time-of-flight mass spectrometry (MALDI-TOF-MS) for the quantitation of albumin and creatinine in urine. The analysis measures both analytes directly and in their intact form, from the same 1:10 dilution of a urine sample. Standard addition of commercially available human serum albumin (HSA) and deuterated creatinine (creatinine-d3) into control urine produces a quantitative response for both analytes across their clinically relevant ranges. In addition, because the MALDI-TOF-MS platform is capable of acquiring quality data over the large mass range of 100–40,000 Da, there is clear potential for the detection and monitoring of other molecules of interest within the same urine sample. The method allows for multiple sample preparations to be loaded together into the mass spectrometer with spectra collection and data processing on a time scale of minutes and represents a simple, fast, attractive, and high-throughput alternative to current clinical assays for both albumin and creatinine in urine.
Experimental
Sample Procurement
Urine samples were obtained from a clinical laboratory and were specifically chosen to span the relevant range of albuminuria. Before MALDI-TOF-MS the samples were analyzed by clinically validated methods for both albumin (immunoturbidity) and creatinine (colorimetry). The use of discarded specimens for test development was approved by the VA Subcommittee on Research, VA San Diego Healthcare Systems, Protocol H120059.
Sample Preparation and Calibration Curve Construction
Figure 1 outlines the method used for calibration curve construction and albumin quantitation. A pooled urine sample, devoid of albumin as determined by MALDI-TOF-MS, served as the control sample. HSA (Sigma-Aldrich) was weighed and diluted in a control urine sample to create a 100 mM (664 mg/dL) stock solution. This stock was diluted 10× into the control sample (albumin free) and then further diluted in 2× serial manner with the same control to create albumin concentrations to span the clinically relevant concentration range in a normal urine background. All urine samples (control and clinical) were diluted 1:10 in MALDI-TOF matrix (10 mg/mL α-cyano-4-hydroxycinnamic acid [HCCA] in 50% acetonitrile, 0.1% trifluoroacetic acid) that was spiked with lysozyme (75 nM) and creatinine-d3 (10 mg/dL). Then 2 µL of this sample-matrix mixture was spotted onto a disposable stainless steel MALDI target (Hudson Surface Technology). Standards were run in 6× technical replication and samples were run in 3× technical replication. The signal from lysozyme, present at a consistent concentration, was used to normalize the albumin response in high mass scans by summing the integrated peak areas from four prominent albumin ion charge states and dividing this total by the peak area of the lysozyme internal standard. A calibration curve for the quantitation of albumin in unknowns was constructed using the average response from the HSA-spiked urine control samples. For creatinine quantitation, differential amounts of a creatinine-d3 standard (Santa Cruz Biotechnology) was added to 1:100 dilution of urine to investigate the MALDI-TOF response across the concentration range of interest. After establishing a linear response, a single creatinine-d3 spike was used for the relative quantitation of native creatinine in the clinical samples.
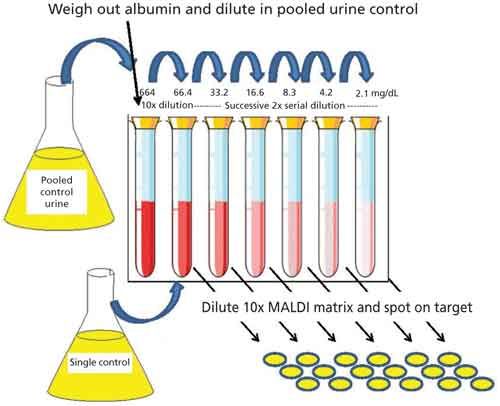
Figure 1: Calibration curve construction using HSA standard and albumin-free urine as a control sample. Calibrants were spotted in 6X technical replication.
Mass Spectrometry
Mass spectra were generated in linear, positive-ion mode on a SimulTOF ONE (30) (SimulTOF Systems) MALDI-TOF mass spectrometer. Data were acquired in two separate scans (13,000–40,000 Da for albumin and 50–500 Da for creatinine) on each sample location. Individual spectra were the average of 100 individual laser shots and all spectra passing a minimum intensity threshold of 20 mV were further averaged to create a single consensus spectrum for each sample location. The instrument acquisition parameters were as follows: acceleration voltage, 20 kV; focus mass, 15,000 (high mass scan: albumin) and 117 (low mass scan: creatinine); laser pulse frequency, 1 kHz: laser pulse energy, 2 µJ; and scan rate, 1 mm/s at a 100 µm raster to cover each sample position. The focus mass parameter was adjusted to increase analyte resolution in the appropriate mass range.
Data Processing
For high mass scans the averaged spectrum from each sample location was calibrated using the peak centroid for multiply charged albumin ions (m/z 13,287, 16,609, 22,146, 33,218) respectively and the area under the curve was summed over 13,900–14,700 for lysozyme and 13,200–13,500, 16,400–17,000, 21,800–22,800, and 32,800–3,800 for the four albumin species. For each sample a single, normalized albumin response value was calculated by dividing the summed area of the albumin peaks by the area of lysozyme peak. Data collected for the analysis of albumin-spiked control urine plotted against concentration fit best to a quadratic expression y = 0.512x2 + 0.786x – 0.0629 (where y = MALDI-TOF response and x = albumin concentration). Clinical samples were quantitated for albumin by using their MALDI-TOF albumin response to solve this quadratic equation (MALDI-TOF response = 0.512x2 + 0.786x – 0.0629) and therefore 0 = 0.512x2 + 0.786x(–0.0629 – MALDI-TOF response). The calculated albumin concentration was further multiplied by 10 to reflect the dilution of the original urine sample. Creatinine quantitation was calculated from the ratio of the native creatinine peak area to that of the creatinine-d3 internal standard (native creatinine/creatinine-d3). This relative creatinine response was then multiplied by 90 to reflect the dilution of the internal standard and the original sample in the sample-MALDI-matrix mixture to produce a creatinine concentration for each sample. All peak integrations and quantitative calculations for both albumin and creatinine were performed using Excel.
Results
Figure 2 shows an overlay of the average spectrum (n = 6) for each different albumin concentration spiked and serially diluted into an albumin-free urine control sample. The various concentrations were chosen to span the range of interest for albumin in urine and as can be seen, at these clinically relevant levels, signal for the variously charged albumin species dominate the spectrum. The spectrum of the unspiked control sample is shown in the figure inset to demonstrate a urine-free sample based on the limits of detection for MALDI-TOF-MS; the x and y ranges of the inset are the same as those of the main figure. The spectra have been normalized to the signal of the lysozyme internal standard and demonstrated the expected systematic increase in albumin signal intensity accompanying the increase in albumin concentration. The four albumin species that are marked in the figure (Alb+2, Alb+3, Alb+4, and Alb+5) and the lysozyme internal standard were used to obtain the MALDI-TOF response for each sample.
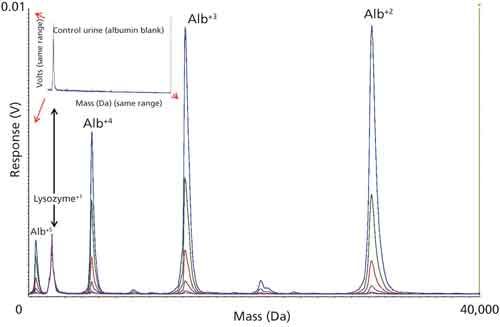
Figure 2: Overlay plot of six control samples formulated with different albumin concentrations to span the clinically relevant range. The four major albumin peaks marked in the figure along with the lysozyme internal standard were used to calculate the MALDI-response and construct a calibration curve for the quantitation of unknowns. Inset shows the spectrum of the unspiked control (albumin-free).
Figure 3 shows the HSA concentration plotted against average MALDI-TOF response for each of the spiked urine controls. The plot of the data and the subsequent regression analysis shows that the data fit well to a quadratic expression (R2 = 0.99) and this expression was used to calculate the albumin content in clinical samples. The table inset in Figure 3 displays the albumin concentration, average MALDI-TOF response, 2x standard deviation (SD) and coefficient of variance (CV) for the six technical replicates performed at each concentration. The error bars in the figure are ±2x SD calculated for each data point.
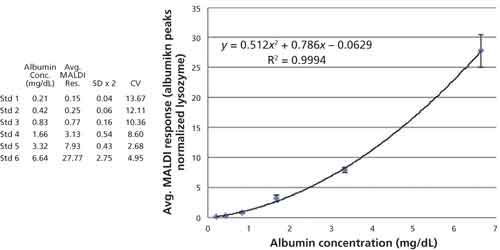
Figure 3: Plot (albumin) versus average MALDI response for each of the control samples. The data are fit with a quadratic regression curve and the formula and residual squared term are embedded in the figure. The errors bars equal ±2x SD of each data point and the table contains the data used to construct the plot.
Figure 4 shows an overlay of spectra collected from low mass scans of a urine sample spiked with four different concentrations of creatinine-d3 and the figure demonstrates that both native creatinine and the deuterated standard lay in a region of the spectrum that is reasonably free of other ions and therefore good for quantitation. In addition, this initial spiking experiment using different concentrations of internal standard was performed to examine the MALDI-TOF response for creatinine across the clinically relevant range and, as demonstrated in Figure 5, it was determined that the MALDI response was linear with respect to concentration. Accordingly, the creatinine concentration in clinical samples was calculated from the ratio of the signal to the native creatinine signal to that of the creatinine-d3 signal.
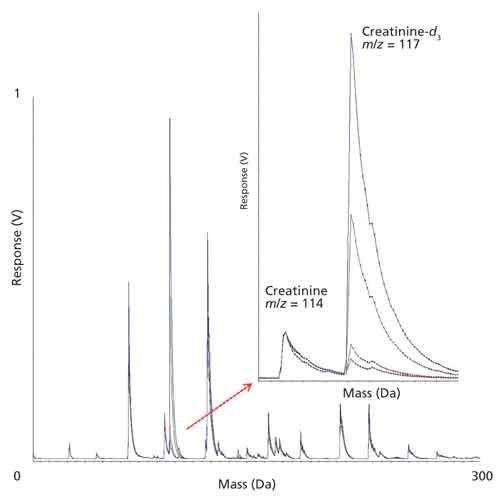
Figure 4: Overlay plot of four control samples formulated with different creatinine-d3 concentrations to span the clinically relevant range. The inset is a zoom of the native creatinine (m/z 114.12) and creatinine-d3 (m/z 117.12) region of the spectrum.
Figure 5 shows the plot of creatinine-d3 concentration versus integrated peak intensity and demonstrates a linear relationship across the concentration range of interest (R2 = 0.99). The table inset in Figure 5 displays the creatinine-d3 concentration, average MALDI-TOF response, 2x SD and CV for the six technical replicates performed at each concentration. The error bars in the figure are ±2x SD calculated for each data point.
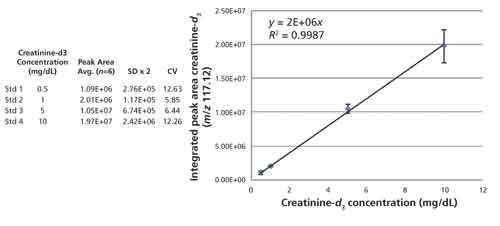
Figure 5: Plot of creatinine-d3 concentration versus integrated peak area for each of the control samples. The data are fit with a linear regression curve and the formula and residual squared term are embedded in the figure. The errors bars equal ±2x SD for each data point and the inset table contains the data used to construct the plot.
Table I shows the average value in milligrams per deciliter as calculated by MALDI-TOF-MS for albumin and creatinine along with the ACR as determined by the ratio of these two quantities from the triplicate analysis of 24 clinical urine samples. Table I also lists the same quantity measured by a clinically approved method from the identical sample alongside that of the MALDI-TOF-MS measurement. Linear regression analysis on plots of the data presented in Table I show that MALDI-TOF-MS and clinical data are well correlated for both the albumin (R2 = 0.87) and creatinine (R2 = 0.97) but the figure of merit for the analysis is the ARC and these data are displayed in Figure 6.
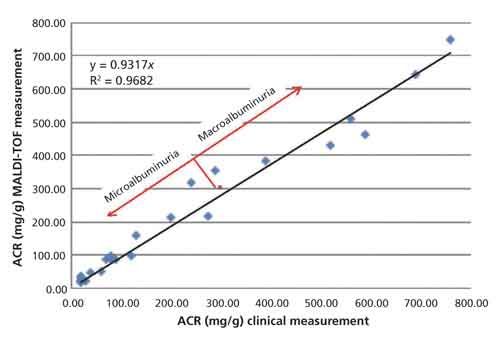
Figure 6: Plot of the ACR as determined by clinical methods versus MALDI-TOF MS. The data are fit with a linear regression curve and the formula and residual squared term are embedded in the figure. The red dot marks the 300 mg/g point at the boundary between micro- and macroalbuminuria.
Figure 6 is a plot of the ACR as reported by current clinical methods versus the ACR as determined by MALDI-TOF-MS. Linear regression analysis demonstrates that the measurements correlate well (R2 = 0.97) in cases of both micro- and macroalbuminuria.
Discussion
Generally speaking, proteins such as albumin do not belong in urine and their presence there is viewed as a signal of distress or malfunction of the kidneys. For this reason, albumin can-and does-serve as a biomarker for kidney function and it is routinely assayed in normal “health evaluations” (31,32) and routinely monitored in many cases of illness and disease. The detection of elevated albumin in urine is significant; however, because of the normal variability in urine concentration, the more clinically insightful measurement is the albumin concentration in relation to creatinine concentration, whose normal and relatively constant rate of release into urine serves as an indicator of overall urine concentration. Demonstrated herein are results for the quantitation of both albumin and creatinine from urine samples by MALDI-TOF-MS. The protocol as outlined enables the direct detection and measurement of the intact analytes from the same sample preparation, requiring merely a 10-fold dilution of a urine sample into MALDI-TOF matrix solution.
The MALDI-TOF-MS measurements of ACR correlate well (R2 = 0.97) when compared against ACR measurements done by immune-turbidity (albumin) and colorimetry (creatinine) performed in the hospital. The MALDI-TOF-MS work is preliminary and optimization and validation on a larger cohort of samples is required; regardless, we believe that the results offer compelling evidence for a useful assay. The choice to quantity albumin using multiply charged species was decided largely because of their prominence in the spectra observed at relevant concentrations in urine using the HCCA matrix, and this was a factor in choosing lysozyme (~mass range) as an internal standard. Regardless, lysozyme is not albumin and these molecules can be expected to ionize differently; therefore, an internal standard that more closely mimics albumin should improve the analysis by making relative quantitation possible. In theory, one could prepare a recombinant or chemically modified albumin for this purpose. Fortunately, a commercially available creatinine-d3 standard could be applied for this purpose in creatinine quantitation.
New methods for the analysis of clinically relevant analytes should always be welcomed if they offer advantages compared to current methodology. There are many factors to contribute to a successful method such as accuracy, sensitivity, precision, robustness, timeliness, ease-of-use, and cost. There are applications for routine clinical analyses for which MALDI-TOF-MS can offer advantages compared to current methodology in all of the above categories. Current linear-mode MALDI-TOF instrumentation can offer parts-per-million mass accuracy and ~nanomolar analyte sensitivity across a mass range of 1–1,000,000 Da (33). Precision in MALDI-TOF analyses is a consequence of thorough sample interrogation, and the use of high-repetition rate lasers (≥5000 Hz) accompanied by fine motion scanning (10–500 μm) results in the generation of thousands of spectra (individual data points) per sample. The accumulation and averaging of data on this scale leads to statistical precision in measurement. Efficient hardware surrounding sample loading and data acquisition and powerful computing for data processing make the rate-limiting step in the current analysis the time it takes for the sample to dry on the MALDI target (minutes). Current instrumentation is reliable, robust, and cost effective in use on a per-sample basis. Although the current protocol is focused on urine analysis, there is also demonstrated potential for the analysis of whole blood (34,35), serum (36,37), plasma (38), saliva (39,40), tears (41), and all manner of biological tissue (42,43).
Whereas ultimately successful analyte detection by MALDI-TOF-MS depends on that molecule’s ionization efficiency in relation to the other molecules present within the sample, simple enrichment or cleanup steps can be applied before detection with great effect in cases of interference (44–46). The decoupled nature of sample preparation and MALDI-TOF-MS analysis offers enormous potential for automation and high throughput, and we believe that any adoption of MALDI-TOF-MS for clinical analysis will expedite its application to other biomarker assays.
Conclusion
Demonstrated herein are results for the quantitation of both albumin and creatinine from urine samples by MALDI-TOF-MS. The results from the analysis correlate well (R2 = 0.97) when compared against measurements done by clinically approved methods and demonstrate compelling evidence for a useful assay.
References
- https://www.kidney.org/atoz/content/albuminuria, accessed 25 July 2016.
- http://www.mayoclinic.org/tests-procedures/microalbumin/home/ovc-20169675, accessed 25 July 2016.
- http://www.medicinenet.co, accessed 25 July 2016.
- http://www.medicinenet.com/script/main/art.asp?articlekey=19009, accessed 8 August 2016.
- http://www.chemistry.wustl.edu/~edudev/LabTutorials/Dialysis/Kidneys.html, accessed 8 August 2016.
- http://www.mayoclinic.org/diseases-conditions/kidney-disease/multimedia/how-kidneys-work-video/vid-20207497, accessed 8 August 2016.
- G. Bellinghieri, V. Savica, and D. Santoro, J. Ren Nutr. 18, 158–164 (2008).
- K.C. Tsao, T.L. Wu, P.Y. Chang, C.F. Sun, L.L. Wu, and J.T. Wu, J. Clin. Lab Anal.21, 426–431 (2007).
- J.L. Carter, C.R. Tomson, P.E. Stevens, and E.J. Lamb, Nephrol. Dial. Transplant.21, 3031–3037 (2006).
- G.C. Gobe, J.S. Coombes, R.G. Fassett, and Z.H. Endre, Expert Opin. Drug Metab. Toxicol.11, 1683–1694 (2015).
- B.A. Omotoso, E.M. Abdel-Rahman, W. Xin, J.Z. Ma, K.W. Scully, F.A. Arogundade, and R.A. Balogun, Clin. Nephrol.85, 1–11 (2016).
- M. Baumgarten and T. Gehr, Am. Fam. Physician. 84, 1138–1148 (2011).
- L.C. Plantinga, L.E. Boulware, J. Coresh, L.A. Stevens, E.R. Miller 3rd, R. Saran, K.L. Messer, A.S. Levey, and N.R Powe, Arch. Intern. Med.168, 2268–2275 (2008).
- C.E. Mogensen, N. Engl. J. Med.310, 356–360 (1986).
- F. Gobal, A. Deshmukh, S. Shah, and J.L. Mehta, J. Am. Coll. Cardiol.57, 2303–2308 (2011).
- http://www.mayoclinic.org/diseases-conditions/nephrotic-syndrome/basics/definition/con-20033385, accessed 12 August 2016.
- J.P. Forman and B.M. Brenner, Kidney Int.69, 22–28 (2006).
- C.D.A. Stehouwer and Y.M. Smulders, J. Am. Soc. Nephrol. 17, 2106–2111 (2006).
- P.A. McFarlane, Can. J. Diabetes.38, 372–375 (2014).
- W.G. Miller, D.E. Bruns, G.L. Hortin, S. Sandberg, K.M. Aakre, M.J. McQueen, Y. Itoh, J.C. Lieske, D.W. Seccombe, G. Jones, D.M. Bunk, G.C. Curhan, and A.S. Narva, Clin. Chem. 55, 24–38 (2009).
- http://www.mayoclinic.org/tests-procedures/creatinine-test/home/ovc-20179389, accessed 16 July 2016.
- https://labtestsonline.org/understanding/analytes/microalbumin/tab/test/, accessed 16 July 2016.
- H. Martin, Clin. Biochem. Rev.32, 97–102 (2011).
- J.W. Brinkman, S.J. Bakker, R.T. Gansevoort, H.L. Hillege, I.P. Kema, R.O. Gans, P.E. de Jong, and D. de Zeeuw, Kidney Int.66, S69–75 (2004).
- J.R. Delanghe and M. Speeckaert, Nephrology Dialysis Transplantation Plus 4, 83–86 (2011).
- O. Folin and J. L. Morris, Journal of Biological Chemistry17, 469–473, (1914).
- W.D. Comper, T.M. Osicka, and G. Jerums, Am. J. Kidney Dis. 41, 336–342 (2003).
- D. Sviridov, B. Meilinger, S.K. Drake, G.T. Hoehn, and G.L. Hortin, Clin. Chem.52, 389–397 (2006).
- D. Sviridov, S.K. Drake, and G.L. Hortin, Clin. Chem.54, 61–68 (2008).
- http://www.simultof.com/content/simultof-one, accessed 25 February 2016.
- N. Halbesma, D.S. Kuiken, A.H. Brantsma, S.J. Bakker, J.F. Wetzels, D. de Zeeuw, P.E. de Jong, and R.T. Gansevoort, J. Am. Soc. Nephrol. 17, 2582–2590 (2006).
- M. van der Velde, N. Halbesma, F.T. de Charro, S.J. Bakker, D. de Zeeuw, P.E. de Jong, and R.T. Gansevoort, J. Am. Soc. Nephrol. 20, 852–862 (2009).
- M.L. Vestal, J. Mass Spectrom. 44, 303–317 (2009).
- S.J. Hattan, K.C. Parker, M.L. Vestal, J.Y. Yang, D.A. Herold, and M.W. Duncan, J. Am. Soc. Mass Spectrom. 27, 532–541 (2016).
- K. Laks, T. Kirsipuu, T. Dmitrijeva, A. Salumets, and P. Palumaa, Protein J.35, 171–176 (2016).
- R. Bakry, M. Rainer, C.W. Huck, and G.K. Bonn, Anal. Chim Acta.690, 26–34 (2011).
- M.A. Karpova, S.A. Moshkovskii, I.Y. Toropygin, and A.I. Archakov, J. Proteomics.73(3), 537–551 (2010).
- W.D. Tian, J.Z. Li, S.W. Hu, X.W. Peng, G. Li, X. Liu, H.H. Chen, X. Xu, and X.P. Li, Int. J. Clin. Exp. Pathol.8, 9021–9031 (2015).
- M.W. Duncan, D. Nedelkov, R. Walsh, and S.J. Hattan, Clin. Chem.62, 134–143 (2016).
- A. Prodan, H. Brand, S. Imangaliyev, E. Tsivtsivadze, F. van der Weijden, A. de Jong, A. Paauw, W. Crielaard, B. Keijser, and E. Veerman, PLoS One. 11, 1–15 (2016).
- N. González, I. Iloro, J.A. Durán, F. Elortza, and T. Suárez, Mol. Vis. 18, 1572–1582 (2012).
- P. Chaurand and P.R.M. Caprioli, Electrophoresis. 23, 3125–3135 (2002).
- J. Kriegsmann, M. Kriegsmann, and R. Casadonte, Int. J. Oncol. 46, 893–906 (2015).
- B. Krastins, A. Prakash, D.A. Sarracino, D. Nedelkov, E.E. Niederkofler, U.A. Kiernan, R. Nelson, M.S. Vogelsang, G. Vadali, A. Garces, J.N. Sutton, S. Peterman, G. Byram, B. Darbouret, J.R. Pérusse, N.G. Seidah, B. Coulombe, J. Gobom, E. Portelius, J. Pannee, K. Blennow, V. Kulasingam, L. Couchman, C. Moniz, and M.F. Lopez, Clin. Biochem,46, 99–410 (2013).
- R.W. Nelson and C.R. Borges, J. Am. Soc. Mass Spectrom.22, 960–968 (2011).
- C. Wu, J. Duan, T. Liu, R.D. Smith, and W. Qian, J. Chromatogr. B Analyt. Technol. Biomed. Life Sci. 1021, 57–68 (2016).
Stephen J. Hattan, Kenneth C. Parker, and Marvin L. Vestal are with SimulTOF Systems in Marlborough, Massachusetts. Jane Y. Yang is with the Department of Pathology at the University of California San Diego in La Jolla, California. David A. Herold is with the Department of Pathology at the University of California San Diego and the VA San Diego Healthcare System, PALMS, in San Diego, California. Mark W. Duncan is with the Division of Endocrinology, Metabolism, and Diabetes at the University of Colorado School of Medicine in Aurora, Colorado. Direct correspondence to: Stephen.hattan@simultof.com
Mass Spectrometry for Forensic Analysis: An Interview with Glen Jackson
November 27th 2024As part of “The Future of Forensic Analysis” content series, Spectroscopy sat down with Glen P. Jackson of West Virginia University to talk about the historical development of mass spectrometry in forensic analysis.
Detecting Cancer Biomarkers in Canines: An Interview with Landulfo Silveira Jr.
November 5th 2024Spectroscopy sat down with Landulfo Silveira Jr. of Universidade Anhembi Morumbi-UAM and Center for Innovation, Technology and Education-CITÉ (São Paulo, Brazil) to talk about his team’s latest research using Raman spectroscopy to detect biomarkers of cancer in canine sera.