Single-Particle ICP-MS: A Key Analytical Technique for Characterizing Nanoparticles
Spectroscopy
The National Nanotechnology Initiative defines engineered nanomaterials (ENM) as those with dimensions of 1–100 nm, where their unique characteristics enable novel applications to be carried out. ENMs often possess different properties than their bulk counterparts of the same composition, making them of great interest for a broad spectrum of industrial, commercial, and health care uses. However, the widespread application of ENMs will inevitably lead to their release into the environment, which raises concerns about their potential adverse effects on the ecosystems and their impact on human health.
The National Nanotechnology Initiative defines engineered nanomaterials (ENM) as those with dimensions of 1–100 nm, where their unique characteristics enable novel applications to be carried out. ENMs often possess different properties than their bulk counterparts of the same composition, making them of great interest for a broad spectrum of industrial, commercial, and healthcare uses. However, the widespread application of ENMs will inevitably lead to their release into the environment, which raises concerns about their potential adverse effects on the ecosystems and their impact on human health.
This installment of “Atomic Perspectives” discusses the theory of single-particle inductively coupled plasma–mass spectrometry (SP-ICP-MS) and its use in characterizing and sizing metal-based nanoparticles. The single-particle analytical technique can quantitate the difference between ionic and particulate signals, measure the particle concentration (particles per milliliter), and determine the particle size and size distribution. In addition, it enables users to investigate particle agglomeration and dissolution. As a result, SP-ICP-MS is a key analytical technique in assessing the fate, behavior, and distribution of ENMs in various sample matrices. Besides discussing its fundamental principles, the real-world applicability of SP-ICP-MS will be exemplified by evaluating its capability in various sample matrices (1).
The unique properties of engineered nanoparticles (ENPs) have made them an essential component of many consumer, industrial, and healthcare products and as a result created intense interest in their environmental behavior (2). For this reason, it is not only important to know the type, size, and distribution of nanoparticles in soils, potable waters, and wastewaters, but it is also crucial to understand their environmental cycle. Therefore, to ensure the future development of nanotechnology products, there is clearly a need to evaluate the risks posed by these ENPs that will require proper tools to fully understand their impact on the ecosystem. Current approaches to assess exposure levels include predictions based on computer modeling, together with direct measurement techniques. Predictions through modeling are based on knowledge of how they are emitted into the environment and by their behavior in the samples being studied. Although the life cycles of ENPs are now starting to be understood, very little is known about their environmental behavior. Prediction through life-cycle assessment modeling requires validation through measurement at environmentally significant concentrations. For ENPs that are being released into the environment, extremely sensitive methods are required to ensure that direct observations are representative in time and space. ENPs differ from most conventional ‘‘dissolved’’ chemicals in terms of their heterogeneous distributions in size, shape, surface charge, composition, degree of dispersion, and so on. For this reason, it is not only important to determine their concentrations, but also these other important metrics.
Analytical Methodologies
The measurement and characterization of nanoparticles is therefore critical to all aspects of nanotechnology. In the field of environmental health, it has become clear that complete characterization of nanomaterials is important for interpreting the results of toxicological and human health studies. Metal-containing ENPs are a particularly significant class because their use in consumer products and industrial applications makes them the fastest growing category of nanoparticles (3).
Many analytical techniques are available for nanometrology, only some of which can be successfully applied to environmental health studies. Methods for assessing particle size distributions include electron microscopy, chromatography, laser-light scattering, ultrafiltration, and field-flow fractionation. However, the lack of specificity of these techniques is problematic for complex environmental matrices that may contain natural nanoparticles having polydisperse size distributions and heterogeneous compositions. For this reason, sensitive detection techniques are needed if specific information about the elemental composition and concentration of the nanoparticles is required. Unfortunately, difficulties can also arise with some detection techniques due to a lack of sensitivity for characterizing and quantifying particles at environmentally relevant concentrations.
The Role of SP-ICP-MS
One technique that is proving invaluable for detecting and sizing metallic nanoparticles is SP-ICP-MS (4). Its combination of elemental specificity, sizing resolution, and unmatched sensitivity makes it extremely applicable for the characterization of ENPs containing elements such as Ag, Au, Ti (TiO2), and Si (SiO2), to name a few, which have been integrated into larger products such as consumer goods, foods, pharmaceuticals, and personal care products.
Much of the early work has focused on the use of ICP-MS with particle separation techniques, such as field-flow fractionation and chromatography (5). However, more recently, SP-ICP-MS is showing a great deal of promise in several application areas, including the determination of silver nanoparticle concentrations in complex samples (5). This technique is suited to differentiate between the analyte in solution and existing as a nanoparticle without any prior separation techniques, simplifying nanoparticle analysis while eliminating complex sample preparation steps (6). This ability allows SP-ICP-MS to provide information on the size and size distribution of nanoparticles, as well as the dissolved concentration of the analyte.
Fundamental Principles of SP-ICP-MS
SP-ICP-MS involves introducing nanoparticle-containing samples at environmentally significant concentrations into the ICP-MS system and collecting time-resolved data. Because of the very low elemental concentrations and the transient nature of ionized nanoparticles, high sensitivity and very short measurement times are necessary to ensure the detection of individual particles as ion pulses (7,8). The number of observed pulses at the detector is related to the nanoparticle concentration by the nebulization efficiency and the total number of nanoparticles in the sample, while the size of the nanoparticle is related to the pulse intensity. Figure 1 represents the full cycle process of characterizing the size of nanoparticles that have been released into the environment from a manufactured product using SP-ICP-MS.
Figure 1: Flow diagram of the process of sizing nanoparticles using SP-ICP-MS.
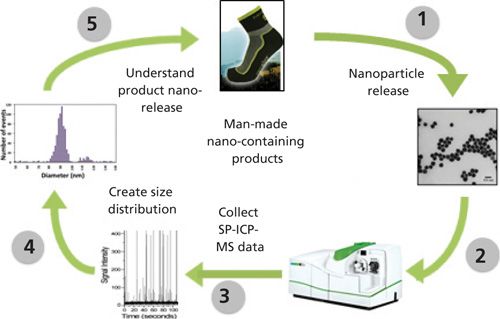
In this example, nano-Ag bactericide imbedded in athletic socks is released during simulated wash cycles (step 1, Figure 1). By analyzing a simple aqueous solution with the ICP-MS system (step 2) and collecting data using the SP-ICP-MS technique (step 3), the size, size distribution, concentration, and associated dissolved material can be quantified. The dissolved Ag content is at low signal intensity, with nanoparticles creating pulses above this background where the height of the pulse relates to the mass of analyte and the number of pulses correlates to the concentration of nanoparticle in the samples. The size distribution of particles in the sample can be calculated using well-understood SP-ICP-MS theory (step 4) (9). A histogram of nanoparticle diameter versus number of events (nanoparticle number) can then be created to visualize the nanoparticle distribution in the sample, in addition to calculating the concentration of both nanoparticle and dissolved fractions released from the products (step 5). Let’s take a closer look at the individual steps in this process.
Detecting Single Particles by ICP-MS
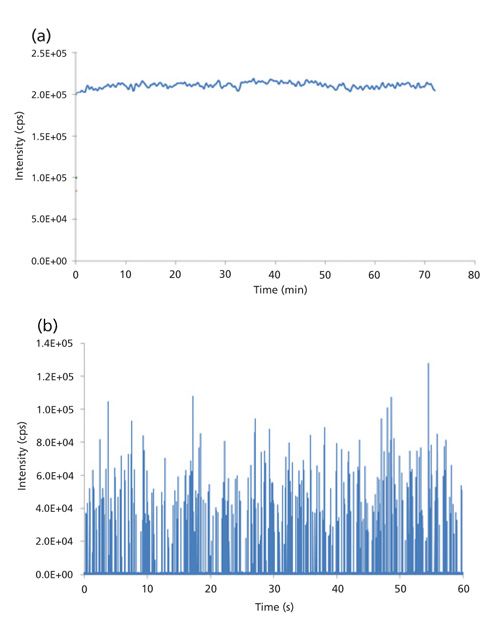
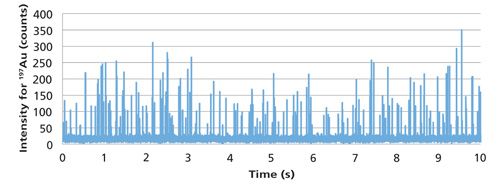
Effectively detecting and measuring single, individual nanoparticles with ICP-MS requires operating the instrumentation in a different manner than when analyzing dissolved samples. Figure 2 shows traces from both dissolved- and single-nanoparticle analyses. In Figure 2a, a steady-state signal results from measuring dissolved elements; the output when detecting single particles is quite different, as illustrated for 60-nm silver particles in Figure 2b. Each spike in Figure 2b represents a particle. The difference in the way these data are generated plays a key role in understanding single particle analysis. The easiest way to understand this is to compare the processes involved when both dissolved elements and particles are measured.
Figure 2: (a) A continuous signal from measuring a dissolved analyte. (b) A signal from measuring 60-nm silver nanoparticles.
Analyzing Dissolved Ions with ICP-MS
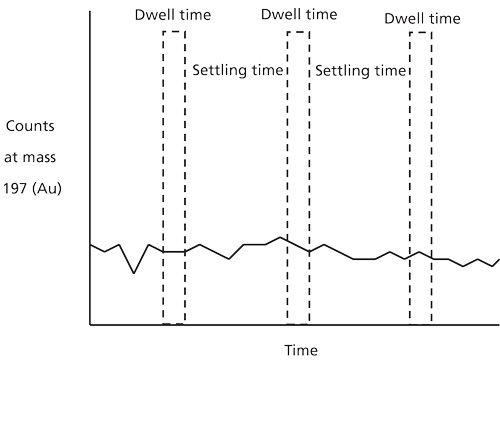
When dissolved elements are measured, aerosols enter the plasma where the droplets are desolvated and ionized. The resulting ions enter the quadrupole to be sorted by their mass-to-charge ratios (m/z). The quadrupole spends a certain amount of time at each mass before moving to the next mass; the time spent analyzing each mass is called the “dwell time.” After each dwell time measurement, a certain amount of time is spent for the electronics to stabilize before the next measurement is performed. This stabilization time is called “settling time”-that is, overhead and processing time. When analyzing dissolved elements, the resulting signal is essentially a steady-state signal. However, considering the dwell and settling times, a significant amount of the signal is not measured because of the settling time of the electronics, a critical aspect when analyzing nanoparticles, as shown in Figure 3. It is important to point out that with dissolved ions, the part of the signal that is missed is not critical because the elements are dissolved and produce a continuous signal.
Figure 3: A continuous signal for gold, showing the dwell and settling times-data are collected only during the dwell time window.
Single-Particle Analyses with ICP-MS
Particles present in an aqueous solution are introduced to the plasma the same way as dissolved solutions. As the droplets are desolvated in the plasma, the resulting particles are ionized producing a burst of ions (one ion cloud per particle). The ions then pass into the quadrupole. However, using conventional ICP-MS data collection, alternating between dwell time and settling time, ion clouds are not always detected. If, for example, the ion cloud happens to fall within the dwell time window, it will be detected. Otherwise, if it passes into the quadrupole or reaches the detector during the settling time, it will not be detected, leading to an inaccurate counting efficiency. Figure 4 shows that an ion cloud from a single particle can be missed if it falls outside of the dwell time window, as demonstrated by the first and third dwell time windows. However, when the ion cloud from a single particle falls within the dwell time window, it is detected, as represented by the peak falling within the second dwell time window. When multiple particles are detected in rapid succession, the resulting signal is a series of peaks, each one originating from a particle, as shown in Figure 5.
Figure 4: Signal from a single nanoparticle of gold falling outside of the dwell time measurement window will not be detected, while the signal from a single nanoparticle falling within the measurement window will be detected.
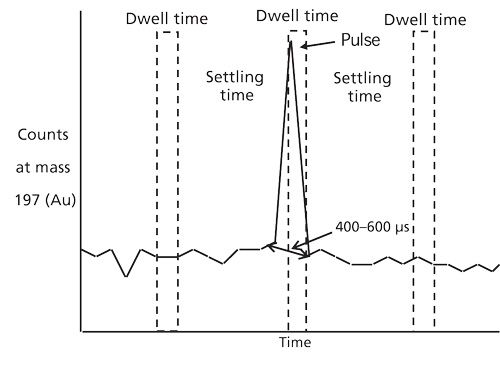
Figure 5: Signals from multiple nanoparticles falling within the dwell time measurement windows will be detected.
The Timing Parameters of SP-ICP-MS
Figure 6 is a representation of the timing parameters involved in ICP-MS analysis. The three axes represent signal intensity, mass (m/z), and time. With conventional analyses of dissolved ions, the mass and intensity axes are the most important: The resulting spectra are plots of m/z versus intensity. The time axis is important when analyzing a transient signal. The quadrupole scan speed is important when measuring multiple elements in a transient signal, such as for laser ablation or multielement speciation analyses.
Figure 6: The timing parameters used in an ICP-MS analysis.
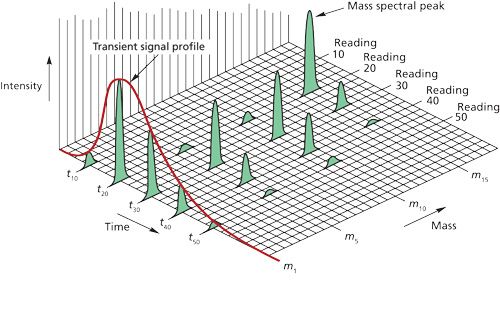
However, when measuring transient signals for a single mass, the time axis (transient data acquisition speed in Figure 6) becomes important, since enough data points must be acquired to define the peak. For example, with high performance liquid chromatography (HPLC)–ICP-MS, usually 4–10 points per second are enough to define a peak. Comparing HPLC peaks to single-particle signals, the ion packets from each particle are typically 1000 times narrower than peaks produced by HPLC. Therefore, data must be acquired significantly faster for single-particle analysis. Since only a single mass is typically being measured for single particle analysis, the quadrupole scan speed is not important, and the time axis becomes the “transient data acquisition speed,” which encompasses both the dwell and settling times. For that reason, the faster the transient data acquisition speed, the better suited the system is for single-particle analysis.
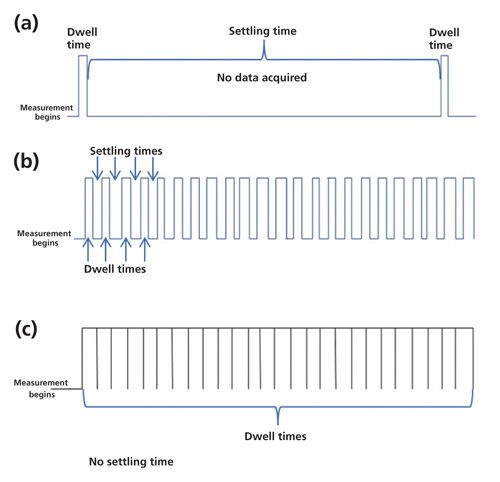
In SP-ICP-MS, transient data acquisition speed consists of two parameters: dwell time (reading time) and settling time (overhead and processing time). It is very important that the ICP-MS is able to acquire signals at a dwell time that is shorter than the particle transient time, therefore avoiding false signals generated from partial particle integration, coincidence and agglomerates or aggregates. The shorter the settling time, the less chance there is of missing a particle. Figure 7 demonstrates the importance of settling time using a constant 100-μs dwell time and a constant time window. In Figure 7a, there are only two 100-μs windows to detect particles; the rest of the time is overhead, where data cannot be acquired. In this case, there are only about 100 measurements made in one second. Therefore, most of the time is wasted by scanning and settling. Figure 7b is the same time scale, but with a settling time of 100 μs. Therefore, more time is spent measuring and looking for nanoparticles-about 5000 measurements in one second. However, still half of the time is wasted. Figure 7c represents the ideal situation with no settling time. This allows for 10,000 measurements per second, with no wasted time being spent scanning and settling-the ideal situation for SP-ICP-MS.
Figure 7: Effect of settling time and dwell time on ICP-MS measurements: (a) Settling time is much longer than the dwell time; (b) settling time is equal to the dwell time; and (c) settling time is eliminated.
Another benefit of fast continuous data acquisition is that multiple points can be measured from a single particle, thus eliminating the chances that particles are missed or that only partial ion clouds from particles are detected. Figure 8 shows how this can be accomplished. In Figure 8a, the signal from a single particle is measured multiple times. The signal from each time slice is plotted, which defines the peak. When multiple particles are detected, the resulting peaks are a series of time slices, as shown in Figure 8b.
Figure 8: The effect of measuring multiple measurements per particle: (a) for a single particle and (b) for multiple particles detected in series.
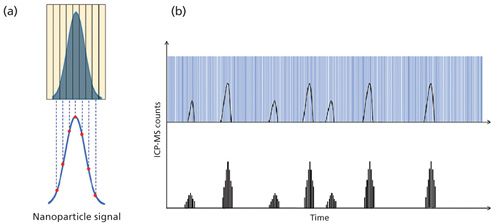
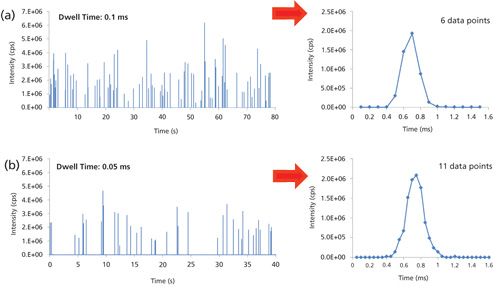
Figure 9 shows how typical single-particle responses can be converted into peaks that define a single particle. In Figure 9a, data was collected in fast continuous mode (no settling time) with a dwell time of 100 μs. When the intensities from the first 1.6 s are plotted, it is seen that six points define a peak. In Figure 9b, the dwell time was reduced to 50 μs, which leads to twice as many data points being acquired. As a result, the peak shape is defined by 12 points, leading to a different peak shape. These examples demonstrate the benefit of sampling multiple data points per particle.
Figure 9: Ability to acquire multiple measurements per particle: (a) six data points per particle; (b) 12 data points per particle.
Converting Nanoparticle Pulse Counts to Nanoparticle Diameter
It is important to emphasize that ICP-MS is a mass-based technique where particle size is determined by relating the pulse intensity to an elemental mass. With traditional ICP-MS analysis, the first step in this process is to create a calibration curve using dissolved standards. This curve connects the signal intensity from the instrument to the concentration of the analyte entering the plasma. The next step is to relate the concentration of the dissolved analyte to a total analyte mass that enters the plasma during each reading. This relationship between analyte concentration and the mass observed per event is called the “mass flux,” which is highly dependent on the transport efficiency of the sampling process. This transport efficiency must be calculated for each instrument and under the given run conditions for the mass flux to be accurate. In this way, the resulting calibration curve relates signal intensity (counts/event) to a total mass transported into the plasma per event.
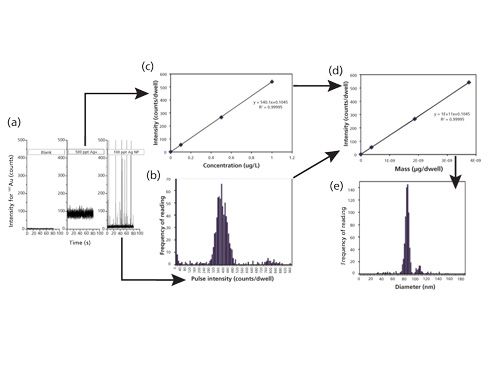
By using well-understood SP-ICP-MS principles, the intensity of each individual pulse (counts/event) can then be transformed using the mass flux calibration curve to determine the particle mass, which can then easily be converted to particle diameter, by knowing the density and assuming the geometry (shape) of the particle is spherical (10). This process is exemplified in Figure 10, which shows a signal of multiple silver nanoparticles over time (Figure 10a), with an individual pulse at the bottom left (Figure 10b) and the dissolved ionic calibration curve on the top (Figure 10c). On the top right is shown the mass of the particle (in micrograms) per dwell time after nebulizer efficiency and flow rate have been applied (Figure 10d). The mass of the nanoparticle is then converted to a diameter, which is based on the mass fraction and the density, which is based on the shape of the particle (Figure 10e).
Figure 10: The fundamental principles of converting nanoparticle pulse counts to diameter of the nanoparticle (10).
Let’s now take a look at the real-world applicability of SP-ICP-MS by evaluating its capability and suitability for characterizing nanoparticles in some common sample matrices, including surface waters and human blood.
Assessing the Fate of Silver Nanoparticles in Surface Water Using SP-ICP-MS
Most analytical techniques are not suitable for environmental matrices, because nanoparticle concentrations are typically very low (11). Historically, particle size has been measured by dynamic light scattering (DLS), nanoparticle tracking analysis (NTA), and transmission electron microscopy (TEM), while dissolved content has been measured by ultrafiltration. These common techniques have known limitations for measuring low concentrations in the presence of colloidal species in complex waters.
On the other hand, SP-ICP-MS has been found to be a promising technique for detecting and characterizing metal nanoparticles at very low concentrations. Silver nanoparticles are one of the most frequently studied types of nanoparticles, because they are among the most common nanomaterials found in consumer products such as laundry detergents and personal hygiene products and tend to release free Ag ions, especially at low concentrations. The aim of this study was to investigate the use of SP-ICP-MS for the detection and characterization of metal nanoparticles in environmental waters where they can be involved in various physicochemical processes.
It is important to point out these types of dissolved species can also be determined by ultrafiltration followed by total metal quantification using ICP-MS or atomic absorption spectrometry. However, this procedure is time consuming since it requires the preequilibration of the filtration membrane for at least three cycles of centrifugation, which is typically 20 min each (12). Additionally, aggregates and remaining stable silver nanoparticles can be counted and measured by other commonly used techniques (DLS, TEM) but SP-ICP-MS is the only practical method that can distinguish between silver nanoparticles and other colloids in surface waters in a timely manner.
Experimental
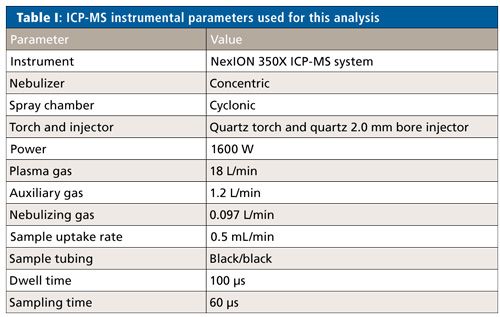
The ICP-MS system (NexION 350X, PerkinElmer Inc.,) instrumental parameters used for this analysis are given in Table I. SP-ICP-MS data acquisition was carried out using the instrument’s Syngistix Nano Application software module (13). The sample introduction system consisted of a quartz cyclonic spray chamber, a type C0.5 concentric glass nebulizer, and a 2-mm-bore quartz injector.
Commercially available suspensions of gold and silver nanoparticles were used in this work. A reference material (NIST 8013) consisting of a suspension of gold nanoparticles (60 nm nominal diameter, 50 mg/L total mass concentration and stabilized in a citrate buffer) was used to determine the nebulization efficiency. Suspensions of silver nanoparticles were used, including citrate-coated (40 and 80 nm nominal diameter) and bare (80 nm nominal diameter) nanosilver suspensions (Ted Pella Inc.).
The surface water was sampled in Rivière des Prairies (Montreal, Canada) and filtered with 0.2-μm filter paper before spiking with silver nanoparticles. Silver nanoparticle suspensions were added to water samples with concentrations ranging from 2.5 to 33.1 μg Ag/L and left to equilibrate under continuous and gentle shaking. Before SP-ICP-MS analysis, small aliquots of the samples were diluted to below 0.2 μg Ag/L.
Data acquisition was performed in triplicate for each sample, and deionized (DI) water was analyzed between replicates to check memory effects. As shown in Figure 11, the Syngistix Nano Application Module generates plots of frequency versus size (nanometers) plots with an interactive focusing window, eliminating the need for any subsequent data processing using theoretical equations described earlier.
Figure 11: The Syngistix Nano Application Module software generates a plot frequency of events (pulses) vs. size (diameter, nm) of nanoparticles with an interactive focusing window.
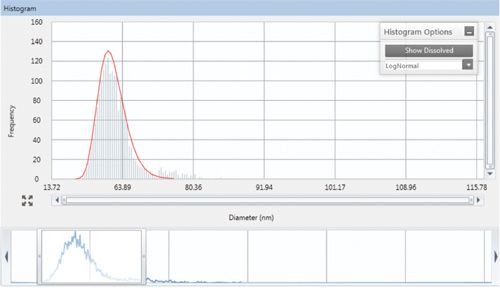
As previously described, SP-ICP-MS data processing is based on distinguishing between the signal of dissolved metal and that of nanoparticles, counting the pulses (or events) corresponding to individual nanoparticles and converting their intensities to particle size. The frequency of the events (pulses) provides particle number concentration, and the intensity of each pulse is proportional to the mass of analyte. The latter was converted to volume and then into size knowing the density and the geometry of the particle using the Syngistix Nano Application module for fully automated data acquisition; subsequent manual data processing is not required.
Results
Even after filtration of surface waters at 0.2 μm, an NTA system (LM14, NanoSight Ltd.) with a green laser at 532 nm showed the presence of colloidal particles with an average diameter of approximately 110 nm. Therefore, the addition of metal nanoparticles to this complex matrix will make their detection and characterization very difficult, if not impossible, with commonly used techniques such as DLS and TEM because they lack specificity to elemental composition.
Furthermore, even the determination of the dissolved fraction that is usually performed by ultrafiltration may be inadequate because silver ions could adsorb onto the surface of the colloids and, therefore, be retained by the filtration membrane. As a result, the proportion of dissolved metal will be underestimated. SP-ICP-MS measurements were found to be more effective and to have fewer limitations than other techniques. Additionally, the presence of other insoluble particles does not interfere with the analysis of silver nanoparticles, as the Ag signal is recorded independently of the other constituent elements of the colloids.
The study carried out further investigations to better understand the evolution of the average particle diameter and the percentage of dissolved metal over time in both pure and river water (14). The individual data will not be presented here, but in all cases, the average particle size of the persistent nanoparticles remains substantially constant. For suspensions of particles with a nominal diameter greater than 40 nm, between 50 and 80% of the particles persist for at least five days of equilibration in pure and surface water. Under the experimental conditions of this work, the coating appears to have no significant effect on the dissolution of nanoparticles over time-both citrate-coated and bare silver nanoparticle (80 nm) suspensions showed a slight decrease of particulate silver by approximately 20% during five days. Additionally, for the same size and equilibration time, the proportion of dissolved silver was found higher in the case of citrate-coated silver nanoparticles. This does not necessarily mean that bare nanosilver is more stable than citrate-coated silver nanoparticles. It could be that the release of silver ions may be due to oxidation to residual Ag ions adsorbed on the surface of silver nanoparticles or bonded to the coating. We believe that the stability and behavior of nanoparticles in any medium will depend on the synthesis procedure. This is supported by the fact that smaller particles with a nominal diameter below 40 nm tend to dissolve at a faster rate.
Determination of Gold and Silver Nanoparticles in Blood Using SP-ICP-MS
The small size of nanoparticles and their potential for enhanced reactivity resulting from larger surface area per volume has raised concerns about their adverse effects on human health. Although these properties may enhance their desired application benefits, they may also introduce new, unwanted toxic effects (15). Two metal nanoparticles, gold nanoparticles and silver nanoparticles, have been widely studied. Gold nanoparticles are particularly interesting due to their desired intrinsic properties such as high chemical stability, well-controlled size and surface functionalization, while silver nanoparticles, due to their antibacterial properties, are often applied in wound disinfection and in coatings of medical devices and prostheses, and also in commercial textiles, cosmetics and household goods (16). As a result, concerns have been raised about the migration of silver nanoparticles from bandages or medical devices into open wounds and thus, the blood stream. These concerns emerge from recent publications showing that nanoparticles can directly be taken up by the exposed organs and are able to translocate using the blood stream to secondary organs, such as the central nervous system, potentially affecting the growth characteristics of embryonic neural precursor cells (17). Therefore, the need exists for researchers to detect and measure nanoparticles in blood. The work described here explores the ability of SP-ICP-MS to detect and measure gold and silver nanoparticles in whole blood (18).
Experimental Samples, and Sample Preparation
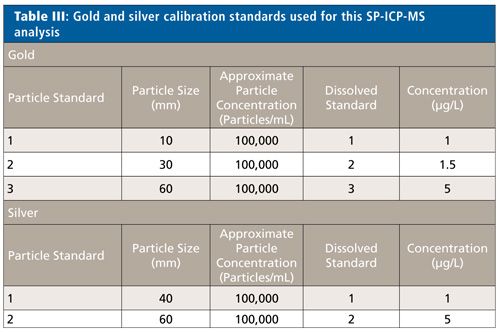
A blood Standard Reference Material (Seronorm Trace Elements in Whole Blood, Level I) was diluted 20 times with tetramethylammonium hydroxide (TMAH) plus 0.1% Triton-X. Gold and silver nanoparticles (gold-30 and 60 nm, NIST 8012, 8013; silver-40 and 60 nm, Ted Pella Inc.) were added to each blood sample at various concentrations. To break up any agglomerated particles, the stock solutions were sonicated for 5 min before spiking in the blood. The blood samples were manually shaken before analysis.
Instrumentation
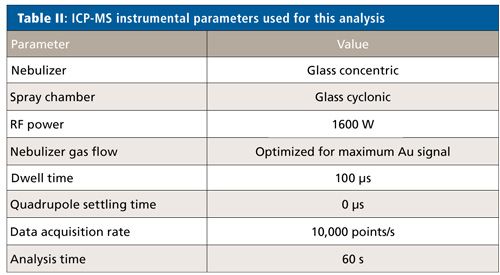
The ICP-MS system (NexION 350X, PerkinElmer, Inc.) instrumental parameters used for this analysis are given in Table II. SP-ICP-MS data acquisition was carried out using the instrument’s Syngistix Nano Application software module. Calibrations were carried out with both dissolved and particulate gold or silver standards, which are shown in Table III.
Two rinses were used between samples: 1% HCl plus 0.1% Triton-X was aspirated to dissolve and remove any residual gold particles, followed by deionized water to remove traces of the hydrochloric acid. A solution of 1% HNO3 plus 0.1% Triton-X was used as a rinse solution for silver particles. This two-solution rinse approach was found to be essential because residual acid could dissolve particles in the sample. Each rinse solution was aspirated for 1 min.
Results
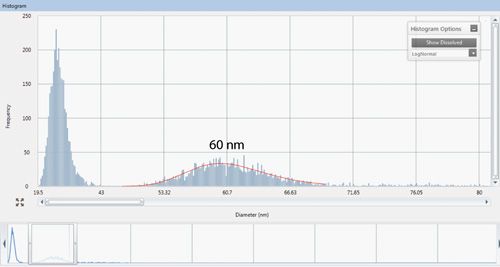
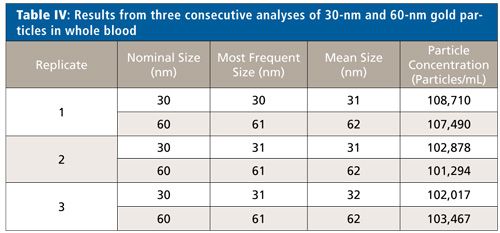
Initial tests were performed with gold nanoparticles. Figure 12 shows a blood sample spiked with a mixture of 30- and 60-nm Au nanoparticles (each approximately 100,000 particles/mL). There are clearly two size distributions, indicating that both particle sizes are seen. This sample was analyzed three times consecutively, with the measured particle sizes shown in Table IV. These results demonstrate both accuracy and repeatability of the methodology.
Figure 12: Detection of 30-nm and 60-nm gold nanoparticles spiked into whole blood.
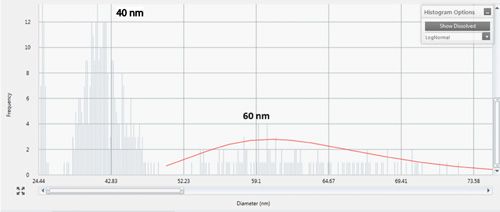
Next, 40- and 60-nm Ag nanoparticles were added to the blood samples so that the final, total particle concentration was about 200,000 particles/mL. Figure 13 displays the detected particle distribution, and Table V shows results for three replicates of the spiked blood sample. It’s worth pointing out that the software module first converts the peak area intensity into mass and the resulting mass into diameter. This is then displayed as frequency of events versus nanoparticle diameter, as described earlier.
Figure 13: Detection of 40-nm and 60-nm silver nanoparticles spiked into whole blood.
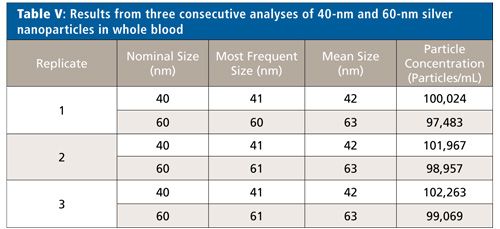
To see if lower particle concentrations could be detected in blood, only 40-nm Ag nanoparticles were spiked into the blood samples at a nominal concentration of 50,000 particles per milliliter, half the concentration of the previous analysis. The data shown in Table VI demonstrate that even at low concentrations, Ag nanoparticles can be accurately and reproducibly measured in blood.

As has been shown, measuring single particles with ICP-MS is quite different than measuring dissolved species. The most important factor when measuring single particles is the speed at which data can be acquired: since particle ionization events are on the order of microseconds, rapid data acquisition and elimination of the settling time between measurements are crucial. Continuous measurement allows multiple readings per particle ionization event, which results in more-accurate size determinations. For SP-ICP-MS analysis, continuous data acquisition at a dwell time shorter than or equal to 100 μs is the most important instrumental requirement for precise nanoparticle counting and sizing.
The investigation has also shown that when using automated data acquisition software optimized for SP-ICP-MS measurements, it is possible to study the behavior of silver nanoparticles in surface water without using any subsequent manual data processing. The technique has allowed the effective and selective measurement of changing particle size, aggregation and dissolution over time at low concentrations. Based on these data, SP-ICP-MS is uniquely suited to provide such information on the fate of metal nanoparticles at very low concentrations in environmental surface waters. This work has also demonstrated the ability of SP-ICP-MS to rapidly and accurately detect and measure gold and silver nanoparticles in whole blood, both at low concentrations and in mixtures. Although this study has just focused on gold and silver nanoparticles in surface waters and blood samples, there is no doubt that it is applicable to other types of metal and metal oxide nanoparticles in a variety of complex matrices including wastewater, effluents, culture media, as well as biological tissue and fluids (19,20).
References
- White Paper: Weighing the Benefits and Risks of Nanotechnology, Single Particle ICP-MS Compendium of Applications, PerkinElmer Nanomaterial Reference Library, https://www.perkinelmer.com/lab-solutions/resources/docs/Nanomaterials_SP-ICP-MS_Compendium(012982_01).pdf
- Nanotech-Enabled Consumer Products Continue to Rise: The Project on Emerging Nanotechnologies, 2017, http://www.nanotechproject.org/news/archive/9231/
- J. W. Olesik and P. J. Gray, J. Anal. At. Spectrom.27, 1143 (2012).
- D.M. Mitrano, A. Barber, A. Bednar, P. Westerhoff, C.P. Higgins, and J.F. Ranville, J. Anal. At. Spectrom.27, 1131–1142 (2012).
- D.M. Mitrano, E.K. Leshner, A. Bednar, J. Monserud, C.P. Higgins, and J.F. Ranville, Environ. Toxicol. Chem.31(1), 115–121 (2012).
- F. Laborda et.al., J. Anal. At. Spectrom.26(7), 1362–1371 (2011).
- A. Hineman and C. Stephan, J. Anal. At. Spectrom.29, 1252–1257 (2014).
- M.D. Montano, H.R. Badiei, S. Bazargan, and J.F. Ranville, Environ. Sci.: Nano, DOI: 10.1039/c4en00058g (2014).
- C. Degueldre and P. Y. Favarger, Colloids and Surfaces A: Physicochem. Eng. Aspects217, 137–142 (2003).
- H.E. Pace, J. Rogers, C. Jarolimek, V.A. Coleman, C.P. Higgins, and J.F. Ranville, Anal. Chem.83(24), 9361–9369 (2011).
- R.F. Domingos et al., Environ. Sci. Technol.43(19), 7277–7284 (2009).
- M. Hadioui, S. Leclerc, and K.J. Wilkinson Talanta105(0), 15–19 (2013).
- Syngistix Nano Application Module for Single Particle ICP-MS: PerkinElmer Nanomaterials Reference Library, http://www.perkinelmer.com/catalog/product/id/N8140309 (2014).
- M. Hadioui, K. Wilkinson, and C. Stephan, PerkinElmer Nanomaterial Reference Library, http://www.perkinelmer.com/resources/nanomaterials-reference-library.xhtml (2014).
- X. Chen, and H.J. Schluesener, Toxicology Letters176, 1–12 (2008).
- L. Sintubin , W. Verstraete, and N. Boon, Biotechnol. Bioeng.109, 24222–22436 (2012).
- E. Soderstjerna , F. Johansson, B. Klefbohm , and U.E. Johansson, Plos One, 8-3:58211 (2013).
- C. Stephan and K. Neubauer, “Determination of Gold and Silver Nanoparticles in Blood Using Single Particle ICP-MS,” PerkinElmer Nanomaterial Reference Library, http://www.perkinelmer.com/resources/nanomaterials-reference-library.xhtml (2014)
- E. Grey, C.P. Higgins, and J.E Ranville, “Analysis of Nanoparticles in Biological Tissues Using SP-ICP-MS,” PerkinElmer Nanomaterial Reference Library, http://www.perkinelmer.com/resources/nanomaterials-reference-library.xhtml (2014)
- C-P. Cirtui, N. Fleury, and C. Stephan, “Assessing the Fate of Nanoparticles in Biological Fluids Using SP-ICP-MS,” PerkinElmer Nanomaterial Reference Library, http://www.perkinelmer.com/resources/nanomaterials-reference-library.xhtml (2014)

Chady Stephan holds a PhD in analytical chemistry from Université de Montréal. He leads a multifunctional team at PerkinElmer Inc, composed of technical marketing, application scientist and business strategist focusing on delivering complete market solutions. He has over 20 peer-reviewed papers and book chapters credited to his name. Over the past few years, his main research activities have been in developing single-particle ICP-MS and more recently single-cell ICP-MS techniques.

Robert Thomas is principal of Scientific Solutions, a consulting company that serves the application and writing needs of the trace element user community. He has worked in the field of atomic and mass spectroscopy for more than 40 years and has written over 80 technical publications including a 15-part tutorial series on ICP-MS. He recently completed his third textbook entitled Practical Guide to ICP-MS: A Tutorial for Beginners. He has an advanced degree in analytical chemistry from the University of Wales, UK, and is also a Fellow of the Royal Society of Chemistry (FRSC) and a Chartered Chemist (CChem).

Applications of Micro X-Ray Fluorescence Spectroscopy in Food and Agricultural Products
January 25th 2025In recent years, advances in X-ray optics and detectors have enabled the commercialization of laboratory μXRF spectrometers with spot sizes of ~3 to 30 μm that are suitable for routine imaging of element localization, which was previously only available with scanning electron microscopy (SEM-EDS). This new technique opens a variety of new μXRF applications in the food and agricultural sciences, which have the potential to provide researchers with valuable data that can enhance food safety, improve product consistency, and refine our understanding of the mechanisms of elemental uptake and homeostasis in agricultural crops. This month’s column takes a more detailed look at some of those application areas.
Trending on Spectroscopy: The Top Content of 2024
December 30th 2024In 2024, we launched multiple content series, covered major conferences, presented two awards, and continued our monthly Analytically Speaking episodes. Below, you'll find a selection of the most popular content from Spectroscopy over the past year.