The Importance of Fourier-Transform Infrared Spectroscopy in the Identification of Carbonate Phases Differentiated in Magnesium Content
Spectroscopy
In this study, FT-IR spectroscopy was used for identification of carbonate minerals in limestone with variable contents of magnesium. Associated spectral bands were identified and assigned. Results of studies of Triassic limestone samples taken from the area of the Polish part of the Germanic Basin using FT-IR are presented. The results of research show that substitution of Ca2+ by Mg2+ in the carbonate phase lattices leads to a continuous wavenumber increase in the assigned band locations.
This article theorizes about the importance and usability of Fourier transform infrared (FT-IR) spectroscopy in the identification of carbonate phases varying in magnesium content. Results of studies of Triassic limestone samples taken from the area of the Polish part of the Germanic Basin using this method are presented. The following phases were analyzed: a low-magnesium (Mg) calcite, a high-Mg calcite, a dolomite, and a huntite. These carbonate phases were identified on the basis of the peak wavenumbers that are present in the infrared absorption spectra. Low-Mg calcite dominates in the limestones, with some samples having a lower amount of high-Mg calcite. Moreover, dolomite and huntite were identified. The results of research show that substitution of Ca2+ by Mg2+ in the carbonate phase lattices leads to a continuous wavenumber increase in the band locations. Therefore, FT-IR spectroscopy was used for identification of carbonate minerals with variable contents of magnesium.
Inorganic and biogenic rhombohedral carbonate minerals can be characterized by variable content of calcium carbonate (CaCO3) and magnesium carbonate (MgCO3) identified in Triassic limestones of the Polish part of the Germanic Basin (southwestern part of Poland, in the Opole region of Upper Silesia) (1,2). The limestones of Muschelkalk (Middle Triassic) sediments, especially formations of the Lower Muschelkalk in the Gogolin Beds (the bottom of profile), the Górażdże Beds, Dziewkowice Beds, and Karchowice Beds (the upper formation of profile) are built of carbonate phases differing in calcium (Ca) and magnesium (Mg) content. These deposit formation names are regional, and derive from the names of nearby towns. Variability of calcium and magnesium in carbonate rocks is associated with the presence of various magnesium-containing carbonate phases. Results of the studies show that limestones of the Polish part of the Germanic Basin are mainly built of low-magnesium calcite, high-high magnesium calcite, and dolomite. Moreover, it is possible to observe lesser amounts of huntite, ankerite, and siderite (1–8).
The aim of this article is to show the importance and usability of Fourier transform infrared (FT-IR) spectroscopy for research of carbonate phases, which present different content of MgCO3, low-Mg calcite CaCO3, high-Mg calcite (Ca1-n,Mgn)CO3, dolomite CaMg(CO3)2, and huntite CaMg3[CO3]4 in middle Triassic sediments. The limestones were first investigated as part of previous research work. FT-IR was one of the analytical methods used during this previous work (3–8). However, in past studies, the accuracy of FT-IR was not evaluated for identification of carbonate phases with different amounts of magnesium, especially phases with magnesium substitution. Therefore, it was decided to evaluate this question in the present study.
FT-IR spectroscopy allows one to identify carbonates characterized by variable content of calcium and magnesium: low-Mg calcite CaCO3 (space group R3-withbar c), high-Mg calcite CaMgCO3 (space group R3-withbar c), proto-dolomite Ca0,5Mg0,5CO3 (space group R3-withbar c), ordered dolomite Ca0,5Mg0,5CO3 (space group R3-withbar), huntite Ca0,25Mg0,75CO3 (space group R32) and magnesite MgCO3 (space group R3-withbar c) (9–18). Carbonate minerals are characterized by highly anisodesmic bonds, comprised of anions as CO32- in the minerals, in which atoms have covalent bonds that behave like vibrators, somewhat independent of their molecular surroundings. Their vibrations influence the absorption spectra of carbonates. The absorption bands, corresponding to the intramolecular vibrations of CO32- anions, correspond to the basic range of the infrared spectrum, and the lattice vibrations yield absorption bands in the far infrared (19–21). The free CO32- ion is flat, and has a triangular D3h symmetry. It causes four intramolecular vibrations: v1 (symmetrical stretching), v2 (bending beyond the plane), v3 (symmetrical stretching), and v4 (bending in the plane). In the crystalline lattice of trigonal anhydrous carbonates (a group of calcite), which crystallize according to point group D3d, the unit cell contains two CO32- anions located in places with local symmetry D3. Under these conditions, vibrations of the CO32- anion produce absorption bands only slightly shifted in relation to the frequency of the free ion vibrations. The band v4 is particularly useful for identification of carbonate minerals. This band clearly changes its position with the change of cation type, and takes the following peak locations for calcite: CaCO3 at 712 cm-1, and for magnesite: MgCO3 at 748 cm-1 (19–21). In the dolomite (CaMg[CO3]2) absorption spectrum, where the structure of the flat CO32- ions is interbedded with Ca2+ and Mg2+ cations, the v4 absorption band is found near 729 cm-1. This band is located approximately halfway between the appropriate band of calcite and magnesite. Isomorphic substitutions cause only a slight shift of the carbonate absorption bands. The v1 absorption band, prohibited in principle for carbonates of the calcite group, is sometimes observed in the spectra of weakly crystallized samples or those specimens whose structure has been disturbed by grinding.
Magnesium usually comes from sea waters, and less often from fresh waters. High-Mg calcite is an unstable carbonate phase with respect to low-Mg calcite. It may lose its magnesium over time, and become low-Mg calcite. If it is exposed to magnesium-rich pore waters, high-Mg calcite can gain additional magnesium and be replaced by dolomite (22). Dolomite and huntite are stable carbonate phases, because in these phases, magnesium does not substitute for calcium. Typical dolomite, stoichiometric in its chemical composition, contains 46.13% of MgCO3. It is formed during advanced stages of diagenesis, in a water environment rich in magnesium. Protodolomite is usually formed during sediment compaction and early stages of diagenesis. This is a non-stoichiometric, poorly ordered carbonate phase, often characterized by lower than stoichiometric content of MgCO3 (23–25). Huntite has increased content of magnesium, anywhere from 20–21% of Mg (from 69–71% MgCO3) (26–29). It is usually formed as an effect of hydrothermal processes, weathering of dolomite, or as a result of the transformation of high-Mg calcite under high temperature conditions. In sedimentary rocks, it occurs in the sediments of the vadose zone (27).
Materials and Methods
Study Area
FT-IR analysis was applied to investigate a total of 30 samples:
- 4 samples from Gogolin Beds (G1 and G6, collected in Gogolin Quarry, LD9 and LD11, collected in Górażdże Quarry)
- 5 samples from Górażdże Beds LD2, SA5, W1, W5, and W7, (LD2 collected in Ligota Dolna Quarry)
- SA5 from the Saint Anne Mountain area
- 6 samples of Dziewkowice (Terebratula) Beds SO1, SO28, S2, S8, SA10, and SA12 (SO1 and SO28 from Strzelce Opolskie Quarry; S2 and S8 from Szymiszów Quarry; SA10 and SA12 from the Saint Anne Mountain area)
- 15 samples from Karchowice Beds SO7, SO14, SO20, SA2, SA13, T1, T7, T15, T22, T30, T41, T62, T65, T66, and T77 (SO7, SO14, SO20 from Strzelce Opolskie Quarry; SA2 and SA13 from the Saint Anne Mountain area; T1, T7, T15, T22, T30, T41, T62, T65, T66, and T77 from Tarnów Opolski Quarry)
The samples were collected during previous projects connected with the study of limestone mineral composition, especially carbonate phases with different magnesium content related to diagenetic processes (4–8).
Analytical Method
The studies were carried out at the Institute of Geological Sciences of Jagiellonian University in Cracow (Poland), using a FTS 135 BioRad Fourier transform spectrometer. The spectra were evaluated using the software provided by the manufacturer (Bio-Rad Sadtler Division). Pellets were made from samples and analyzed. The pellets were made by mixing 0.8 mg dried sample with 300 mg spectrally pure potassium bromide (KBr). Then, the mixture was compressed into a pellet using several tons of pressure while under vacuum.
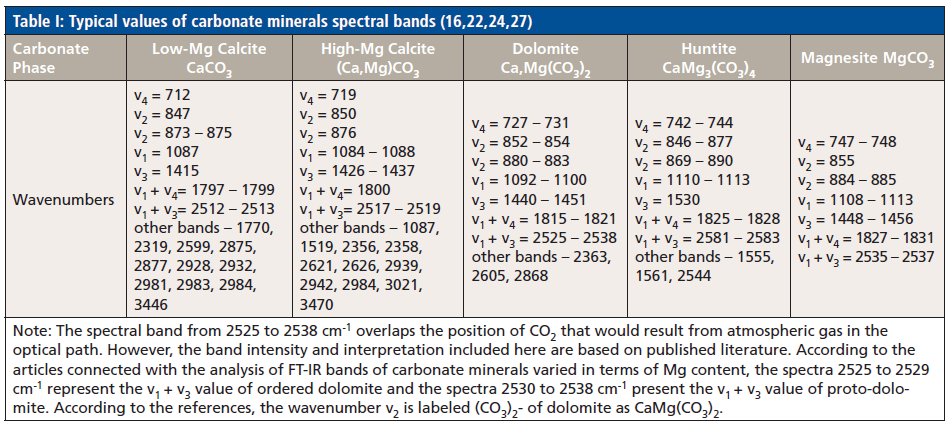
The absorption spectra obtained provided information to identify minerals that form within the selected limestone specimens. With the increase of magnesium content, the values of peak wavenumber locations increased from those typical for "pure" calcite to the peak values characteristic for dolomite. Peak wavenumber values typical for huntite and magnesite are higher in comparison to those of dolomite (Table I) (12,16, 22,24,27).
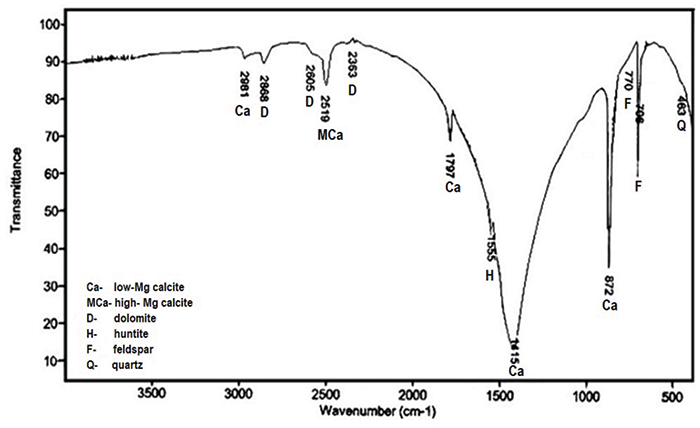
Figure 1: Infrared absorption spectrum of limestone sample G6 in the range from 4000 to 400 cm-1 (5).
Results of Studies
Mineral Phases in Gogolin Limestones
FT-IR was applied to investigate four samples in total: G1, G6, LD9, and LD11. The results of sample G6 were presented in the study (Figure 1, Table II) (5,6). The results of the study show that low-Mg calcite dominates in these samples. In three samples (G6, LD9 and LD11), high-Mg calcite was identified (Figure 1, Table II). In the G6 sample, this carbonate phase was determined on the basis of peak wavenumber v1 + v3 and in samples LD9 and LD11, on the basis of peak wavenumber v3. Absorption bands of dolomite were observed only in the infrared absorption spectrum of sample G6 (Figure 1, Table II). The dolomite phase was identified on the basis of three band wavenumbers toward the far infrared.
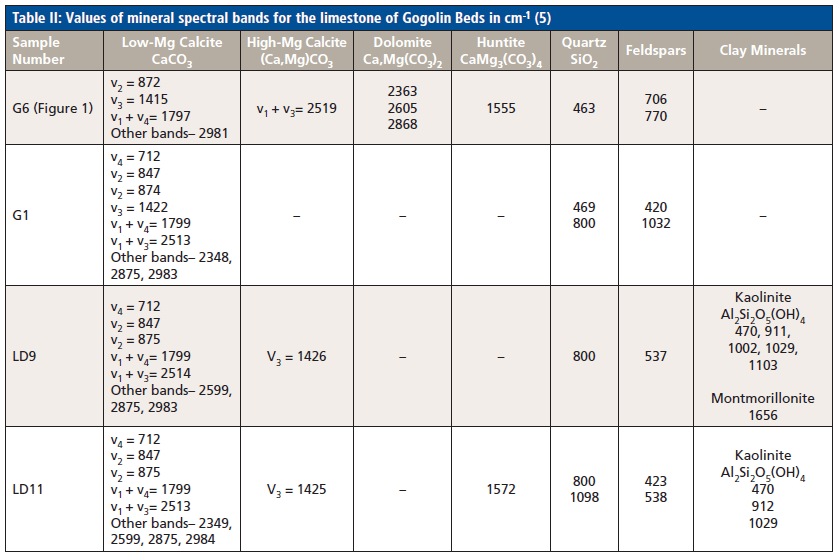
Huntite (a carbonate phase with the highest Mg content) was determined in the absorption spectra of samples G6 and LD11. This carbonate phase was identified on the basis of single infrared absorption bands (Figure 1, Table II) (5). Because they are single bands, it was concluded that this carbonate phase probably occurs in these samples.
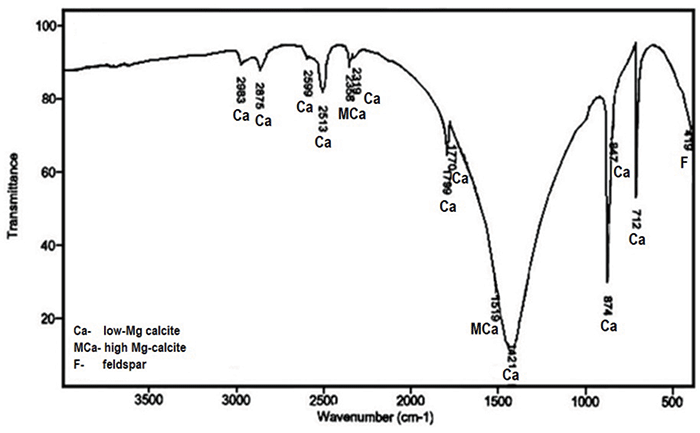
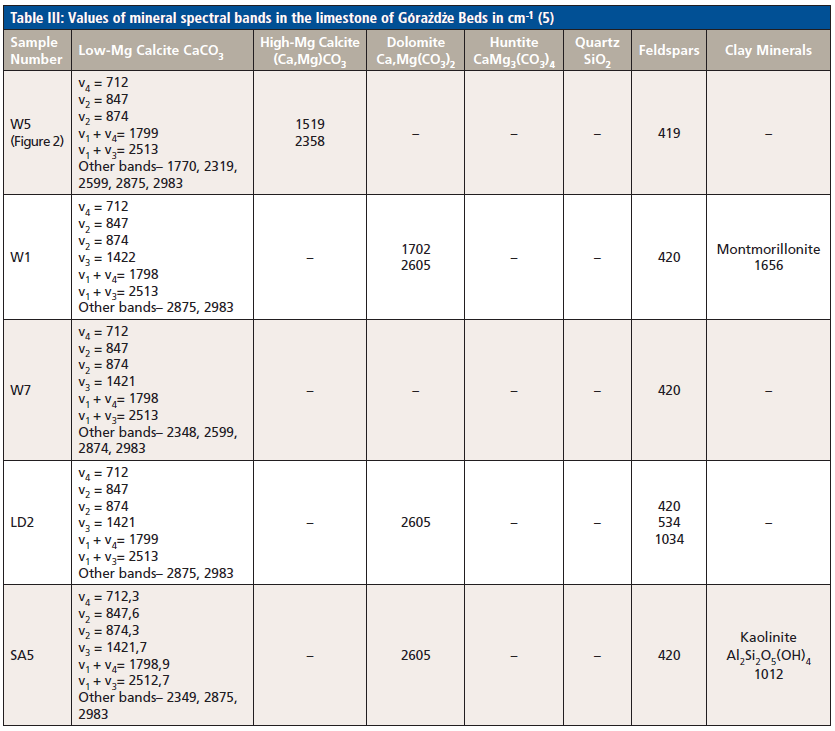
Figure 2: Infrared absorption spectrum of limestone sample W5 in the range from 4000 to 400 cm-1 (5).
Mineral Phases in Górażdże Limestones
The FT-IR analysis was applied to investigate five samples in total: LD2, SA5, W1, W5, and W7. The results of sample W5 are presented in the study (Figure 2, Table III) (5). The results of the study show that in Górażdże limestones the low-Mg calcite dominates. Only in one sample, W5, was high-Mg calcite identified (Figure 4, Table III). This carbonate phase was identified on the basis of two peak wavenumbers, with values of 1519 cm-1 and 2358 cm-1. The other carbonate phase, as dolomite, was observed in absorption spectra of samples W1, LD2, and SA5 (Figure 2, and Table III). Huntite was not found in the samples of Górażdże limestone (5).
Mineral Phases in Dziewkowice (Terebratula) Limestones
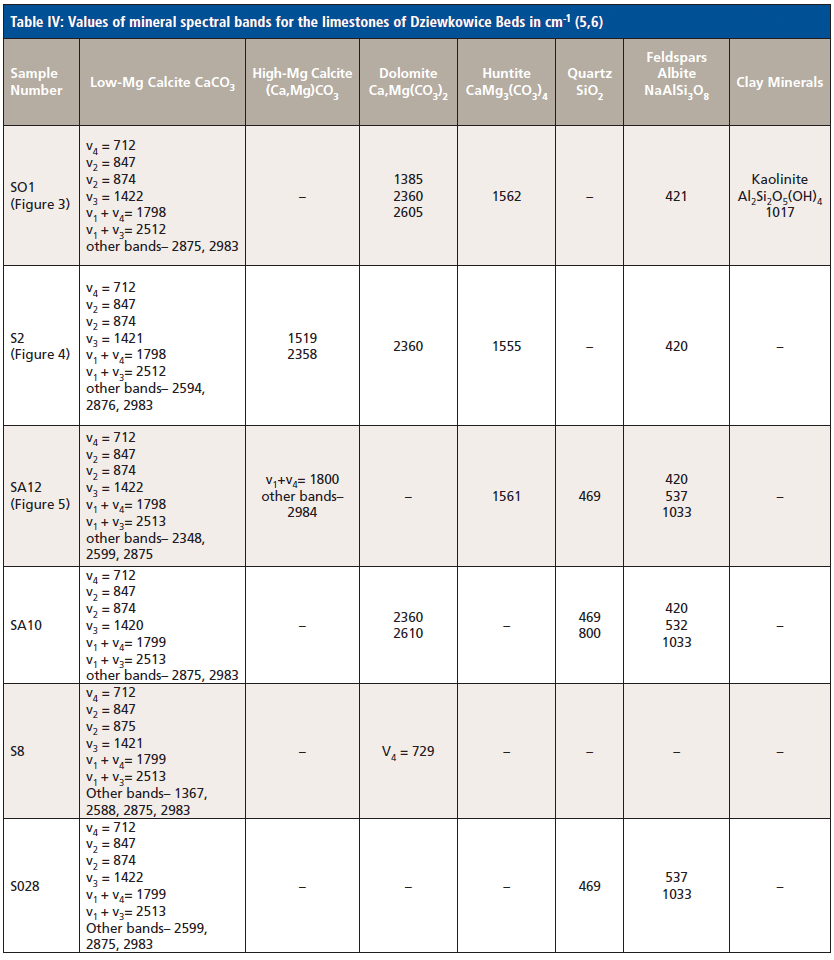
FT-IR was then used to investigate six additional samples: SO1, SO28, S2, S8, SA10 and SA12. The results of three of these samples, SO1, S2, and SA12, are presented in the study (Figures 3, 4 and 5, and Table IV) (5, 6). Results of the spectral analysis show that low-Mg calcite dominates in these limestones. This phase, like in the previous samples, was identified on the basis of the following infrared bands: v4, v2, v3, v1 + v4, and v1 + v3. Other identified bands for these samples in wavenumbers are given in (Figures 3, 4 and 5, and Table IV) (5,6).
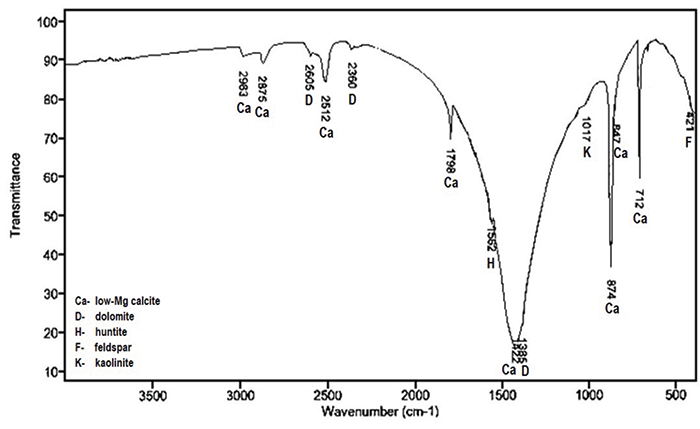
Figure 3: Infrared absorption spectrum of limestone sample SO1 in the range from 4000 to 400 cm-1 (5,6).
High-Mg calcite was identified only in sample SA12, on the basis of wavenumbers: v1 + v4= 1800 cm-1 and 2984 cm-1. Dolomite was determined in four samples: SA10, SO1, S2, and in S8 (Table IV). Huntite was observed in the absorption spectra of three samples: SO1, S2, and SA12 (Table IV) (5,6).
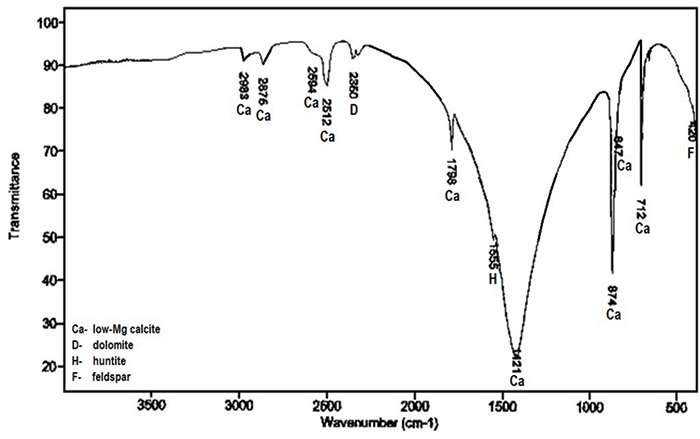
Figure 4: Infrared absorption spectrum of limestone sample S2 in the range from 4000 to 400 cm-1 (5,6).
Mineral Phases in Karchowice Limestones
FT-IR was applied to investigate 15 samples of this type: SO7, SO14, SO20, SA2, SA13, T1, T7, T15, T22, T30, T41, T62, T65, T66, and T77 (Table V). The results of two samples, T41 and T62, were presented in the study (Figures 6 and 7, and Table V) (5,6,35). Results of the spectral analysis show that in these limestones, the presence of low-Mg calcite dominates. This phase, like in the previous samples, was identified on the basis of the following infrared bands: v4, v2, v1 + v4, v1 + v3, and v3 in samples SO20, SA2, SA13, T15, T65, T66, and T77 (Figures 6 and 7, and Table V). Sometimes other bands were observed in the infrared spectra with peak wavenumbers given in (Table V) (5,6,35).
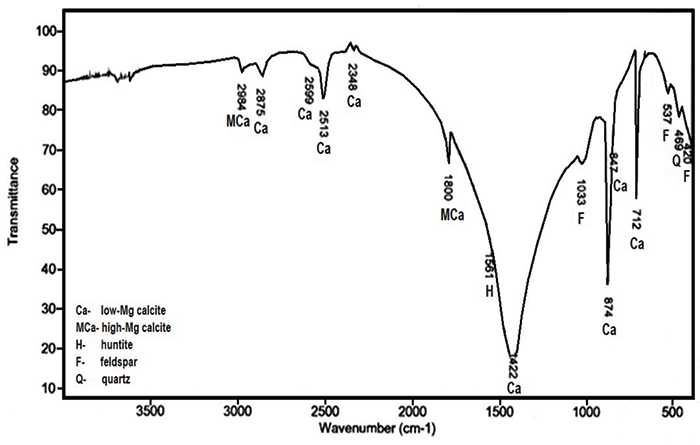
Figure 5: Infrared absorption spectrum of limestone sample SA12 in the range from 4000 to 400 cm-1 (5,6).
High-Mg calcite was identified in samples SO14, SO20, T1, T7, T22, T30, T41, and T62 (Table V). It was identified on the basis of the following bands in wavenumbers: v3 at 1426–1435 cm-1, v1 + v3 at 2517–2521 cm-1 and others (Table V) (5,6,35).
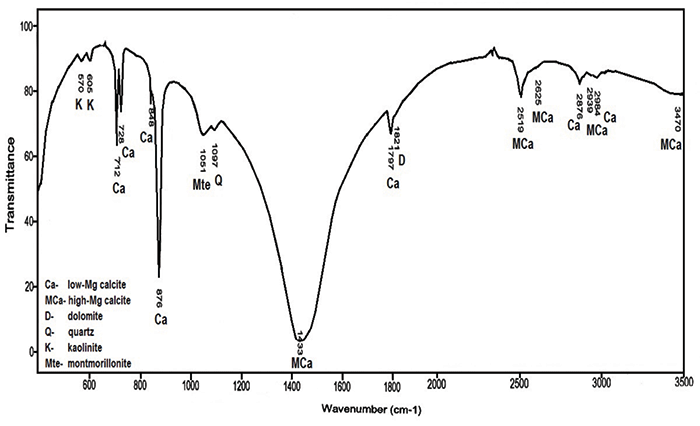
Figure 6: Infrared absorption spectrum of limestone sample T41 in the range from 400 to 3500 cm-1 (35).
Dolomite was determined in eleven samples: in SO7, SO14, T7, T15, T22, T30, T41, T62, T65, and T66 (Table V) (5,6,35).
Huntite was observed in the absorption spectra of three samples: SO1, S2, and SA12 (Table V) (5,6).
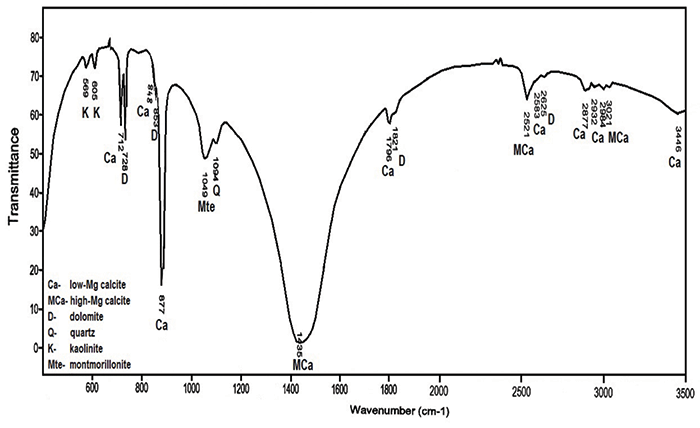
Figure 7: Infrared absorption spectrum of limestone sample T62 in the range from 400 to 3500 cm-1 (35).
Moreover, non-carbonate phases were also identified in the absorption spectra of several analyzed samples: quartz (in Gogolin, Górażdże, and Karchowice limestones), feldspars, kaolinite (in Gogolin, Górażdże, Dziewkowice and Karchowice limestones), and montmorillonite (in Karchowice limestones) (5,6,35).
Discussion
The results of FT-IR analysis indicate that the greatest variation of carbonate phases is present in limestones of the Gogolin Beds, Dziewkowice Beds and Karchowice Beds, and the lowest in the Górażdże Beds. However "pure" calcite (low magnesium calcite as CaCO3) dominates in limestones of all formations. This phase was determined on the basis of typical bands: v2, v3, v4, v1 + v3, v1 + v4, and some bands in the far infrared.
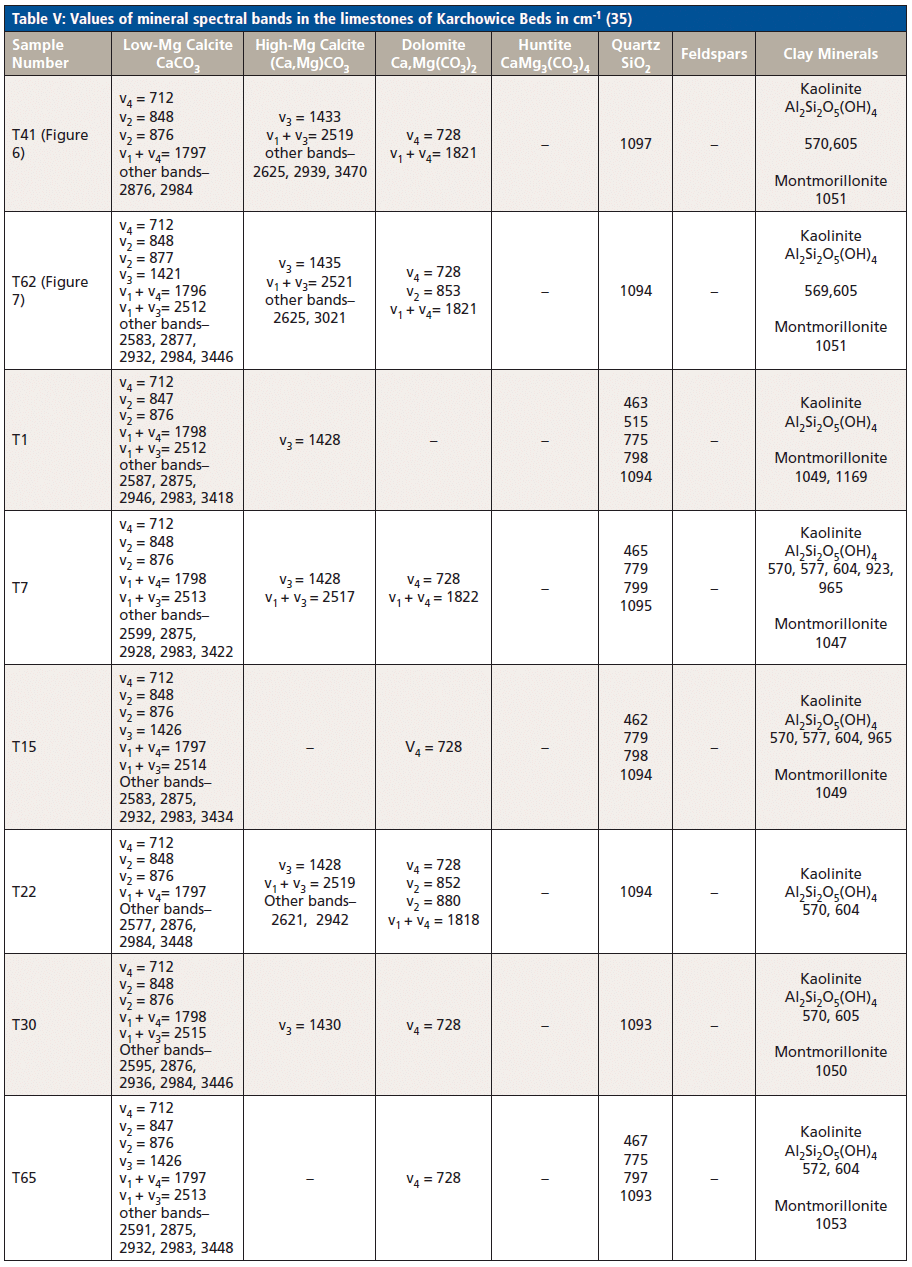
High-Mg calcite (Ca1-nMgn[CO3]) was identified in limestone samples of all formations, but not in every investigated sample. Chemical formula of high-Mg calcite of Gogolin limestones can be demonstrated as follows: Ca0.9Mg0.1CO3, whereas that of Górażdże limestones is (Ca0.92-0.90,Mg0.08-0.10)CO3, that of Dziewkowice limestones can be demonstrated as follows: (Ca0.87-0.74,Mg0.13-0.26)CO3, and that of Karchowice limestones is (Ca0.85-0.77,Mg0.15-0.23)CO3. Differentiation of magnesium content in crystals results in a varied value of high-Mg calcite bands observed in absorption spectra of limestones from each formation. The infrared absorption bands of this phase were observed in spectra of three Gogolin Limestones (in sample G6 [v1 + v3 at 2519 cm-1], in samples LD9 [v3 at 1426 cm-1] and LD11 [v3 at 1425 cm-1) (5,6). In Górażdże limestones, high Mg calcite was determined in one sample, W5, on the basis of two wavenumbers, with values of 1519 cm-1 and 2358 cm-1. In Dziewkowice limestones, this phase was identified in two samples: S2 (on the basis of bands found at 1519 cm-1 and 2358 cm-1) and SA12 (on the basis of bands v1 + v4 at 1800 cm-1 and 2984 cm-1) (5,6). In Karchowice limestones, absorption bands of high-Mg calcite were observed in spectra of eight samples: SO14 (wavenumbers: v3 at 1426 cm-1, v1 + v3 at 2519 cm-1 and 2626 cm-1), SO20 (at 1087 cm-1 and 2356 cm-1), T1 (v3 at 1428 cm-1), T7 (v3 at 1428 cm-1 and v1 + v3 at 2517 cm-1), T22 (wavenumbers: v3 at 1428 cm-1, v1 + v3 at 2519 cm-1, 2621 cm-1, and 2942 cm-1), T30 (v3 at 1430 cm-1), T41 (v3 at cm-1, v1 + v3 at cm-1, 2625 cm-1, 2939 cm-1, and 3470 cm-1), and T62 (v3 at 1433 cm-1, v1 + v3 at 2519 cm-1, 2625 cm-1, and 3021 cm-1) (5,6,35). The results of investigations show that substitution of Ca2+ by Mg2+ in the high-Mg calcite lattice leads to continuously increasing wavenumber bands for the v1, v3, v4, (v1 + v3) and (v1 + v4) modes, which was also found for other binary and ternary carbonate solid solution systems (11–15). According to Böttcher and coworkers, the Mg2+ content of all high magnesium calcites correlates linearly with the position of the sharp v4 mode according to the equation:

The corresponding band in wavenumbers is independent of the local formation conditions, and may be used for the estimation of the composition of homogeneous high-Mg calcites. Note that in the absorption spectra of all investigated samples, the v4 wavenumber was not observed, therefore, no conclusions can be drawn about high-Mg calcite composition. The lack of this band could be connected with the small amount of high-Mg calcite within the limestone samples studied. The symmetric stretching mode v1, a typical absorption band of dolomite and huntite, sometimes is observed as a weak absorption band of high-magnesium calcite (16). However, this band was not observed in the absorption spectra of the investigated samples. There were bands observed having wavenumber positions in the far infrared.
Dolomite (CaMg[CO3]2) was determined in limestone samples of all formations but not in every investigated sample. It was determined to be only in one Gogolin limestone sample, G6, on the basis of bands at 2605 cm-1, 2363 cm-1, and 2868 cm-1. In infrared absorption spectra of three investigated samples of Górażdże limestone, absorption bands were observed. In one sample, W1, this phase was identified on the basis of two bands: 1702 cm-1 and 2605 cm-1, and in two samples, LD2 and SA5, on the basis of only one band, 2605 cm-1. Therefore, dolomite probably occurred in these samples (5,6). In the Dziewkowice limestone, dolomite was determined in four samples: SO1 (on the basis of bands at 1385 cm-1, 2360 cm-1, and 2605 cm-1), S2 (on the basis of the 2360 cm-1 band), S8 (on the basis of the v4 band), and SA10 (on the basis of the 2360 cm-1 and 2610 cm-1 bands. In absorption spectra of samples S2 and S8, only single dolomite bands were observed. Therefore, it should be assumed that the dolomite is probably present in these samples. In Karchowice limestone, dolomite was identified in 13 of the samples: SO7, SO14, SA2, T7, T15, T22, T30, T41, T62, T65, and T66. In the absorption spectra of four samples (T15, T30, T65, and T66), only a single band of dolomite, v4, was observed. In the absorption spectra of other samples, more than one band of dolomite was observed: in SO7 (v3, v4, at 2359 cm-1, and 2605 cm-1), SO14 (v4 at 2368 cm-1), SA2 (2352 cm-1, 2605 cm-1, and 2868 cm-1), T7 (v4 and v1 + v4), T22 (two bands for v2, v4 and v1 + v4), T41 (v4 and v1 + v4), and T62 (v2, v4 and v1 + v4). (5,6,35). Hence, the probability of dolomite presence in these samples is higher than in previous samples. When the presence of two typical and intense infrared absorption bands are observed (v2 and v4, v3 and v1 + v4, v4 and v1 + v4, it can be clearly stated that dolomite is present in the sample. The bands of v2, v4 and v1 + v4 indicate the presence of ordered dolomite, observed in several limestone samples. The v2 and v4 bands of proto-dolomite are usually at a higher wavenumber than those of ordered dolomite, with the v1 + v4 bands found a lower wavenumber position. The value of the symmetric stretching mode v1 of proto-dolomite is usually lower than that of ordered dolomite (1092 cm-1) (16). However, this band was not observed in the spectra of any of the samples measured. Therefore, for our samples no definitive conclusions can be drawn about the presence of dolomite on the basis of this band. In absorption spectra of some samples, peak wavenumbers in the far infrared were observed. Their peak values are higher than those of high magnesium calcite, and do not yield information regarding the dolomite type.
Huntite (CaMg3[CO3]4) was identified in five investigated samples: two of Gogolin limestone (G6 and LD11), and three of Dziewkowice limestone (SO1, S2, and SA12). The huntite infrared bands were not observed in samples of the Górażdże limestone nor Karchowice limestone. There were no bands typical for huntite: v3 at 1530 cm-1, v4 at 742–744 cm-1, v2 at 846–877 cm-1 and v2 at 869–890 cm-1, v1 at 1110–1113 cm-1, v1+v4 at 1825–1828 cm-1 and v1+v3 at 2581–2583 cm-1 and 2544 cm-1 for investigated samples. The carbonate phase was identified owing to the following bands: 1555 cm-1 in samples G6 and S2, 1561 cm-1 in sample SA12, 1562 cm-1 in sample SO1, and 1572 cm-1 in sample LD11 (5,6). Huntite was only identified on the basis of single bands and only in the samples of Gogolin and Dziewkowice limestone. Therefore, it was concluded that huntite is most likely present in the samples. Moreover, some of the huntite band wavenumber values are slightly differentiated. It is most probably related to the varied content of magnesium and calcium in the huntite crystal lattice. Previous studies have shown that the magnesium content in huntite (14.01–16.18%) is lower corresponding to a stoichiometric value as 20–21% Mg, 33–34% MgO, 69–71% MgCO3, which exceeds the stoichiometric value for dolomite as 13.12% Mg, and 21.86% MgO (5,6). The reduction of magnesium ions could be caused by diagenetic process, or dehuntization. This type of huntite is probably present in the limestones we investigated. To summarize, because the huntite associated bands have higher wavenumber values than the corresponding bands of dolomite, it should be assumed that they are the huntite associated bands, and probably huntite characterized by reduced magnesium content.
Conclusions
Results of this research show that FT-IR spectroscopy is an appropriate method useful for identification of carbonate phases differing in magnesium content. On the basis of the infrared spectra obtained from FT-IR, the minerals as constituent parts of the investigated limestones were identified, in particular carbonate phases (low magnesium calcite, high-Mg calcite, dolomite, and huntite).
According to the results, the presence of low-Mg calcite dominates in the investigated limestone samples. This is confirmed by the occurrence of a significant number of absorption bands of this carbonate phase, as v3, v4, v2, v1 + v4, and v1 + v3, and bands observed in the far infrared. High-Mg calcite was identified in limestone samples of all formations; however, not in every sample measured. Usually the bands: v3 and v1 + v3 and some far infrared bands occurred in the samples investigated. The wavenumber values of high Mg-calcite observed in spectra of limestones from different formations are often connected with the Mg content if the crystal lattice.
Dolomite, just like high-Mg calcite, was also determined to be present in the limestone samples of all formations but not in every investigated sample. The bands for dolomite are usually found at higher wavenumbers than those of high-Mg calcite. Usually single or two dolomite bands, seldom three, occurred in the spectra of the measured samples. Because of those findings,we cannot draw definitive conclusions about dolomite type. On the basis of the results, we can only confirm the presence of dolomite in the test samples; however, we cannot say whether it is proto-dolomite or ordered dolomite.
Huntite was identified only in five samples, two of Gogolin limestone and three of Dziewkowice limestone, and only on the basis of a single band. However, because its wavenumber band position is higher than the corresponding values for dolomite, it should be assumed that they are the huntite associated bands. Some of the huntite bands are slightly differentiated; probably related to the different concentrations of magnesium in the huntite crystal lattice.
FT-IR spectroscopy could be used as the one of the most appropriate methods for the identification of carbonate phases differentiated by magnesium content, including phases with magnesium substitution. It is highly usable and demonstrates high accuracy.
References
(1) J. Szulc, International Workshop- Field Seminar The Muschelkalk- Sedimentary Environments, Facies and Diagenesis, Excursion Guidebook and Abstracts. Kracow-Opole (1990) s. 1–32.
(2) J. Szulc, Annales Societatis Geologorum Poloniae70, 1–48 (2000).
(3) K. Stanienda, Miner. Resour. Manage. 22 (Special issue 3), 243–251 (2006).
(4) K. Stanienda, Effects of Dolomitization Processes in the Triassic Limestone of Tarnów Opolski Deposit (Silesian University of Technology Press, Gliwice,Poland, 2011).
(5) K. Stanienda, Diagenesis of the Triassic Limestone from the Opole Silesia in the Aspect of Magnesian Calcite Presence (Silesian University of Technology Press, Gliwice, Poland, 2013).
(6) K. Stanienda, Miner. Resour. Manage. 29(3), 79–98 (2013).
(7) K. Stanienda, Carb. Evap. 31, 387–405 (2016).
(8) K. Stanienda, Carb. Evap. 33(4), 801–821 (2018).
(9) P.L. Althoff, Am. Mineral. 62, 772-783 (1977).
(10) M.E. Böttcher, P.L. Gehlken, and E. Usdowski, Contrib. Mineral. Petrol. 109, 304 (1992)
(11) M.E. Böttcher and P.L. Gehlken, Terra Abstracts 7(1), 69 (1995).
(12) M.E. Böttcher, P.L. Gehlken and C. Reutel, Appl. Spectrosc. 51, 130–131 (1997)
(13) M.E. Böttcher, P.L. Gehlken, Á. Fernández-González and M. Prieto, Eur. J. Mineral. 9, 519–528 (1997).
(14) M.E. Böttcher, P.L. Gehlken, and F.D. Steele, Solid State Ionics, 101–103, 1379–1385 (1997).
(15) D. Kralj, J. Kontrec, L. BrecevC, G. Falini and V. Nöthig-Laslo, Chem. Eur. J. 10, 1647–1656 (2004).
(16) J. Paquette and R.J. Reeder, Am. Mineral. 75, 1151–1158 (1990).
(17) J.O. Titiloye, N.H. De Leeuw and S.C. Parker, Geochim. Cosmochim. Acta 62(15), 2637–2641 (1998).
(18) S.J. Tsipursky and P.R. Buseck, Am. Mineral. 78, 775–781 (1993).
(19) D.J. Ahn, A. Berman and D. Charych, J. Phys. Chem. 100, 12455–12461 (1996).
(20) O.S. Pokrovsky, J.A. Mielczarski, O. Barrea and J. Schott, Langmuir 16, 2677–2688 (2000).
(21) K. Ramseyer, T.M. Miano, V. D'Orazio, A. Wildberger, T. Wagner and J. Geister, Org. Geochem. 269 (5/6), 361–378 (1997).
(22) S. Jr. Boggs, Petrology of Sedimentary Rocks (Cambridge University Press, Cambridge, United Kingdom, 2nd Ed., 2010), pp. 313-457.
(23) F.T. Mackenzie and A.J. Andersson, Geochem. Persp. 2(1) (2013).
(24) J.W. Morse, A.J. Andersson and F.T. Mackenzie, Geochim. Cosmochim. Acta 70, 5814–5830 (2006).
(25) M.E. Tucker and V.P. Wright, Carbonate Sedimentology (Blackwell Scientific Publications, Oxford London, United Kingdom, 1990), pp. 366–372.
(26) W.F. Cole and C.J. Lancucki, Am. Mineral. 60, 1130–1131 (1975).
(27) J.C. Deelman, Magnesite and Huntite. In Low–Temperature Formation of Dolomite and Magnesite http://www.jcdeelman.demon.nl/dolomite/files/13_Chapter6.pdf (2011).
(28) W.A. Dollase and R.J. Reeder, Am. Mineral. 71, 163–166 (1986).
(29) J.W. Morse and F.T. Mackenzie, Geochemistry of Sedimentary Carbonates (Elsevier, Amsterdam, The Netherlands, 1990) p. 707.
(30) M.A. Bertram, F.T. Mackenzie, F.C. Bishop and W.D. Bischoff, Am. Mineral. 76, 1889–1896 (1991).
(31) F. Zhang H. Xu, H. Konishi and E.E. Roden, Am. Mineral. 95, 1650–1656 (2010).
(32) R.W. Fairbridge, Soc. Econ. Paleontologists and Mineralogists Spec. Pub. 5, 164–170 (1957).
(33) F. Yavuz, M.S. Kirikoglu and G. Özden, Neues Jahrbuch Fur Mineralogie- Abhandlungen, 182(2), 201–212 (2006).
(34) G.T. Faust, Am. Mineral. 38, 4–23 (1953).
(35) K. Stanienda, Scientific Journals of Silesian University of Technology (Zeszyty Naukowe Politechniki Slaskiej), series: Mining (Górnictwo) 269, 149-157 (2005).
Katarzyna J. Stanienda-Pilecki is with the Department of Applied Geology in the Faculty of Mining and Geology at the Silesian University of Technology, in Gliwice, Poland. Direct correspondence to: Katarzyna.Stanienda-Pilecki@polsl.pl

Geographical Traceability of Millet by Mid-Infrared Spectroscopy and Feature Extraction
February 13th 2025The study developed an effective mid-infrared spectroscopic identification model, combining principal component analysis (PCA) and support vector machine (SVM), to accurately determine the geographical origin of five types of millet with a recognition accuracy of up to 99.2% for the training set and 98.3% for the prediction set.
Authenticity Identification of Panax notoginseng by Terahertz Spectroscopy Combined with LS-SVM
In this article, it is explored whether THz-TDS combined with LS-SVM can be used to effectively identify the authenticity of Panax notoginseng, a traditional Chinese medicine.