Use of Handheld X-Ray Fluorescence to Analyze Platinum Group Metals in Catalytic Converters
The platinum-group metals platinum, palladium, and rhodium are essential and valuable elements in catalytic converters, and thus must be recycled. Handheld X-ray fluorescence (XRF) can be extremely beneficial for analysis of these metals in finely ground materials extracted from used catalytic converters.
The use of handheld X-ray fluorescence (XRF) can be extremely beneficial to analyze platinum group metals in catalytic converters. Ultimately, handheld XRF can provide accurate, precise, fast, and nondestructive analysis of finely ground car catalyst material.
Platinum (Pt), palladium (Pd), and rhodium (Rh) fall into the platinum group metals (PGMs), where several elements that share similar physical properties are grouped together. These three PGMs are used in catalytic converters to increase fuel efficiency and reduce harmful emissions (1).
Catalysts function to decrease the amount of energy required to activate a chemical reaction by accelerating the rate of a reaction, without direct involvement of the catalyst itself (2)
In catalytic converters, catalysts are mounted on a monolith for use in catalytic converters. In the 1960s, the material this monolith was made of had large temperature ranges that caused it to expand, crack, and break. This problem was later resolved with the creation of the cordierite monolith (2MgO*2Al2O3*5SiO2), which did not share the same material properties as its predecessors, and would not thermally expand to the point of breaking.
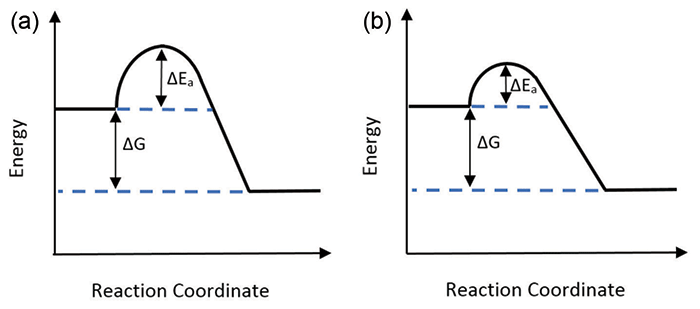
Figure 1: The activation energy (Ea) of a chemical reaction, (a) without a catalyst, and (b) with a catalyst. This shows that the activation energy of a chemical reaction decreases and increases reaction speed, thus increasing product yield (2).
In 1975, the two-way catalytic converter enabled the oxidation of carbon monoxide and hydrocarbons. These catalysts served to increase the rate of oxidation (for example, to increase oxygen in an environment and convert carbon monoxide to carbon dioxide or hydrocarbons to water). By 1981, the catalytic converter was optimized once more with the introduction of the three-way catalytic converter, which reduced nitrogen oxides (3–5) These three-way devices, which used PGMs, reduced the amount of oxygen, and converted nitrous oxide to nitrogen and oxygen (2,5).

Figure 2: Three reactions take place in a three-way catalytic converter. One is the reduction of nitrous oxide into nitrogen and oxygen, the second is the oxidation of carbon monoxide to carbon dioxide, and the third is the oxidation of hydrocarbons and oxygen into carbon dioxide in water (2).
These monoliths have a honeycomb structure, as shown in Figure 3 (6). The cross section in this structure optimizes the reactions by increasing the surface area and the contact between the catalysts and the emissions. This, in turn, allows more reactions to take place (7). The combined concentration of Pt, Pd, and Rh expected within a catalytic converter is below 1% (4).

Figure 3: Cross section of a honeycomb catalytic converter (6).
These monoliths are covered in a coating of aluminum oxide, called a washcoat, which is comprised of ~90% aluminum oxide. Including the three PGMs of interest, there are other additives in the coating that enhance the performance of the PGMs within the catalytic converter (8) For example, cerium and zirconium are used to create an oxygen-rich environment to help oxidize carbon monoxide into carbon dioxide (9). Another example is barium, which is used mostly in diesel engines as a lean trap to reduce nitrous oxide to nitrogen (10). These aforementioned additives can be found in concentrations up to 10%, and are considered large contributors to the constitution of catalytic material (4).
Other additives are added in smaller concentrations for different purposes. For example, lanthanum and other rare earth elements are used more frequently in Asian markets to increase the catalytic converter's lifespan (4). Nickel is also useful because it is used to catch sulfur in fuel (4). Sulfur is considered a poison to a catalyst (9,10). Often, the gas passing through the catalyst causes some sulfur particulates to accumulate on the surface. A poison such as sulfur can be partially absorbed on this surface, and decrease the available surface area for the catalyst's reactions to take place. In turn, this decreases the catalyst's effectiveness and lifespan. Lead is another example of poison; it coats the catalyst materials and prevents the exhaust fumes from undergoing redox reactions.
The effect of some of these poisons can be reversed by running the engine at hot temperatures, which increases the heat of the exhaust flowing through the converter. However, the effect of a poison is not reversible if the poison is lead, because it has a high boiling point (2). Lead was used as a fuel additive from the 1920s up to the 1970s, when it was phased out (5).
The removal of lead from fuel additives helped push environmental laws for the regulation of emissions. In 1967, Ford and General Motors (GM) ran studies to measure the relative rates of catalyst degradation, and whether the degradation was due to thermal effects or a poison. The study concluded that when using unleaded gasoline, the catalysts were durable, dependable, and resistant to engine malfunctions. It was also determined that unleaded gasoline had a negligible effect to engine performance and fuel intake. The results were made public two years later, and, following their release, the data were presented to the Society of Automotive Engineers (SAE) to make advanced emissions control feasible by removing lead from gasoline. It was proposed that catalytic converters should be installed on all cars by 1975 (11). Following this, the US Congress enacted the Clean Air Amendment to reduce emissions by 90% for hydrocarbons, carbon monoxide, and nitrous oxides by the mid-1970s. Similar laws were passed in Japan and Canada in 1976 (12).
Many countries then followed and demanded regulations for emissions, although this depended on their ability to research, develop, and enforce legislation. For example, the European Union is an amalgamation of countries, and although some countries adopted regulations, others did not, whether due to funds or other pending disagreements. Regulations for emissions came in later years, and since 1993, car catalysts have been mandatory in all new cars (11).
Air regulation laws were implemented in automobiles on a country-by-country basis, each with their own rules and regulations. Today, most regulations require that every new automobile is fitted with a catalytic converter (11,12). Regulations also varied country to country. For example, the United Nations (UN) Economic Commission for Europe (ECE) emission regulations apply only when a car was produced. However, in the United States, emissions regulations apply for a car's lifespan. Thus, if an older car entered service, manufacturers in the United States are accountable to retrofit it. This was not the case in Europe; however, Europe eventually caught up on regulations, and, in the 2000s, enacted legislations such as the End-of-Life Vehicle Directive and the Waste Electrical and Electronic Equipment Directive to recycle PGMs from catalytic converters due to their high rate of recovery (13).
Due to initiatives for environmental legislation and the low availability of these three PGMs in nature, platinum, palladium, and rhodium are heavily recycled, and can be recovered with approximately 95% efficiency (13). These three PGMs are mostly recycled from catalytic converters, as shown in the process presented in Figure 4.

Figure 4: The above shows a concept diagram for recycling catalytic converters (7).
Once the powder within a catalytic converter is ground and homogenous, it is sent to be analyzed for elemental composition. Those values are then used to optimize the process to obtain the highest recovery rate of PGMs from the input feed.
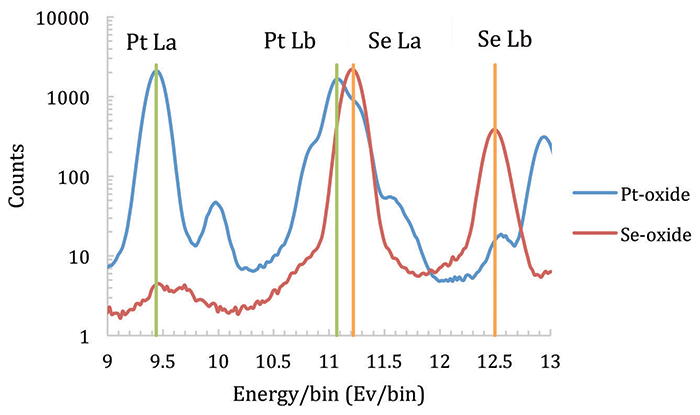
Figure 5: Overlap of XRF for the oxides of platinum (Pt) and selenium (Se).
Principles of XRF
A handheld XRF instrument can be divided into three main parts: an X-ray source, a detector, and a processor. First, a tube source emits X-rays toward a target sample. The sample then emits a characteristic wavelength of X-rays as photons that enter the analyzer, which are read by the detector. X-ray energies are specific to an element, so the processor uses this information and interprets the data into chemistry that can be read by a user (14).
Handheld XRF has methods that cater to different applications and different elements of interest. X-ray analysis depth is dependent on the physical properties of the sample and the information reaching the detector (Table I).
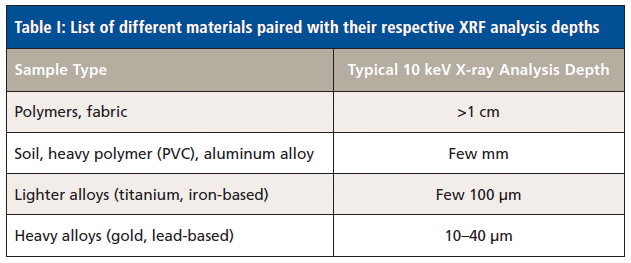
To obtain maximum accuracy with handheld XRF, the powder being analyzed needs to be dry, homogenized, and finely ground. If the sample is not ground finely enough, the difference in particle sizes may cause a sifting effect, resulting in an unmixed sample. This would result in a granular effect, where elements of a larger size gravitate toward the top, and those of a smaller size fall towards the bottom of a sample cup. For catalytic converters, the monoliths must be ground prior to handheld XRF testing. Some users desire in situ testing without sample preparation. For this to work effectively, user-defined software factors need to be applied to account for the differences in the physical state of the sample.
Experimental
Five samples were tested with an Olympus Vanta handheld XRF analyzer to assess accuracy. The results (shown in Figure 6) are ordered from the highest to lowest concentrations. For testing conditions, each sample was kept in place for all five repeats. The test times for the 40 kV beam varied from 10, 20, and 30 s, and the test time for the 10 kV beam was 30 s for all tests.
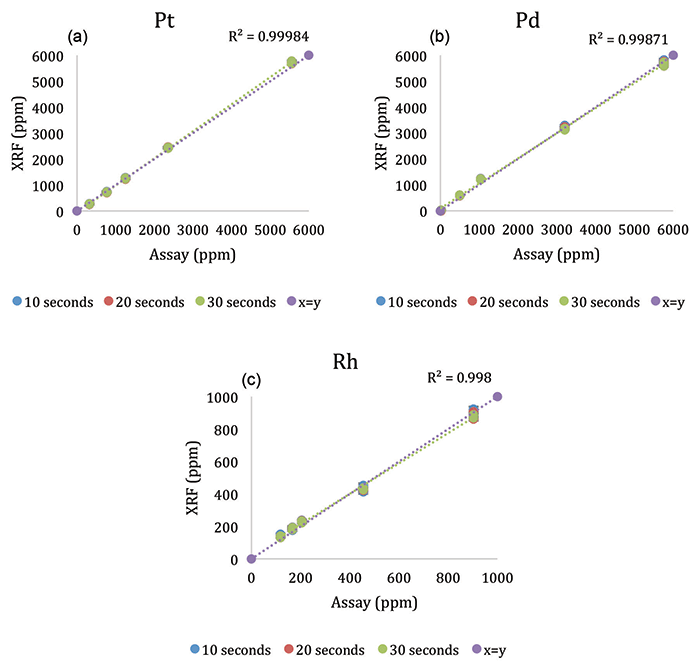
Figure 6: The charts show accuracy with the assay (ppm) on the x-axis and the XRF analysis results (ppm) on the y-axis. The illustration shows (a) Pt accuracy, (b) Pd accuracy, and (c) Rh accuracy.
We tested precision using the same parameters described above for the accuracy tests, and the results are shown in Figure 7 for Pt, Pd, and Rh. For each sample, the 1-sigma error was shown to decrease as test (measurement) time increases. In other words, as test times increase, precision also increases. At a certain point, longer test times diminish returns, so it is not useful to increase test times beyond this point.
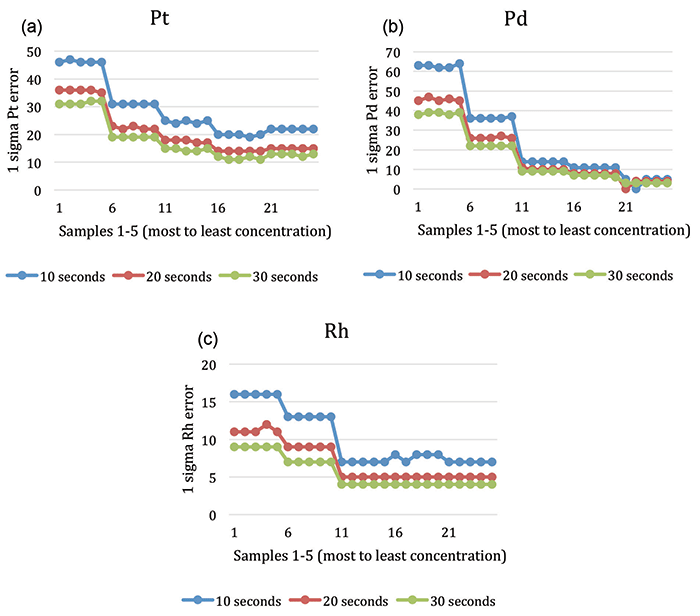
Figure 7: All charts show the precision for 5 samples (each repeat of 5 shown) for different 40 kV beam 1 times (in seconds). The illustration shows (a) the Pt precision, (b) the Pd precision, and (c) the Rh precision.
Lastly, the relative standard deviation is shown in Figure 8 for each of the five samples, arranged from highest to lowest concentrations. The same test parameters were used as described above.
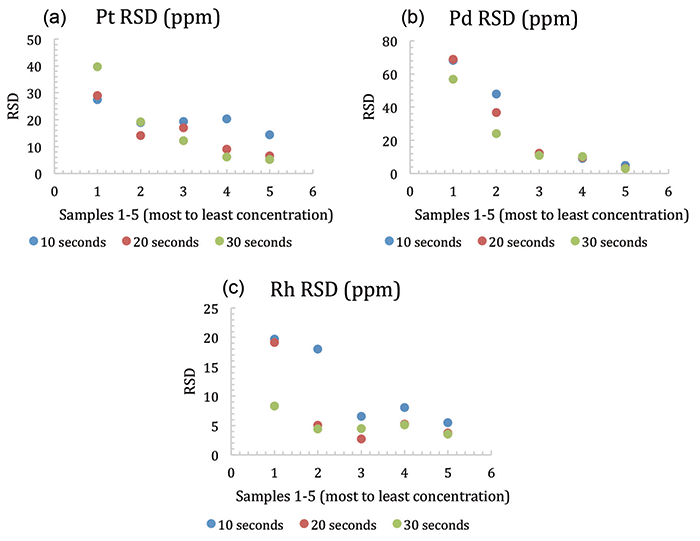
Figure 8: The charts show the relative standard deviation (RSD) for 5 samples (each repeat of 5 shown) for different 40 kV beam 1 time (in seconds). The figure shows (a) the Pt RSD, (b) the Pd RSD, and (c) the Rh RSD.
The results for Pt, Pd, and Rh show that, overall, the relative standard deviation decreases as measurement time increases. This is most pronounced in Pt at low concentrations (note standard numbers 3, 4, and 5 assayed to 1200, 700, and 300 ppm, respectively). Catalysts, in general, do not exceed 10,000 ppm concentration levels for any of these three elements.
Conclusion
Handheld XRF can provide accurate, precise, fast, and nondestructive analysis of finely ground car catalyst material. The low levels of PGM concentrations obtained from 40, 50, and 60 s tests provided repeatable results. Precision also improved as test time increased, however at the longer test time of 30 s, the return on precision diminished, and it was not as valuable to continue increasing test times. The relative standard deviation also improved overall at longer test times.
References
(1) S. Govender and H.B. Friedrich, Catalysts 7(2), 62 (2017).
(2) A. Kahlon and T. Tang, Catalytic Converters (Libretexts, 2018). Retrieved from https://chem.libretexts.org/Core/Physical_and_Theoretical_Chemistry/Kinetics/Case_Studies:_Kinetics/Catalytic_Converters.
(3) A. Cybulski and J.A. Moulijn, Structured Catalysts and Reactors (Taylor & Francis, Boca Raton, Florida, 2nd ed., 2005).
(4) A.R. Drews, Adv. X-ray Anal. 45, 472–477 (2002).
(5) Manufacturers of Emissions Control Association, Clean Air Facts–The Catalytic Converter: Technology for Clean Air (Arlington, Virginia, 2011).
(6) Khan Academy, Types of Catalysts (2018). Retrieved from https://www.khanacademy.org/science/chemistry/chem-kinetics/arrhenius-equation/a/types-of-catalysts
(7) Chemical Engineering Essentials for the CPI Professional, New Frontiers in Metals Recycling (2015). Retrieved from http://www.chemengonline.com/new-frontiers-metals-recycling/
(8) Manufacturers of Emission Controls Association, Technology: Catalytic Converters in Cars (2018). Retrieved from http://www.meca.org/technology/technology-details?id=5
(9) A. York, & The Royal Society of Chemists, The Evolution of Catalytic Converters (2011). Retrieved from https://eic.rsc.org/feature/the-evolution-of-catalytic-converters/2020252.article
(10) National Programme on Technology Enhanced Learning, Lean de-NOx Catalysts and Catalyst Poisoning (2017). Retrieved from http://nptel.ac.in/courses/112104033/lecture24/24_3.html
(11) A. Faiz, M.P. Walsh, and C. Weaver, Air Pollution From Motor Vehicles: Standards and Technologies for Controlling Emissions (The World Bank, Washington, D.C., 1996).
(12) L. Ebdon, L. Pitts, R. Cornelis, H. Crews, O. Donard, and P. Quevauvillier, Eds. Trace Element Speciation for Environment, Food, and Health (Royal Society of Chemistry, Cambridge, United Kingdom, 2001), pp. 176–187.
(13) International Platinum Group Metals Association, Case Studies, 2018. Retrieved from https://ipa-news.com/index/sustainability/case-studies.html
(14) EPA Technology Analysis and Field Analytic Technologies, X-Ray Fluorescence (2016). Retrieved from https://clu-in.org/characterization/technologies/xrf.cfm
Karen Paklin is an applications scientist at Olympus, in Waltham, Massachusetts. Direct correspondence to: karen.paklin@olympus-ossa.com

New Study Reveals Insights into Phenol’s Behavior in Ice
April 16th 2025A new study published in Spectrochimica Acta Part A by Dominik Heger and colleagues at Masaryk University reveals that phenol's photophysical properties change significantly when frozen, potentially enabling its breakdown by sunlight in icy environments.