2D COS of Temperature-Dependent Raman Spectra of Amorphous, Nonoriented Polyethylene Terephthalate to Separate Molecular Conformational Changes from True Crystallization
Because of the structural use of polymers, it is important to understand the origin of their strength, elongation to break, elasticity, flexibility, and so on. It is in the very low frequency region (the so called “terahertz” range) where it is believed that the real indicators for crystallinity appear.
In our previous column we discussed the application of two-dimensional correlation spectroscopy (2D COS) to the temperature-dependent, polarized Raman spectra of polyethylene terephthalate (PET) fibers to get some insight into the conformational changes that occur as the material’s morphology is changing. As indicated at the time, we are now going to show spectra that include the very low frequency region (the so called “terahertz” range) where it is believed that the real indicators for crystallinity appear. By applying the interpretation rules of 2D COS, we can determine the sequence of changes that occur as the polymer is crystallizing.
After a discussion with Professor Noda, and under his recommendation, we decided this time to examine the temperature dependent behavior of amorphous, nonoriented polyethylene terephthalate (PET), because when looking at fibers it becomes difficult to disentangle the effects of orientation from crystallization. We prepared a fully amorphous bit of PET by melting a pellet in a nonstick frying pan and quenching it in ice water. The rapid solidification of the material prevents crystallization that can only occur on a longer timescale.
Figure 1 shows the spectra of the amorphous material after the rapid quench, and "crystalline" material after a slow cool. Note that polymers are almost never 100% crystalline, and PET is never seen to be much more than 50% crystalline. A comparison of these spectra reminds us which bands are robust indicators of changes that have been associated with crystallinity. In these spectra, however, we also see the low-frequency contributions. In the low-frequency region, shown in Figure 2, there are several spectral features. There is the strict Rayleigh scattering caused by "particles" much smaller than the laser wavelength; the spectral width does not change, but the scattering is so intense as to overwhelm the detector under the conditions that we used. Then there is "quasi-elastic" scattering that is centered around the laser wavelength but broadened by interactions with the material sample. In amorphous material there can also be scattering by acoustic phonons, but in crystalline solids that scattering is forbidden by the selection rule based on conservation of momentum in an ordered material. In amorphous materials, where order is lacking, scattering by acoustic modes is possible. This band, called the boson, is broad because the intensity at each wavenumber shift corresponds to the density of vibrational states at that energy; in fact, if one needs to determine the "true" boson peak, the spectrum has to be divided by the Bose factor (n(ω) + 1). There is also the possibility of a longitudinal acoustic mode (LAM), which is also an acoustic mode but is described as an accordion-like motion in crystalline lamellae of polymers. Actually, I have not seen any reports of LAM modes in PET, and enquiries of Neil Everall and John Chalmers confirmed this. Other possibilities for low-frequency scattering include both rotational and translational motion of the chains (1), but in the case of PET, there cannot be translational phonons because there is only one chain per unit cell (2).
Raman Spectra of Amorphous and Crystalline PET
The spectra shown in Figures 1–5 are displayed several ways. Initially the full spectra (-300 to 1800 cm-1) are displayed; note that the bands in the low-frequency region and the bands between 950 and 1200 cm-1, as well as 1550–1750 cm-1 have been band fit because these bands have been shown to reflect the molecular configurations that are consistent with the crystalline state. The second display shows the low-frequency region, and the remaining displays show the fingerprint region with varying enlargements to enhance the understanding of the changes. I have displayed the spectra this way because the low-frequency region is so intense that not much else can be seen easily in the full display.
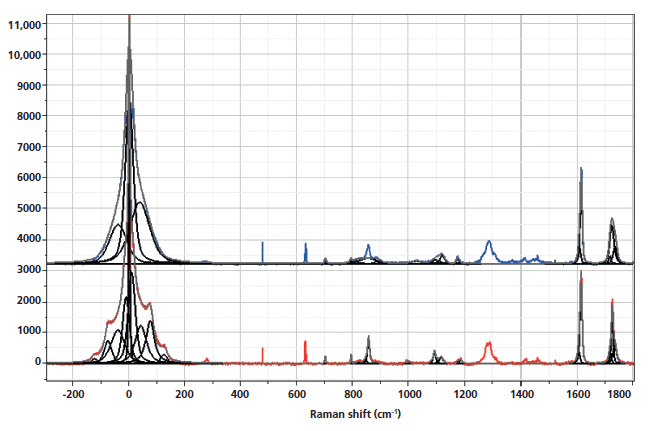
Figure 1: Raman spectra of amorphous, nonoriented sample of PET (top) versus crystalline nonoriented material (bottom).
The focus of this column is to determine if, and how well, two-dimensional correlation (2D COS) Raman spectroscopy can provide these details without going to the effort of band-fitting, whose results are known to be non-unique in many cases.
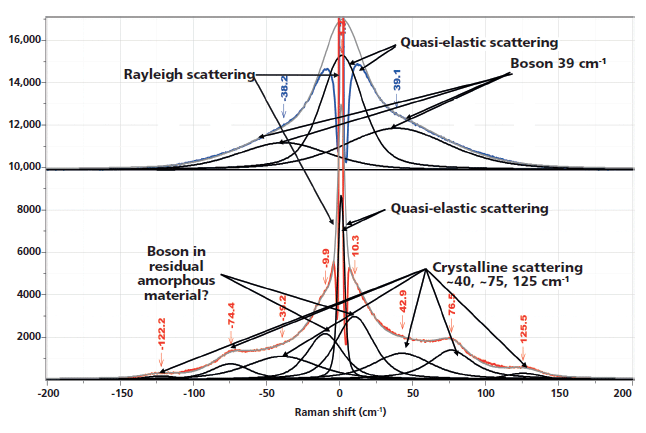
Figure 2: Low-frequency, Stokes–anti-Stokes Raman spectra of nonoriented amorphous (top) and nonoriented crystalline (bottom) PET.
The rigorous definition of crystallinity is uniform packing with translational symmetry. For polymers this requires uniform conformation of the chains. Relying on the discussion in the textbook by Bower and Maddams (3), who cite Zerbi, Ciampelli, and Zamboni's definitions for regularity peaks, we can begin to differentiate different morphological states. Zerbi and colleagues define three types of regularity peaks: peaks assigned to conformational regularity (that is, trans versus gauche rotational isomerism) that can occur in both the solid and melt or solution but with varying relative intensities; the misnamed "crystallinity" peaks arising from long stereoregular chains; and then true crystallinity peaks that directly reflect interchain interactions. Although specific peaks in the spectra of polymers have been well correlated with crystallinity (such as by correlating with density), if one does not understand the true nature of the vibration represented by a particular spectral band, the correlation may yield misleading results under some circumstances. Specifically in the case of PET, the carbonyl (>C=O) peak has been correlated with crystallinity following the 1972 article by Melveger (4). However, even Melveger stated that "the assumption of constant amorphous density in oriented samples may not be valid," which he knew would invalidate his method; in fact, the oriented, amorphous (mesomorphic) polymer would have different density than a randomly oriented amorphous sample.
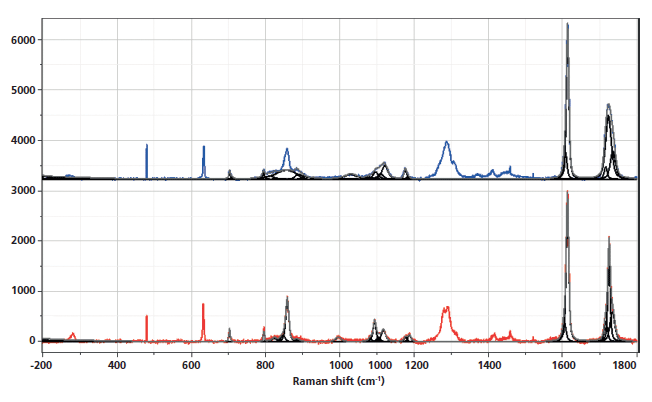
Figure 3: Fingerprint and aromatic–carbonyl regions of the Raman spectra of nonoriented amorphous (top) and crystalline (bottom) PET. The regions where bands have been associated with morphological changes have been band-fit and the following two figures will show the results of band-fitting more clearly.
I will be citing band assignments from the literature that have been helpful in characterizing PET morphology. However, to extract the maximum of information, one needs to fit the bands in the spectra (which itself is an operation that does not always yield unique results). The hope is that similar information can be extracted using 2D COS with much less work, and in addition, that the possibility for introducing artifacts from band-fitting will be avoided. Another important advantage is that bands that do not separate spectrally may separate in the 2D COS plots.
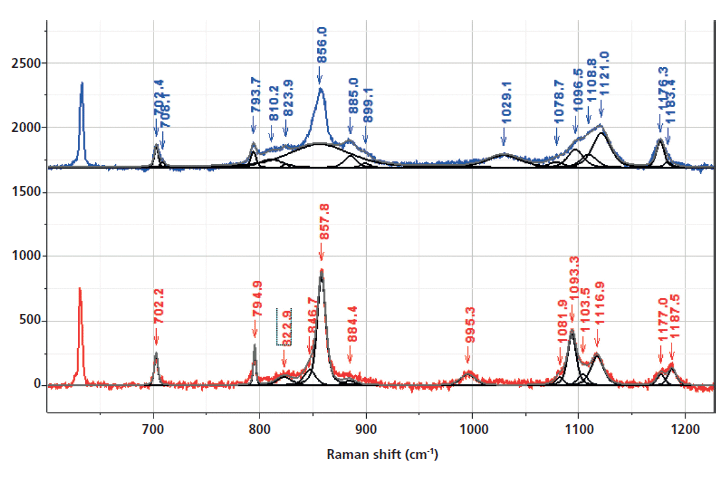
Figure 4: Fingerprint region of the Raman spectra of nonoriented amorphous (top) and crystalline (bottom) PET. The regions where bands have been associated with morphological changes have been band-fit.
Spectral Interpretations and What to Look for in 2D COS
I know of only two publications showing spectra of the low-frequency behavior of PET in the literature (1,5). Bulkin and colleagues (1) note that the normal mode analysis by Boerio and colleagues (6), predicts Bg bands at 119 and 61 cm-1 that are derived from a twisting motion between the carbonyl carbon and the aromatic ring, and twisting about the same carbonyl carbon and the ester oxygen atom. In fact, the Boerio publication also predicts a third mode at 35 cm-1 composed of a third combination of the same twisting motions. The spectra in Figure 2 clearly show that bands close to these values only occur in the crystalline state, presumably because the variety of conformations in the amorphous state would wash out any defined peak. (The lowest frequency band is less obvious in the original spectra, but I added it to the fit to improve the result-before I noticed the third low-frequency band in Boerio and colleagues original Table VIII [6]!)
Now we want to examine more carefully the assignments of the "crystalline" sensitive bands in the fingerprint and carbonyl region to determine if 2D COS can tell us the order in which the conformations change, relative to the low-frequency bands, and how that impacts crystallization. However, we need to remember that the low-frequency bands do not directly reflect packing order (which is impossible in PET because there is only one chain in the unit cell), but still may be informative. Because the low-frequency "crystalline" bands that we are seeing presumably reflect the twisting motions determined by Boerio and colleagues (6), we may be able to argue that it is only when the chain is highly ordered that these bands will emerge from the quasi-elastic scattering.
Inspection of the bands in the fingerprint/carbonyl region indicates that the biggest "crystallization"-sensitive change is the growth and sharpening of the central carbonyl band near 1725 cm-1 (Figure 5). There is actually much in the literature describing these changes. The carbonyl band can be fit by three components (7) (1716 and 1735 cm-1, which are always broad, and 1725 cm-1, which sharpens in the crystalline phase).
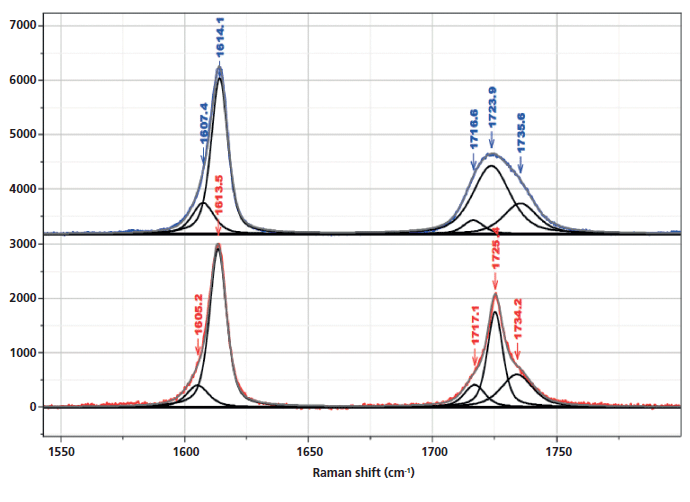
Figure 5: Raman spectrum in the region of the aromatic and carbonyl bands of nonoriented amorphous (top) and crystalline (bottom) PET, enlarged to provide better detail of the fitted bands, in particular the ones that have been associated with changes in morphology.
Possibly of more interest are the bands that reflect gauche to trans conformational changes because the crystalline regions require the trans conformation. Until recently, I believed that this was based on "reasonableness," but in fact I found a publication in which 2D nuclear magnetic resonance (NMR) data were able to quantify the amounts of trans and gauche conformers and confirm that the crystalline form requires the trans conformation (8).
The bulk of the publications on Raman spectra of oriented PET (fibers and films) document the ability to measure orientation (by controlling polarization conditions) and gauche-trans transconformers by relying on normal mode analysis and changes that parallel the development of orientation, which require the trans conformation (7,9–13). The bands that have been recognized as gauche conformers (which will put kinks into the polymer chain in amorphous regions) are at 886 and 1030 cm-1 (9). Bands indicating the trans conformer are at 998 and 1096 cm-1. The 998 cm-1 band is associated with O-CH2 and C-C stretching of the glycol unit, and the 1096 cm-1 band has been assigned to a combination of the C-O stretch, the C-O-C bend, the C-C-O bend, and the C-C stretch (all motions also in the glycol unit). Both the 998 and 1096 cm-1 bands are markers for the crystalline conformation. The amorphous material has a broad band centered near 1120 cm-1, with a shoulder near 1100 cm-1 from which the "crystal" contributions grow. I put "crystal" in quotes because we are trying to separate crystal effects from conformational effects, and the normal mode calculations were presumably done for the crystalline conformation known from X-ray diffraction (XRD).
The band-fit in the fingerprint region in Figure 4 allows one to follow the behavior of the bands identified as reflecting the trans versus gauche conformations. We confirm that the band at 886 cm-1 drops in intensity in the crystalline form, while the band at 995 cm-1 grows. In the region around 1100 cm-1 we see the growth of the trans band at 1096 cm-1 as well as other smaller features (such as a shoulder at 1080 cm-1), some of which have been noticed by other workers (10). It would take a lot of work to sort out all of these small features using calculations, but by inspecting the 2D COS plots, we hope to see what is systematic, and even separate features that do not resolve spectrally because they are too close together. The plots that we will show were produced by 2D Shige (14) software available on the internet.
First-Level Use of 2D COS Results
2D COS software produces two two-dimensional plots of a set of spectra generated systematically by changing a variable that affects the spectrum. The two axes correspond to the wavelength (or wavenumber shift for Raman) that is spanned by the data. The synchronous plots, Φ(ν1,ν2) indicate which bands change simultaneously; note that simultaneous may mean in the same direction or in opposite directions. To be more explicit, if one species is converting to a second, the bands of the first species will decrease as the bands of the second increase. This change will be shown as two different colors in the 2D COS Φ(ν1,ν2) plot. The asynchronous plots, ψ(ν1,ν2), are a bit more difficult to understand, but can provide more information because they correlate sequential changes and responses from different origins. The asynchronous plot, ν1,ν2) will have no contributions for ν1= ν2. What you do is compare Φ(ν1,ν2) to ψ(ν1,ν2). If the two have the same sign, then the change occurs at ν1 before ν2. If they have different signs, then the change occurs at ν1 after ν2. In our case, we want to see if we can determine the order in which the changes occur in the glycol region, the carbonyl group, and the very low frequency region.
Figure 6 shows both the synchronous and the asynchronous plots for the full spectra of the melt-quenched sample which were measured as a function of temperature between room temperature and just above the melt, and then again at room temperature after a slow cool that presumably yields a crystalline material. The intensities in red versus blue indicate that the output of the 2D COS calculation produces opposite signs at these points. To see more clearly what is in these plots, they will be enlarged in the regions of interest.
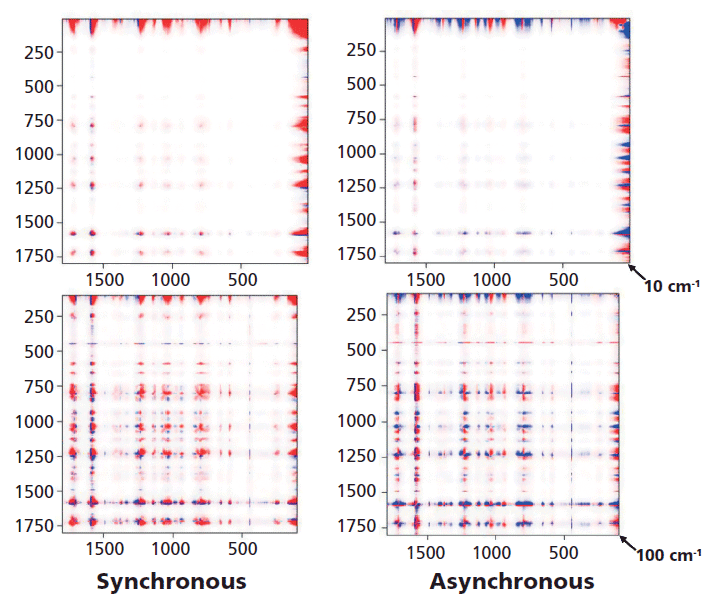
Figure 6: 2D COS of an amorphous sample that was followed as the temperature was raised from room temperature beyond Tg (~90 °C), to the melt at ~230 °C and then again at room temperature after a slow cool which enables the material to crystallize. Because of detector saturation in the Rayleigh line at 0 cm-1 these plots were started at 10 cm-1 (top) and 100 cm-1 (bottom).
Figure 7 shows the 2D COS plots between 700 and 1200 cm-1, Figure 8 between 1550 and 1800 cm-1, and Figure 9 between 700 and 1200 cm-1 on one axis and then 1550 and 1800 cm-1 on the other axis because these spectra indicate how changes in the conformation of the glycol are related to the changes in the carbonyl region. Then Figure 10 shows slices of the 2D COS plots with almost the full spectrum along y (100 to 1800 cm-1) and the low frequency region along x (50 to 500 cm-1). Having normalized all spectra to the peak intensity of the aromatic band at 1614 cm-1 (the most constant feature in the spectrum) we can look at the spectra and say, for example, that the 1120 cm-1 band does not change very much but the 1096 cm-1 band grows as the material is converted to the trans conformation as the temperature is raised above Tg. In fact, the asynchronous plot does show these bands changing sequentially.
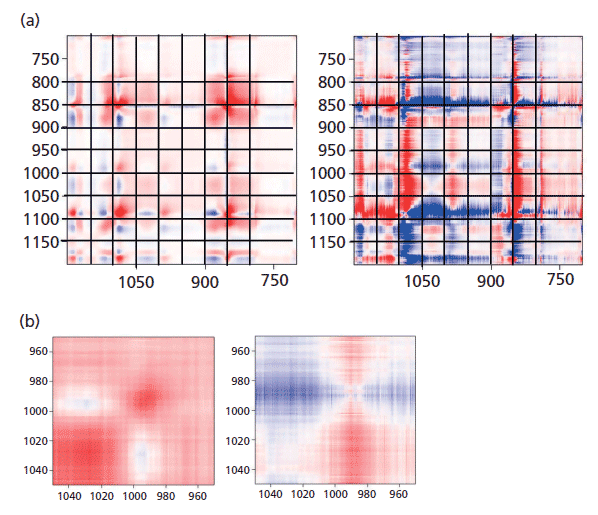
Figure 7: (a) Synchronous (left) versus asynchronous (right) in the region of the glycol bands where changes associated with "crystallization" are known to occur. (b) Synchronous (left) versus asynchronous (right) in the region of the glycol bands at 1000 cm-1 where changes associated with "crystallization" are known to occur.
To see this change more clearly, first look at Figure 7, which shows the 2D COS plots in the region of the glycol bands. On the synchronous plot on the left we can see clearly the gain in intensity (red color) of the band at 1096 cm-1 but the increase in intensity of the band at 1000 cm-1 is less clear. That only really shows up in Figure 7b where the region around 1000 cm-1 is expanded. Now, when examining the horizontal axis close to 1000 cm-1 we can see a faint blue area centered at x = 1030 cm-1, which is the band that is replaced by the 1000 cm-1 band in the oriented or crystalline form. In the asynchronous plot we confirm that the band near 1000 cm-1 appears after the band at 1030 cm-1.
In Figure 8, we can examine the carbonyl region in the same way. In the synchronous plot we can see the strong increase in the band at 1725 cm-1 that is known to increase in the crystal form. In addition, we see that the band near 1720 cm-1 is much less affected than the band at 1725 cm-1. The band near 1735 cm-1 is curiously increasing with the 1725 cm-1 band. We can start to suggest assignments to the components in the carbonyl region. Note that there are two carbonyl groups on each aromatic group that presumably can interact. In the crystalline form, where there is a center of symmetry, when they move in sync the mode will be Raman active, but when they move out of phase, the motion will be infrared (IR) active only. But in the amorphous material, there is no center of symmetry so the selection rule is no longer valid. Presumably both modes of motion will be active in the Raman spectrum-accounting for the two broad bands near 1720 and 1735 cm-1, and my guess is that the band at 1720 cm-1 would be the asymmetric (more IR active) mode, which is consistent to the assignment of the overtone of the carbonyl band in the IR spectrum at 3433 cm-1 (15).
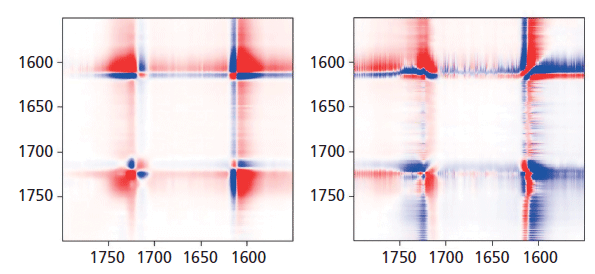
Figure 8: Synchronous (left) versus asynchronous (right) in the region of the aromatic ring and carbonyl bands where sharpening of the carbonyl is known to be associated with "crystallization."
Now we want to look at the relationships between the bands of the glycol group and the carbonyl. Figure 9 shows the 2D COS map for 700 to 1200 cm-1 along y (glycol bands) and 1550 to 1800 cm-1 along x (aromatic and carbonyl bands). Let's look at the y-axis at 1725 cm-1. There are positive bands just under 1000 cm-1, and at 1096 cm-1. However, there are negative bands centered at about 875, 1030, and 1120 cm-1. These are bands that we know have decreased intensity in the "crystalline" form when the 1725 cm-1 carbonyl band grows. There are also two lobes between 1175 and 1200 cm-1 that represent a band shift in the crystalline form, something that we haven't focused on in this discussion. But clearly one is going up as the other is going down-an observation consistent with some of the amorphous material being consumed by the crystalline transformation. Note that the vertical axis just above 1600 cm-1 also confirms the presence of a second band in the aromatic region that we had to consistently use in the band fitting; the two components clearly separate even though the lower energy part only appeared as an asymmetry in the spectral traces.
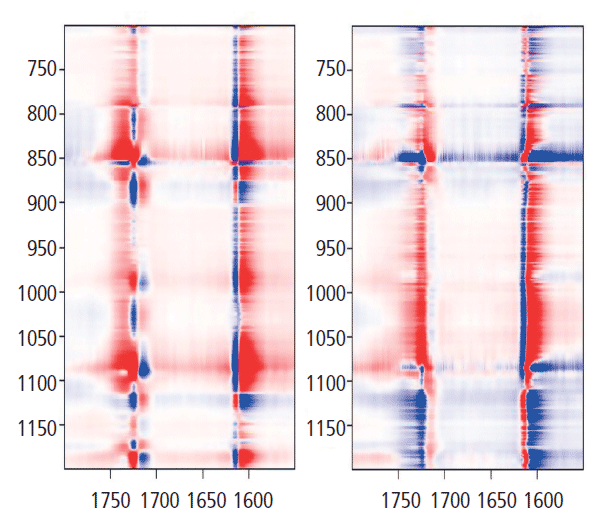
Figure 9: Synchronous (left) versus asynchronous (right) 2D COS in the heteroregion, crossing the glycol behavior with the carbonyl behavior.
Finally, we look at the relationship between the low-frequency spectrum and the fingerprint or aromatic-carbonyl region that is shown in Figure 10. Actually, looking for the relationship between a low-frequency crystalline band (such as the rotation at 78 cm-1) and the higher-frequency vibrations is not so straightforward. Perhaps one can examine the bands representing combinations of C-C and C-O stretches (700–1150 cm-1) in comparison to the low-frequency twists, but in discussing these results with Professor Noda, we realized that there was a problem with the experimental design for the low-frequency data. Because the spectral intensity is modulated by the Bose factor (which is a function of the spectral shift and the temperature), and that factor will be quite important in the low-frequency region, any comparison of low-frequency spectra recorded at different temperatures will have significant systematic errors. So, to achieve our goal of determining the relationship between atomic motions and crystallinity, we now realize that we have to make a different set of measurements. The next set of measurements will be an isothermal crystallization because under these conditions the Bose factor will not change from spectrum to spectrum. Stay tuned for a future installment on this topic.
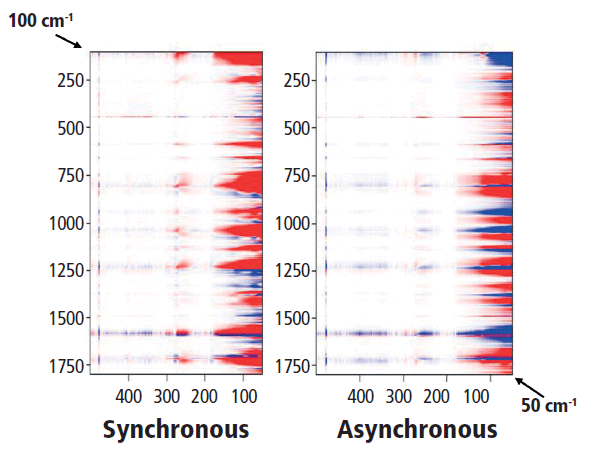
Figure 10: Synchronous (left) versus asynchronous (right) 2D COS in the heteroregion, crossing the full spectrum with the low-frequency behavior.
Discussion
The novice studying polymer behavior can be overwhelmed by the concepts and nomenclature that are presented. A polymer can be "crystalline," but the nature of the crystallinity will be different than for other solids based on smaller molecular species. The point to be recognized is that because the length dimension of the chain is so much larger than its lateral dimensions there is the certainty that there will be chain "entanglements." Presumably, these chain entanglements are what affects the limitations preventing 100% crystallization. Once the chains are entangled, it is highly unlikely that they will magically untangle and align. Models of partially crystalline polymers describe regions where the chains do line up, but there may be limited lengths of a given chain that will reside in crystalline regions, while the rest of the same chain will be in amorphous regions. Then if the material is "drawn," which means stretched out, parts of chains can likewise be lined up, and the entangled parts will remain in amorphous disordered regions. What we found many years ago (16) in our PET fibers that had been drawn at room temperature was that they aligned, without crystallizing because the treatment was done well below Tg (~90 °C). And we also found that the fiber that originally had the least amount of orientation and crystallinity from manufacture was the one that could be drawn and oriented the most.
Because of the structural use of polymers, it is important to understand the origin of their strength, elongation to break, elasticity, flexibility, and so on. Clearly, only knowing the amount of crystalline versus amorphous material will not tell the entire story. And that is where spectroscopy can help. Unlike XRD which can only characterize the crystalline phase, spectroscopy has the capability to analyze the amorphous phase as well, including its degree of orientation and the conformation of some important functional groups. Note that it will not be possible to orient entangled material, but the entangled material may increase strength against breakage. By drawing the molecular chains, the material is predisposed to crystallization. Thus, it becomes clear why spectroscopy, in combination with other physical measurements, can be critical in predicting a material's behavior, based on its history.
So, I haven't yet gotten the result that I am after-that is, to determine details of the crystallization process in polyethylene terephthalate. Stay tuned. This determination will require another set of measurements. My apologies to the purists of my readers who feel that an unfinished project is not worthy of publication. Remember that my goal here is to indicate what this technology can offer, so showing the entire process in painful detail may be helpful to some.
Acknowledgment
My sincerest thanks to Professor Isao Noda for encouraging me in this work and making extremely useful critical comments. I should also indicate how sad I am that Herman Noether, with whom I originally worked on these polymers, is no longer with us to see how useful this technology can be to his polymer physics.
References
(1) F.J. Deblase, M.L. McKelvy, M. Lewin, and B.J. Bulkin, J. Polym. Sci Polym. Lett. Ed. 23, 109–115 (1985).
(2) R. deDaubeny, C.W. Bunn, and C.J. Brown, Proc. Roy. Soc. A. 226, 1167 (1954).
(3) D.I. Bower and W.F. Maddams, in the Cambridge Solid State Science Series, E.A. Davis and I.M. Ward, Eds. (Cambridge U. Press, UK, 1992).
(4) A.J. Melveger, J. Polym. Sci. A. 10, 317–322 (1972).
(5) T. Achibat, A. Boukenter, E. Duval, G. Lorentz, and S. Etienne, J. Chem. Phys. 95(4), 2949–2954 (1991).
(6) F.J. Boerio, S.K. Bahl, and G.E. McGraw, J. Polym.Sci., Polym. Phys. 14, 1029–1046 1976)
(7) F. Adar, D. Armellino, and H. Noether, "Raman Microprobe Spectroscopy of Polyethylene Terephthalate Fibers: Separation by Band-Fitting of Amorphous-Oriented and Crystalline Components," SPIE 1336 Raman and Luminescence Spectroscopies in Technology II, 182–193 (1990).
(8) K. Schmidt-Rohr, W. Hu, and Z. Zumbulyadis, Science 280, 714–717 (1998).
(9) F. Adar and H. Noether, "Use of Band-Fitted Raman Spectra for the Characterization of Polymers and Measurement of the Oriented Amorphous Phase," SPIE 1636 Applied Spectroscopy in Materials Science (1992).
(10) J.C. Rodriguez-Cabello, L. Quintanilla, and J.M. Pastor, J. Raman Spectroscopy 25, 335–344 (1994).
(11) C.C.C. Lesko, J.F. Rabolt, R.M. Ikeda, B. Chase, and A. Kennedy, J. Molecular Structure 521, 127–136 (2000)
(12) S. Yang and S. Michielsen, Macromolecules 35(27), 10108–10113 (2002).
(13) M. Richard-Lacroix and C. Pellerin, Macromolecules 45, 1946–1953 (2012).
(14) 2DShige, developed by Prof. Shigeaki Morita (Osaka Electro-Communication University, Japan). Available at: https://sites.google.com/site/shigemorita/home/2dshige.
(15) G. Dandiliooti, G.K. Govaris, and V.G. Gregoriou, Appl. Spec. 58(9), 1082–1092 (2004).
(16) F. Adar and H. Noether, "Use of Band-Fitted Raman Spectra for the Physical Characterization of Polymers and Measurement of the Oriented Amorphous Phase," SPIE 1636 Applied Spectroscopy in Materials Science II, 42–52 (1992).
Fran Adar

Fran Adar is the Principal Raman Applications Scientist for Horiba Scientific in Edison, New Jersey. Direct correspondence to: SpectroscopyEdit@UBM.com

A Proposal for the Origin of the Near-Ubiquitous Fluorescence in Raman Spectra
February 14th 2025In this column, I describe what I believe may be the origin of this fluorescence emission and support my conjecture with some measurements of polycyclic aromatic hydrocarbons (PAHs). Understanding the origin of these interfering backgrounds may enable you to design experiments with less interference, avoid the laser illuminations that make things worse, or both.
Raman Microscopy for Characterizing Defects in SiC
January 2nd 2025Because there is a different Raman signature for each of the polymorphs as well as the contaminants, Raman microscopy is an ideal tool for analyzing the structure of these materials as well as identifying possible contaminants that would also interfere with performance.