Determination of Corrosion Inhibitor–Lubricity Improver in Jet Fuels by Liquid Chromatography–Electrospray Ionization Mass Spectrometry
Military jet fuel (JP-8) is very similar to commercial jet fuel (Jet A) except for the presence of three additives, fuel system icing inhibitor, corrosion inhibitor–lubricity improver (CI-LI), and antistatic additive, which are added to improve characteristics of JP-8.
Military jet fuel (JP-8) is very similar to commercial jet fuel (Jet A) except for the presence of three additives, fuel system icing inhibitor, corrosion inhibitor–lubricity improver (CI-LI), and antistatic additive, which are added to improve characteristics of JP-8. Of particular interest is the CI-LI additive; the most common active ingredient is a dimer of linoleic acid. This article focuses on quantification of the active ingredient in the CI-LI additive by liquid chromatography–mass spectrometry (LC–MS). This method will allow the determination of CI-LI content in military jet fuel samples.
Aviation fuels consist primarily of a complex mixture of linear, branched, and cyclic hydrocarbons (C8–C16) (1), aromatic carbons (2) with trace amounts of polar impurities. The polar impurities are important because their reactivity has a dramatic effect on the formation of deposits in the fuel (3). Military aviation fuels (JP-8) are supplemented by a series of additives including fuel system icing inhibitor (FSII), antistatic additive (static dissipator additive, or SDA), and corrosion inhibitor–lubricity improver (CI-LI) (4). The first two of the additives are easily analyzed by gas chromatography (GC) or other experimental methods, but the CI-LI additive is too high in molecular weight for GC. The only documented method for its determination is a complex method involving a combination of extraction and gel permeation chromatography (GPC) (5).
The typical active ingredient in several CI-LI additives is a dimer of linoleic acid. The dimer is usually prepared by the clay catalyzed dimerization of linoleic acid, which results in the formation of a mixture of acyclic, monocyclic, and bicyclic compounds (6). The reaction also results in a variable number of remaining double bonds (7,8) providing compounds with molecular weights ranging from 556 to 564 amu. The dimer of linoleic acid has found wide applicability in a range of commercial products, including cosmetics and industrial lubricants (9). It has been shown to reduce corrosion (10) and improve the lubricity (11) of crude and refined oils. In military aviation fuels, it is added to reduce the wear in roller bearings in the fuel pumps and also reduce corrosion in the fuel system tubing. Given its important function in the fuel system, analysis of fuels for their CI-LI content has become more important.
High performance liquid chromatography (HPLC) has been an important tool for the analysis and characterization of fuel samples (12). The method has been shown to group components conveniently into nonpolar and polar components. However, it does not provide an analysis of the specific contaminants in the sample. Liquid chromatography–electrospray ionization mass spectrometry (LC–ESI-MS) has been used in the analysis of specific polar components in fuels (13). Electrospray ionization is especially convenient as a soft ionization method that does not ionize the nonpolar components of the fuel sample (14). The negative ion mode is particularly useful, because of the common polar impurities only the phenols appear as negative ions under normal conditions. The dimer acid ionizes efficiently in negative ion mode. In addition, the high molecular weight of the dimer acid also separates it from the common phenols found in fuels.
In this study, we describe a simple method for the determination of CI-LI in aviation fuels using HPLC with ESI-MS detection. The method requires no sample preparation beyond dilution in methanol, provides a reproducible linear calibration curve, and suffers from few interferences. The method is demonstrated for the analysis of CI-LI in a series of fuel samples.
Experimental
Fuels and Additive Samples
Samples of eight different CI-LI additives approved for use in JP-8 fuels and several fuel samples containing CI-LI additives were supplied by the Fuels branch at Wright Patterson Air Force Base in Dayton, Ohio.
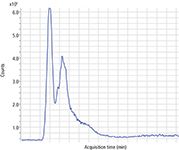
Figure 1: Total ion chromatogram for a typical aviation fuel sample.
HPLC–ESI-MS
The HPLC–ESI-MS system used for the current study was an Agilent 1200 series liquid chromatograph with an Agilent 6210 time-of-flight (TOF) mass spectrometer and an Agilent G3251A electrospray source. An Agilent C8, 2.1 mm i.d., 5-µm particle size, 100-Å pore size column was used for this study. The column was temperature controlled at 30 °C to create a consistent, slightly above ambient temperature condition improving the repeatability of the chromatographic separation. The electrospray source was operated at a capillary voltage of 3500 V, using an 11-L/min flow of nitrogen at a temperature of 325 °C as the drying gas. The nebulizer pressure was 50 psi and the fragmentor voltage was set to 200 V. Before reaching the TOF system, the sample loop was run through a diode-array detector to measure the UV absorbance at 254 nm. The mobile phase consisted of methanol (Fisher Scientific Optima LC–MS grade), with 0.1 vol% acetic acid added. The elution was carried out isocratically for all samples at a flow rate of 0.30 mL/min.

Figure 2: Total ion chromatogram and the selected ion chromatograms for several components of the CI-LI additive.
Results and Discussion
The HPLC chromatograms of fuel samples containing the CI-LI additive show a single major peak at a retention time of 0.9 min with a very weak broad feature at 1.2–2.3 min (Figure 1). The majority of the polar components are contained in the sharp peak at 0.9 min; however, the CI-LI additive appears in the broad later peak. The principal components observed in negative ion mode are phenols and carboxylic acids that form negative ions by losing a hydrogen ion in electrospray ionization (15).

Figure 3: Compounds formed from the dimerization of linoleic acid with clay catalysis: (a) acyclic, (b) monocyclic, and (c) bicyclic dilinoleic acid structures. The structures may contain additional double bonds.
To identify the main component in the CI-LI additive, the LC–MS chromatogram of all of the commercial additives was examined. The total ion chromatogram (TIC) shows a sharp peak at 0.9 min with a broad peak at 1.2–2.3 min. The peak at 0.9 min is because of polar components in the additive carrier. The broad feature between 1.2 and 2.3 min is because of the dilinoleic acid components in the additive. The TIC and extracted ion chromatograms (EIC) for various components are shown in Figure 2. The width of the second peak is consistent with the CI-LI additive being composed of a mixture of the monocyclic and bicyclic compounds with differing numbers of residual double bonds (Figure 3).
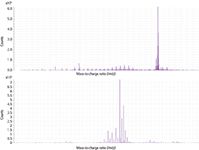
Figure 4: The mass spectrum of a CI-LI additive (top) and an expansion of the region around 560 amu (bottom).
The mass spectrum shows a cluster of peaks separated by 2 mass units centered on mass 561 amu (Figure 4). The high-resolution mass spectrum gives a mass consistent with the structures shown in Figure 2. The measured mass, actual mass, formula, and possible structures are shown in Table I.
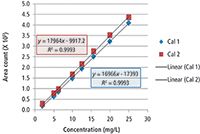
Figure 5: Calibration curves for the determination of CI-LI additive in a fuel sample.
To determine the amount of additive in fuel samples, a calibration curve was prepared by measuring several known concentrations of the CI-LI active ingredient dissolved in HPLC grade methanol. The area of the MS signal at 562.496 ± 0.004 amu was used for the determination. To ensure reproducibility of the measured calibration curve, a second set of samples was prepared and analyzed the next day. The calibration curves are shown in Figure 5. The calibration curve was found to be linear over a wide range of concentrations. The curves for the two days are nearly identical and the correlation coefficient of 0.99 indicates a good linear relationship. Similar calibration curves prepared for other masses found in the mass spectrum of the additive give similar results.
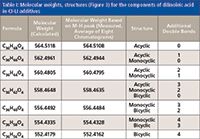
Table I: Molecular weights, structures (Figure 3) for the components of dilinoleic acid in CI-LI additives
The linear calibration curve allows the quantification of the CI-LI indicator to be achieved in a series of fuel samples. Based on the noise in the various samples and the noise in the blank, the detection limit for CI-LI in a fuel matrix is estimated at 0.2 mg/L. Based on a specification for JP-8 of 9–24 mg/L of the CI-LI additive in the fuel samples (4), the method allows for accurate quantitation of the additive in jet fuel samples. The analytical results for a series of seven different aviation fuel samples is shown in Table II. Each of the six JP-8 samples shows an appropriate CI-LI additive concentration, although many of the samples are near the lower end of the specified range.

Table II: CI-LI determination for several jet fuel samples (sample A is not formulated to include CI-LI and is included for reference)
Conclusions
The use of high performance liquid chromatography with time-of-flight mass spectrometry detection for the determination of dilinoleic acid as a corrosion inhibitor and lubricity increasing additive shows good linearity and day-to-day reproducibility. The high resolution of time-of-flight mass spectrometry ensures that other possible components of the fuel do not interfere significantly with the determination of the active component of the additive. The analysis is complicated by the complex nature of petroleum-based fuels and the distribution of molecular weights and structures associated with the available dilinoleic acid–based additives. For aircraft fuels without sample preparation beyond dilution with methanol, the detection limit is 0.3 mg/L. If solid-phase extraction techniques are used in sample preparation, a significantly lower detection limit is achievable.
Acknowledgments
This material is based on research sponsored by the Air Force Research Laboratory under agreement number FA8650-10-2-2934. The United States government is authorized to reproduce and distribute reprints for governmental purposes notwithstanding any copyright notation therein. The views and conclusions contained herein are those of the authors and should not be interpreted as necessarily representing the official policies or endorsements, either expressed or implied, of the Air Force Research Laboratory or the United States Government.
David W. Johnson is with the Department of Chemistry at the University of Dayton in Dayton, Ohio. Milissa Flake is with the Wright Patterson Air Force Base, AFRL/RQTF, in Dayton, Ohio. Ryan Adams is with the University of Dayton Research Institute. Direct correspondence to: djohnson1@udayton.edu
References
(1) R. van der Westhuizen, M. Ajam, P. De Coning, J. Beens, A. de Villiers, and P. Sandra, J. Chromatogr. A 1218, 4478–4486 (2011).
(2) C.G. Fraga, B.J. Prazen, and R.E. Synovec, Anal. Chem. 72, 4154–4162 (2000).
(3) R.C. Striebich, J. Conteras, L.M. Balster, Z. West, L.M. Shafer, and S. Zabarnick, Energy Fuels 23, 5474–5482 (2009).
(4) M. LePera, JETAl vs JP-8 Differenced and Effects on Long Term Use. 7 June 1999. www.guartermaster.army.millpwd/papers/jet-alvsjpS.pdf, Accessed April 30, 2014.
(5) B.H. Black, M.A. Wechter, and D.R. Hardy, J. Chromatogr. A 437, 203–210 (1988).
(6) R.F. Paschke, J.E. Jackson, and D.H. Wheeler, Ind. Eng. Chem. 44, 1113–1118 (1952).
(7) D.H. Wheeler, A. Milun, and F. Linn, J. Am. Oil Chem. Soc. 47, 242–244, (1970).
(8) R.F. Paschke, L.E. Peterson, and D.H. Wheeler, J. Am. Oil Chem. Soc. 41, 723–727 (1964)
(9) B.H. Black and D.R. Hardy, Preprints of Papers - American Chemical Society, Division of Fuel Chemistry 34(2), 581–583 (1989)
(10) P.W. Fischer, U.S. Patent 2805201, Sept. 3, 1957.
(11) R. Caprotti, B.W. Davies, and B. Dilworth, U.S. Patent 5833722, 1998.
(12) L. Balster, S. Zabarnick, R.C. Striebich, L.M. Shafer, and Z.J. West, Energy Fuels 20, 2564–2571 (2006).
(13) R.K. Adams, S. Zabarnick, Z.J. West, R.C. Streibich, and D.W. Johnson, Energy Fuels 27, 2390–2398 (2013).
(14) J.B. Fenn, J. Biomol. Tech. 13, 101–118, (2002).
(15) K. Qian, W.K. Robbins, C.A. Hughey, H.J. Cooper, R.P. Rodgers, and A.G. Marshall, Energy Fuels 15, 1505–1511 (2001).
Mass Spectrometry for Forensic Analysis: An Interview with Glen Jackson
November 27th 2024As part of “The Future of Forensic Analysis” content series, Spectroscopy sat down with Glen P. Jackson of West Virginia University to talk about the historical development of mass spectrometry in forensic analysis.
Detecting Cancer Biomarkers in Canines: An Interview with Landulfo Silveira Jr.
November 5th 2024Spectroscopy sat down with Landulfo Silveira Jr. of Universidade Anhembi Morumbi-UAM and Center for Innovation, Technology and Education-CITÉ (São Paulo, Brazil) to talk about his team’s latest research using Raman spectroscopy to detect biomarkers of cancer in canine sera.