Integrating FT-IR and FT-Raman for the Pharmaceutical Industry
Application Notebook
Infrared and Raman spectroscopy are critical analytical techniques in the pharmaceutical industry, used for the structural elucidation and characterization of organic materials such as new drug candidates, impurities, metabolites, and excipients.
Infrared and Raman spectroscopy are critical analytical techniques in the pharmaceutical industry, used for the structural elucidation and characterization of organic materials such as new drug candidates, impurities, metabolites, and excipients. We show here examples where both tools, brought to bear from a single instrument, are employed in numerous pharmaceutical processes. The instrument pictured in Figure 1, the Thermo Scientific™ Nicolet™ iS™50 FT-IR spectrometer, combines multiple techniques into a single, compact instrument, well suited for these applications.
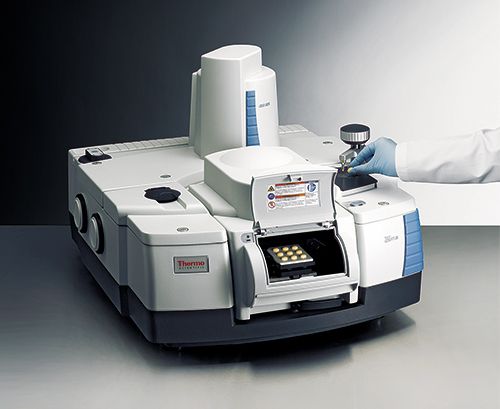
Figure 1: The Thermo Scientific™ Nicolet™ iS™50 FT-IR spectrometer, with built-in ATR, automatic beamsplitter changer, and sample compartment FT-Raman module.
Isomers and Polymorphs
Molecular spectroscopy has proven particularly useful in differentiating between isomers-chemical compounds with the same formula but different structures. Molecular vibrations are sensitive to differences in local environments-structure, solvents, etc. This manifests through peak shifts, peak shape changes, and intensity differences. An excellent example is shown in Figure 2, which shows spectra from three Acetamidophenol isomers. As expected, the spectra are similar, but the differences are also clear, showing FT-IR distinguishes between these three materials. The other key here is simplicity, as the spectra were acquired in seconds using the diamond attenuated total reflection (ATR) sampling port with only a tiny amount of sample. New software tools have enabled this simplicity to be extended to mixtures as well.
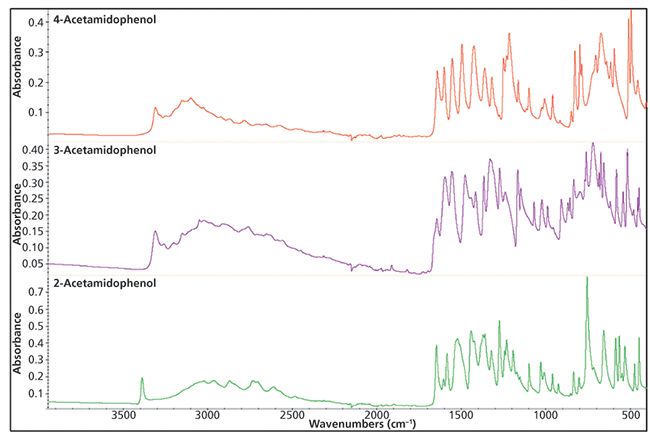
Figure 2: Spectra of three isomers of Acetamidophenol. Differences in the spectra are clearly visible between 500 and 1500 cm-1.
A similar affect is polymorphism, where a single compound can crystallize into a variety of morphologies. The efficacy of the drug can depend strongly on the morphology, making this a crucial aspect of the NDA and patent application processes. As a simple example, a drop of acetaminophen dissolved in ethanol was placed onto the same ATR sampling device. Time-based data collection (using the Thermo Scientific OMNIC™ Series™ software) monitored the spectra as the ethanol evaporated. The spectra were initially dominated by the ethanol features, then a spectrum of dry acetaminophen appears, stably for about 10 min. The spectrum changes over a few minutes into a second form which then remains stable, as seen in Figure 3. This is due to a change in the morphology caused by the drying process.
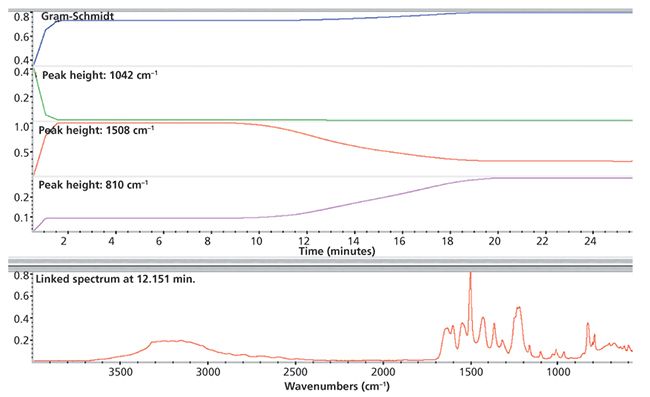
Figure 3: Time evolution of various peaks in the acetaminophen spectrum upon drying.
Next, we deposited the same acetaminophen solution onto an infrared transparent polyethylene membrane and monitored the drying using transmission spectroscopy. After several minutes, the spectrum stabilized-with a different profile than either of the ones seen in the ATR measurement. Figure 4 shows the results of all three (short time ATR, long time ATR, and transmission).
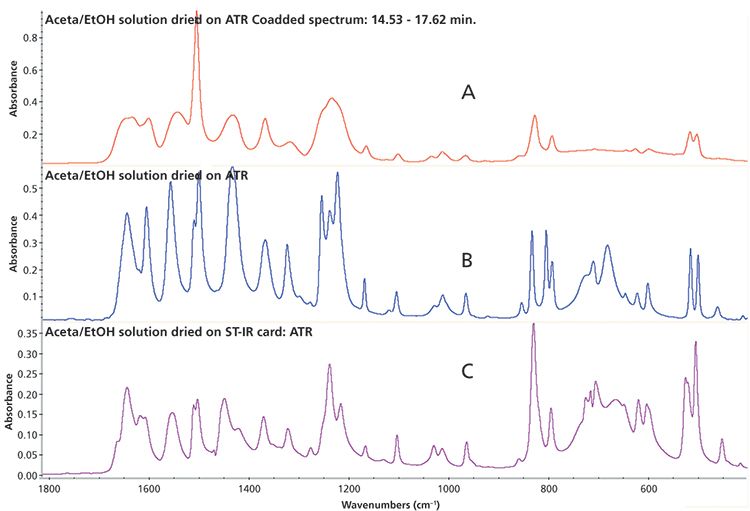
Figure 4: Spectra of the three "terminal" polymorphs from acetaminophen, dependent upon the conditions.
A literature search suggests that spectrum A corresponds to the amorphous form of acetominophen, spectrum B is the monoclinic polymorph (Form 1) and spectrum C is the orthorhombic polymorph (Form 2). We have no explanation for the development of a different polymorph on the hydrophobic micro-porous membrane, however, the sensitivity of infrared to this morphology is quite dramatic.
Homogeneity and Composition
FT-Raman has the same sensitivity to structure that dispersive Raman has, but tends to have less issue with fluorescence. As many pharmaceutical compounds contain potential fluorophores, this is a significant advantage. Using a mapping stage, FT-Raman can provide spatial information as well, delivering either multipoint or full two-dimensional maps combined with visual information.
To show this, a coated ibuprofen tablet was cut open and then mounted on the stage of the iS50 Raman module shown in Figure 1. A map of the sample was acquired, resulting in a file containing the spectra and x-y positions of each point and a video image as shown in Figure 5. The red rectangle on the visual image (upper right) shows where the analysis was done, and the colorized image in the upper left highlights one species (the active ingredient). The yellow band shows a thin transitional region and the green is the coating. The drug is homogeneously distributed at this scale (about 50 µm resolution) and the coating is clearly identified.
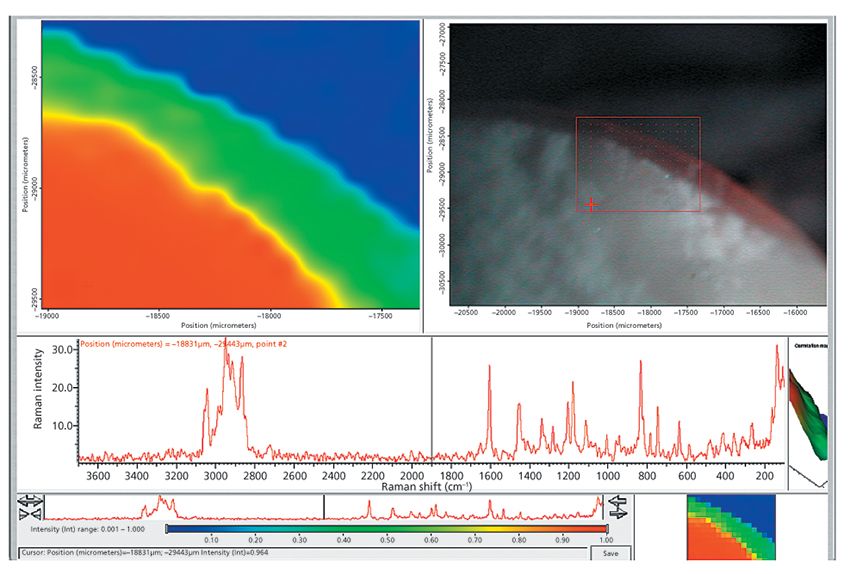
Figure 5: FT-Raman map from the edge of a ibuprofen tablet. The transition from the drug to the coating is seen as a thin yellow line. The map is from the region in the red box of the right image, and a spectrum from the location marked with a + is shown.
Conclusion
The key requirement of the pharmaceutical analytical laboratory is having a flexible set of tools that answer the core questions. Vibrational spectroscopy-FT-IR and FT-Raman-answer questions of polymorphism, homogeneity, and general identification quickly and accurately. Stability of compounds can be easily tested using time-based software. Even subtle effects involving isomers are distinguishable. With the tools compressed into a single, compact workstation, vibrational spectroscopy becomes usable and practical even in busy, crowded laboratories.
Thermo Fisher Scientific
5225 Verona Road, Madison, WI 53711
tel. (800) 532-4752, (608) 276-6100, fax: (608)273-5046
Website: www.thermoscientific.com/ftir
