Metabolomics in Food and Nutrition Laboratories
Spectroscopy
A look at the various strategies and tools related to metabolomics applied to food and nutrition.
The potential to accurately and rapidly measure hundreds of individual molecular species provides novel opportunities for food and nutrition sciences. By enabling the molecular fingerprinting of food components and their metabolites, metabolomics is helping scientists to investigate the intricate relationship between food and human health. Here, we look at the various applications, strategies, and tools related to metabolomics.
Food not only provides us with energy, but also modulates our health and well-being. Yet it remains largely unclear which components in food-and through which mechanism of action-can reduce the risk of disease or improve health. As we enter a new era of technology, the potential to accurately and rapidly measure hundreds of individual molecular species provides novel opportunities for food science and nutrition (1–4). For food and nutrition researchers, metabolomics, the screening of small-molecule metabolites, enables the molecular fingerprinting of food components. Of no less consequence, metabolomics also confers the ability to evaluate the effect of ingested food, by providing an analytic “snapshot” of metabolism.
Food Metabolome
Because of metabolomics, considerably more chemical detail emerges from the analysis of foods and beverages. In certain foods, thousands of chemical entities are now detected, identified, or both. Knowledge of food metabolomes (collections of natural and nonnatural components in a particular food or food group) could provide critical information for studying complex interactions between nutrition and health. The characterization of food metabolomes also affects food producers, who optimize organoleptic properties (aromas and flavors) and increase the abundance of healthy compounds in their products.
Natural Food Components
Until recently, food analyses were limited to estimating nutritional values within the content of six broad categories: carbohydrates, fats, proteins, water, vitamins, and minerals. Metabolomics is transforming modern nutrition research by revealing the thousands of nonnutrient food components that, although not life-sustaining, could affect human well-being and health. For example, we know that phytochemicals such as lycopene (in tomatoes), isoflavones (in soy), and flavanoids (in fruits) are responsible not only for the organoleptic properties of the plants in which they are found but also for their salutary effect on human health.
Nonnatural Food Components
Besides natural products, metabolomics is used to screen foods and beverages for a plethora of environmental chemicals like pesticides, contaminants derived from drugs and consumer products, or even pathogens and toxins (5–10). Thus, metabolomics is helping to solve some of the new challenges that the modern food industry faces such as the discovery of biomarkers that detect the safety, quality, and traceability of food products. Furthermore, metabolomics is providing novel insights into the effects of food additives, preservatives, and transgenic modifications on human health and the environment.
Food Processing and Storage
Metabolomics is leading scientists to discover and characterize the chemical modifications in food caused by its storage and processing, which could dramatically alter molecular content and health properties. Indeed, food preparation methods (frying versus baking and steaming versus boiling) could significantly affect the molecular composition of food products, as could preservation processes like freezing, drying, smoking, and refrigerating.

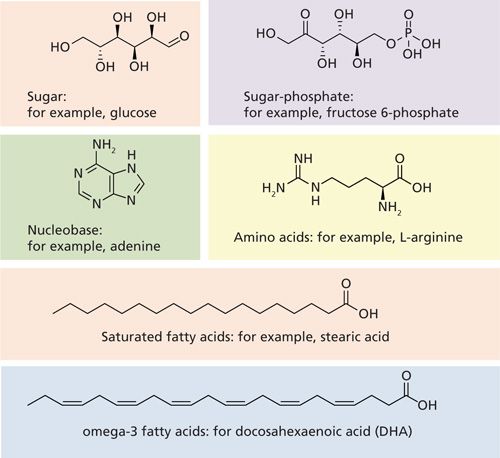
Figure 1: Representative metabolites of interest in food and nutrition laboratories.
Dietary Biomarkers
The characterization of food metabolomes is leading to the discovery of food-specific biomarkers, which are indicators of diet exposure and food consumption. Already, metabolomic screenings have revealed urinary markers associated with an individual’s dietary intake. These markers include 1-methylhistidine, for meat-rich diets; trimethylamine, for fish-rich diets; and phenylacetylglutamine, for vegetable-rich diets. Similar quantitative screening of metabolites could facilitate the monitoring of food consumption in epidemiological or dietary intervention studies.
Food and Human Health
Epidemiologic studies suggest dietary patterns could significantly lower the risk of certain diseases including cardiovascular disease, Alzheimer’s disease, and cancer. Currently, diets enriched in natural antioxidant, vitamins, and phytochemicals are perceived as healthy in western countries, where diets generally include those compounds in the form of nutritional supplements. Yet knowledge of the mechanism by which dietary compounds and diet regimens actually affect human health is limited. Investigating the effects of dietary compounds on human health could help in formulating optimal nutritional recommendations.
Dietary Fats and Lipidomics
Lipids represent the bulk of fats found in food. Along with proteins and carbohydrates, they constitute the three major classes of nutrients. Typical examples of dietary lipids are cholesterol, triglycerides, saturated fatty acids, and trans-fat. Ingestion of lipids has been linked to various pathological conditions including obesity, metabolic syndrome, and cardiovascular diseases. However, not all lipids are associated with increased disease risk. Indeed, some other well-known dietary lipids, such as omega-3 fatty acids and vitamins A and D have been linked to improving human health, which might explain their exponential growth as nutraceuticals.
Lipidomics, the metabolomic analysis of lipids, falls under the umbrella of metabolomics. Nevertheless, the distinct solubility properties of lipids often dictate their separate analysis in metabolomic experiments. Indeed, unlike polar metabolites (for example, amino acids and nucleotides), lipids are mostly insoluble in water. Thus, lipids require organic solvents or distinct solid-phase extraction (SPE) procedures for their extraction from biological samples.
Metabolomics Strategies
Innovative technologies are rapidly facilitating our ability to analyze the complex mixture of metabolites in food and biological samples. Metabolomics faces three major challenges: the wide dynamic range of metabolite concentrations (from attomolar to millimolar); chemical diversity (thousands of components with various degrees of chemical polarity); and the diverse spatial localization of metabolites in food and biological samples. To maximize the sensitivity and specificity of analysis, mass spectrometry (MS) is often the preferred technology for food and nutritional analysis. A typical metabolomics experiment begins with the extraction of the metabolites from the samples. Liquid–liquid extraction (LLE) and SPE procedures are used to purify the metabolites of interest to the biggest extent possible, separating them from the proteins and other constituents of the sample matrix. The metabolites are then further separated by means of on-line separation techniques or by direct infusion into a mass spectrometer (11,12).
Two main strategies are used in food and nutrition laboratories to characterize metabolic phenotypes and perform comparative analyses of metabolomes: untargeted metabolomics and targeted metabolomics.
Untargeted Metabolomics
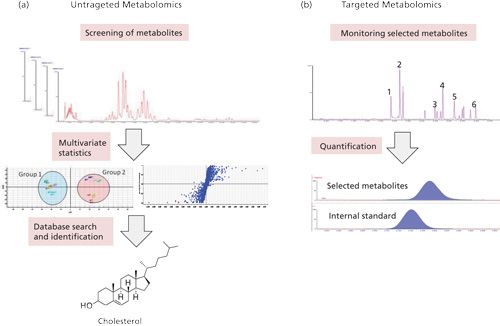
Untargeted metabolomics consists of the unbiased screening of metabolites from food or biological samples (Figure 2a). This approach can characterize the molecular phenotype of individual samples or compare profiles of metabolites among different sample groups. Some applications in food and nutrition research include fingerprinting the molecular composition of food or studying the effect of food on human metabolism.

Figure 2: Metabolomics approaches: (a) Untargeted metabolomics allows for the unbiased screening and characterization of metabolic profiles. Metabolites can be separated using ultrahigh-pressure liquid chromatography (UHPLC) and the exact masses can be measured using a hybrid QTOF system mass spectrometer (11,12). Metabolite differences between groups can be determined using multivariate statistics and database searches for the metabolite identification. (b) Targeted approaches can quantify selected dietary metabolites. In this example, six metabolites of interest were separated using UHPLC and MRM transitions were detected using a tandem quadrupole system (13,14). Exact quantification is usually performed using appropriate internal standards.
Mass spectrometers that offer high resolution and high accuracy are generally used in targeted metabolomics, including the time of flight (TOF), Fourier transform ion cyclotron resonance (FTICR), and orbitral trap systems. Such instruments usually detect thousands of molecular species in food or biological samples. To discover significant changes in metabolites across samples, untargeted metabolomics rely heavily on statistical tools such as multivariate and pattern-recognition analyses. Next, metabolites of interest are annotated using accurate-mass measurement searches against publicly available metabolite databases including the human metabolome database (HMDB), PhenolExplorer, Metlin, and Mass Bank databases. Isotopic distribution is also applied, as a filter, to the database search results. Confident molecular identification often requires orthogonal, analytical parameters including retention times, MS-MS fragmentation, and collision cross sections relative to an authentic compound.
Targeted Metabolomics
The targeted metabolomics approach focuses on analyzing selected metabolites often related to a specific metabolic pathway such as fatty acids, amino acids, or particular classes of phytochemicals (Figure 2b) (13–19). It often requires developing specific analytical methods for the absolute quantification of a selected set of metabolites of interest. Some applications of targeted metabolomics in nutrition science involve determining the concentration and bioavailability of dietary compounds or developing quantitative diagnostic tests to monitor nutritional imbalances or deficiency in dietary metabolites. Today, using LC coupled with selected multiple-reaction monitoring (MRM) transitions of triple-quadrupole instruments, hundreds of metabolites can be monitored simultaneously (19). Quantification usually occurs by adding an internal standard (an unnatural chemical analog or deuterated compound) during the sample preparation procedure. Concentration values are usually reported after normalization against the volume, the weight, the protein, or DNA concentration of the sample.
Metabolomics Tools
On-Line Separation-MS
Monodimensional or bidimensional chromatographic solutions are used to separate the complex mixture of metabolites before MS detection. Ultrahigh-pressure liquid chromatography (UHPLC) is one of the most common choices for resolving complex mixtures of metabolites. Because of the variety of chemical structures present in food and biological matrices, however, complementary chromatographic techniques such as gas chromatography (GC) and supercritical fluid chromatography coupled to MS have been used to fully characterize the metabolome. Recently, an orthogonal means of separation, such as ion mobility, has been used to separate ions in the gas phase according to their charge, shape, and size. The ion mobility separation occurs within milliseconds, making it suitable for placement between chromatographic separations (seconds) and MS detection (microseconds). The additional dimension of separation of ion mobility increases the peak capacity compared to traditional MS experiments, improving the specificity of metabolite identification in complex matrices (20–25).
Direct Analysis-MS
For a high-throughput fingerprinting of food and biological samples, metabolite extracts can be directly infused into a mass spectrometer using electrospray ionization (ESI) or nanoESI without prior chromatographic separation. Ambient ionization tools including direct analysis in real time (DART, JEOL USA) (26–28), desorption electrospray ionization (DESI), and the atmospheric-solids analysis probe (ASAP) (29) have also been applied. These tools allow for real-time, rapid, in situ fingerprinting of solid or liquid samples.
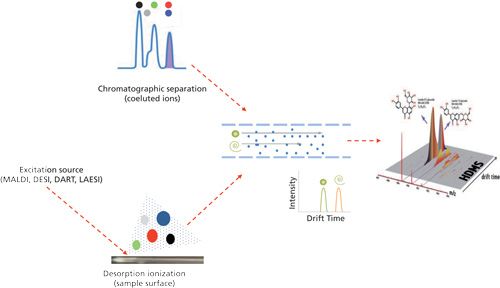
However, the approach is not without limitations, two of which include a low signal-to-noise ratio and the incapacity to distinguish isobaric or isomeric species, whose masses are identical. Recently, ion mobility has been used as a post-ionization separation tool, separating molecules in two dimensions according to their mobility times and mass (22–24) (Figure 3). Ion mobility can separate small molecule-metabolites from various classes of biomolecules such as peptides, carbohydrates, and oligosaccharides, thereby improving peak capacity as much as sixfold compared to a more traditional MS experiment (22,30,31).

Figure 3: Metabolomics tools: Traditional metabolomic approaches, including online separation using chromatography (top) and direct analysis using ESI or desorption ionization (bottom), can be coupled with ion mobility to increase the peak capacity. Coeluted or directly analyzed metabolite ions can be separated by drift time according to their charge, size, and shape in the ion mobility separation cell, which is filled with a buffer gas, before MS detection. The final data will contain the measure of the drift time, an additional coordinate to mass, which may facilitate metabolite identification.
MS Imaging
Metabolites are localized in different compositions and concentrations across the surface of a sample. Using modern tools, researchers can determine the spatial distribution of metabolite species on the surface of a sample without prior metabolite extraction or even sample preparation. This approach, called MS imaging, uses a focused excitatory beam (such as a laser, ions, or charged droplets of solvent) to scan, with a spatial resolution of 1–200 μm (32–34), through tissues along the axes. The impact of the excitatory beam desorbs from the sample surface a vapor of ions, which is then directed into the mass spectrometer. The molecular information can be processed and overlaid on microscopic images, generating topographic maps of metabolite composition. Various desorption ionization techniques are currently used for MS imaging, including matrix-assisted laser desorption-ionization (MALDI), laser ablation electrospray ionization (LAESI), DESI, and DART. Some applications of MS imaging for food and nutrition research include the study of the molecular composition of particular sample regions and the investigation of the absorption, distribution, and metabolism of food-derived components in animal tissue (Figure 4) (27,32–36).

Figure 4: MS imaging using desorption ionization tools such as MALDI allows for the determination of the exact localization of the changes in molecular composition induced by a particular diet in rat brain (32–34,37). After ionization, ion mobility separation allows for the separation of metabolites according to their charge, size, and shape. For example, lipids can be resolved from peptides and matrices, leading to an increase in the signal-to-noise ratio and, consequently, a much cleaner molecular map.
Conclusions and Future Directions
Metabolomics is gaining momentum in modern food and nutrition laboratories. These laboratories are using new metabolomics technologies to characterize and optimize the metabolite composition of food, determine the effects of food on human metabolism, and authenticate food safety, quality, and traceability. Metabolomics is providing a better understanding of the interplay between food components and human physiology. This heightened insight could lead to personalized nutrition regimens for individuals recommended particular diets on the basis of their metabolic phenotypes. Indeed, the implementation of new technologies for metabolomics in food and nutrition laboratories could benefit all of us.
Acknowledgments
The author is grateful to David Sarro and Kate Yu for the editorial support.
This article was originally published in the April 2014 issue of LCGC North America as an installment of “MS-The Practical Art” column and was edited by Kate Yu (38).
References
- S. Primrose, J. Draper, R. Elsom, V. Kirkpatrick, J.C. Mathers, C. Seal, M. Beckmann, S. Haldar, J.H. Beattie, J.K. Lodge, M. Jenab, H. Keun, and A. Scalbert, Br. J. Nutr.105, 1277–1283 (2011).
- M.J. Gibney, M. Walsh, L. Brennan, H.M. Roche, B. German, and B. van Ommen, Am. J. Clin. Nutr.82, 497–503 (2005).
- D.S. Wishart, Trends Food Sci. Technol. 19, 482–493 (2008).
- L. Brennan, Biochem. Soc. Trans.41, 670–673 (2013).
- R.A. Dixon, D.R. Gang, A.J. Charlton, O. Fiehn, H.A. Kuiper, T.L. Reynolds, R.S. Tjeerdema, E.H. Jeffery, J.B. German, W.P. Ridley, and J.N. Seiber, J. Agric. Food Chem.54, 8984–8994 (2006).
- M.J. Simpson and J.R. McKelvie, Anal. Bioanal. Chem. 394, 137–149 (2009).
- S. Trenkamp, P. Eckes, M. Busch, and A.R. Fernie, Metabolomics5, 277–291 (2009).
- L.W. Sumner, P. Mendes, and R.A. Dixon, Phytochemistry62, 817–836 (2003).
- J.G. Bundy, M.P. Davey, and M.R. Viant, Metabolomics5, 3–21 (2009).
- R. Stierum, W. Heijne, A. Kienhuis, B. van Ommen, and J. Groten, Toxicol. Appl. Pharmacol.207, 179–188 (2005).
- P.D. Rainville, C.L. Stumpf, J.P. Shockcor, R.S. Plumb, and J.K. Nicholson, J. Proteome Res.6, 552–558 (2007).
- J.M. Castro-Perez, J. Kamphorst, J. DeGroot, F. Lafeber, J. Goshawk, K. Yu, J.P. Shockcor, R.J. Vreeken, and T. Hankemeier, J. Proteome Res. 9, 2377–2389 (2010).
- A. Nicolaou, M. Masoodi, and A. Mir, Methods Mol. Biol.(N. Y.)579, 271–286 (2009).
- S.L. Lundstrom, R. Saluja, M. Adner, J.Z. Haeggstrom, G. Nilsson, and C.E. Wheelock, J. Lipid Res. 54, 116–126 (2013).
- G. Giordano, I.M. Di Gangi, A. Gucciardi, and M. Naturale, Methods Mol. Biol. (N. Y.)828, 219–242 (2012).
- A. Gucciardi, P. Pirillo, I.M. Di Gangi, M. Naturale, and G. Giordano, Anal. Bioanal. Chem.404, 741–751 (2012).
- C.N. Serhan and B. Samuelsson, Adv. Exp. Med. Biol. 229, 1–14 (1988).
- M.S. Cortina and H.E. Bazan, Curr. Opin. Clin. Nutr. Metab. Care14, 132–137 (2011).
- U. Vrhovsek, D. Masuero, M. Gasperotti, P. Franceschi, L. Caputi, R. Viola, and F. Mattivi, J. Agric. Food Chem. 60, 8831–8840 (2012).
- V. Shah, J.M. Castro-Perez, D.G. McLaren, K.B. Herath, S.F. Previs, and T.P. Roddy, Rapid Commun. Mass Spectrom. 27, 2195–2200 (2013).
- A. Malkar, N.A. Devenport, H.J. Martin, P. Patel, M.A. Turner, P. Watson, R.J. Maughan, H.J. Reid, B.L. Sharp, C.L.P. Thomas, J.C. Reynolds, and C.S. Creaser, Metabolomics9(6), 1192–1201 (2013).
- P. Dwivedi, A.J. Schultz, and H.H. Hill, Int. J. Mass Spectrom. 298, 78–90 (2010).
- P. Dwivedi, G. Puzon, M. Tam, D. Langlais, S. Jackson, K. Kaplan, W.F. Siems, A.J. Schultz, L. Xun, A. Woods, and H.H. Hill, Jr., J. Mass Spectrom. 45, 1383–1393 (2010).
- K. Kaplan, P. Dwivedi, S. Davidson, Q. Yang, P. Tso, W. Siems, and H.H. Hill, Jr., Anal. Chem.81, 7944–7953 (2009).
- E.L. Harry, D.J. Weston, A.W. Bristow, I.D. Wilson, and C.S. Creaser, J. Chromatogr. B: Anal. Technol. Biomed. Life Sci.871, 357–361 (2008).
- G.A. Harris, A.S. Galhena, and F.M. Fernandez, Anal. Chem. 83, 4508–4538 (2011).
- P. Nemes and A. Vertes, J. Visualized Exp.43, 1–4 (2010).
- H. Novotna, O. Kmiecik, M. Galazka, V. Krtkova, A. Hurajova, V. Schulzova, E. Hallmann, E. Rembialkowska, and J. Hajslova, Food Addit. Contam., Part A29, 1335–1346 (2012).
- L.P. Li, B.S. Feng, J.W. Yang, C.L. Chang, Y. Bai, and H.W. Liu, The Analyst138, 3097–3103 (2013).
- M. Kliman, J.C. May, and J.A. McLean, Biochim. Biophys. Acta1811, 935–945 (2011).
- L.S. Fenn, M. Kliman, A. Mahsut, S.R. Zhao, and J.A. McLean, Anal. Bioanal. Chem.394, 235–244 (2009).
- P.J. Trim, C.M. Henson, J.L. Avery, A. McEwen, M.F. Snel, E. Claude, P.S. Marshall, A. West, A.P. Princivalle, and M.R. Clench, Anal. Chem. 80, 8628–8634 (2008).
- P.J. Hart, S. Francese, E. Claude, M.N. Woodroofe, and M.R. Clench, Anal. Bioanal. Chem.401, 115–125 (2011).
- M.C. Djidja, E. Claude, M.F. Snel, S. Francese, P. Scriven, V. Carolan, and M.R. Clench, Anal. Bioanal. Chem. 397, 587–601 (2010).
- J.C. Vickerman, The Analyst136, 2199–2217 (2011).
- P. Franceschi, Y. Dong, K. Strupat, U. Vrhovsek, and F. Mattivi, J. Exp. Bot.63, 1123–1133 (2012).
- H. Shion, Waters Corporation Technology Brief, 2011:720004135en.
- G. Astarita, LCGC North Am.32(4), 262–268 (2014).
Giuseppe Astarita is a principal scientist at Waters Corporation in Milford, Massachusetts and serves as adjunct professor at Georgetown University in Washington, D.C. Giuseppe’s research interests include lipid mass spectrometry and metabolomics, as applied to translational medicine and biomarker discovery. He is applying the latest technologies in the study of health and disease as well as food and nutrition. Direct correspondence to: giuseppe_astarita@waters.com
