Morphologically Directed Raman Spectroscopic Analysis of Forensic Samples
Spectroscopy
Can morphologically directed Raman spectroscopy obtain more discriminatory information from forensic samples than current tools?
Morphologically directed Raman spectroscopy (MDRS) is a novel and reliable tool that would enable criminalists to obtain more discriminatory information from forensic samples than their current capabilities. MDRS combines automated particle imaging and Raman spectroscopy into one instrument. Particle imaging is performed to determine particle size and shape distributions of components in a blended sample. Particle size is an important physical property of particulate samples and can be used in conjunction with Raman spectroscopy in the analysis of a range of samples of forensic interest, including illicit and counterfeit drugs, soils, gunshot residue (GSR), and white powders. Although measurement of particle size distributions is routinely carried out across a wide range of industries and is often a critical parameter in the manufacture and analysis of many products and substances, it is not widely used in the forensic sciences. Raman spectroscopy is used in forensic science to determine the molecular chemistry of materials because it is rapid, reliable, allows for analysis without contacting the sample, is nondestructive, and enables detection at low concentrations. Combining these two analytical techniques into a single platform allows the individual components present within a blend or mixture to be independently characterized and compared.
Morphologically directed Raman spectroscopy (MDRS) combines the power of automated particle imaging with Raman microspectroscopy into a single platform. Particle imaging is performed to determine particle size and shape distribution of components in a blended sample. These are important physical properties of particulate samples and may have a direct influence on a sample's performance. For example, the size and surface area of a particle can be related in a significant way to the physical, chemical, and pharmacologic properties of a drug. Particle size distributions (PSDs) are routinely measured across a wide range of industries because they are important, and sometimes critical, to the manufacture and performance of substances and products. In spite of this importance, they are not widely used as methods for classification, identification, or individualization in the forensic sciences, other than in forensic soil examinations. However, characterization of materials by their microscopic morphology is used to analyze a plethora of forensic science samples, including drugs, geological materials (that is, soil minerals, rocks, and so forth), glass, dust, gunshot residue (GSR), pollen and diatoms, hairs and fibers, cosmetics, other anthropogenic materials (such as various building materials), general unknowns, and white powders used in hoax powder attacks. Raman spectroscopy is useful for determining molecular and physical chemistry because it is fast, reliable, nondestructive, and a noncontact method. Methods based on Raman spectroscopy are also used in the forensic sciences (1) for the analysis of many types of physical evidence including illicit drugs (2–5), explosives (6–8), paint (9–14), fibers (15–17), ink (14,18), and general unknowns (7). There are also several research articles on the use of Raman spectroscopy for the analysis of other types of forensic evidence, with a significant focus on analysis of the organic components of GSR (17,19–25).
Independently, both automated particle imaging and Raman microspectroscopy are valuable methods. Even when combined into a single instrument, analysis based upon each method's independent evaluation may be useful. However, the power of a combined analytical scheme is greater than the sum of the individual approaches. Together, the data from these two methods may provide insight about the sample including its manufacturing method, history, and quality. This type of information may be invaluable during analysis of evidence in forensic casework.
When performing MDRS, the sample's morphological data is collected using a light microscope with an automated stage. This allows for the sorting of particles based on various physical parameters. Once this particle data is collected, these parameters are then used to automatically select particles for chemical analysis using Raman microspectroscopy. The ability to perform particle selection for chemical analysis using physical parameters removes subjectivity in the measurement. In addition, the automation of the stage and of the particle selection removes the need to expose the analyst to the sample for the prolonged periods of time that would be required if manual measurements were performed (26).
The combination of morphological and PSD analysis with Raman spectroscopy has the potential to provide unexploited information about a plethora of samples of forensic interest. This research examined the use of MDRS for the forensic analysis of four evidence types: illicit and counterfeit drugs, soils, GSR, and white powders. It is shown that MDRS can be used for the comparison of questioned and known samples, material, and mixture identification or classification as well as potential provenance determination.
Experimental
The experiments were performed using a Morphologi G3-ID particle imaging and Raman spectroscopy system (Malvern Panalytical). Samples were automatically dispersed onto a quartz plate at a pressure of 4 bar using the integrated Sample Dispersion Unit (SDU) on the Morphologi G3-ID instrument. Automated imaging analysis was performed directly on the quartz sample dispersion plate to obtain particle morphology data. All image acquisition settings were defined in a standard operating procedure (SOP) and included brightfield illumination and the use of a 10-times objective.
Particles with a circle equivalent diameter (CED) greater than 7.0 µm and solidity greater than 0.75 were tagged for chemical targeting by the image analysis software. Morphological data was collected for more than 150,000 individual particles for each sample. Of these, 3000 particles per sample were targeted for Raman spectroscopic analysis over the spectral range of the instrument (150–1850 cm-1). Raman spectra were obtained with the coupled Kaiser optical systems RamanRxn1 Raman spectrometer using a 785-nm semiconductor laser with a power of <500 mW and an exposure time of 2 s. The sampling spot size of the instrument was 3 µm. Both the particle morphology data and the Raman spectra were analyzed using the Morphologi software. All experiments were performed in triplicate.
Spectral analysis required the creation of a spectral reference library, which was made using standards purchased from Sigma-Aldrich. The individual particle spectra from each sample were then compared against the reference spectral library and identifications made based on a correlation search algorithm where a correlation value close to one indicates a close match to that reference, and a value close to zero indicates no match. Using these correlation values, the particles were chemically classified and PSDs of the individual component populations were generated.
Illicit and Counterfeit Drugs
A five-component mixture of illicit drugs was prepared (equal parts by weight) using cocaine, phenobarbital, pentobarbital, D-methamphetamine, and amphetamine.
Two suspected synthetic cathinones, marketed as "bath salts," were purchased over the internet: "Arctic Rush" and "Fast Forward."
Three counterfeit Viagra samples were obtained via the internet, where two were from Singapore and one was from India. Sampling was performed by removing a small amount of white powder from the core of each tablet, and all analyses were performed in triplicate.
Soil
Soil samples were collected from four sites along one road in Connecticut (27). The 60–120 µm mineral fraction was separated by sieving and washing. Then 7 mm3 of minerals was deposited onto the quartz plate using evaporative dispersion. The mineral data were compared to a library made by importing the Raman spectra of minerals from the RRUFF database (28), and mineral identification was made only when there was a correlation score greater than 0.85.
Gunshot Residue
GSR was collected from cotton targets onto a quartz plate from four test fires using the same ammunition. The muzzle-to-target distances varied for each test fire, and included distances of 3, 6, 12, and 24 in.
White Powders
Three commercially available artificial sweetener blends were purchased locally, all with dextrose as the bulking agent but containing different sweetening agents. Sweet'N Low (designated as sample A) has saccharin as its sweetening agent, Splenda (Sample B) contains sucralose, and Equal (sample C) contains aspartame. An additional generic sucralose-based sweetener (NutraTaste Gold) was also purchased locally for comparison with the Splenda. Samples of the pure sweetener components were purchased from Sigma-Aldrich for addition to the spectral reference library.
Results and Discussion
Illicit and Counterfeit Drugs
All five of the drugs were identified using MDRS. Further, the different components had different particle morphologies (Figure 1) and PSDs, which could be used in the comparison of samples from different seizures to evaluate whether they come from a common source. The particle size and shape of a substance can be useful for determination of the manufacturing process and, therefore, for comparative source attribution. Different methods of preparation can result in particles with different crystal structures and habits. Usually, slow crystallization methods form larger crystals, and rapid crystallization methods form smaller crystals.
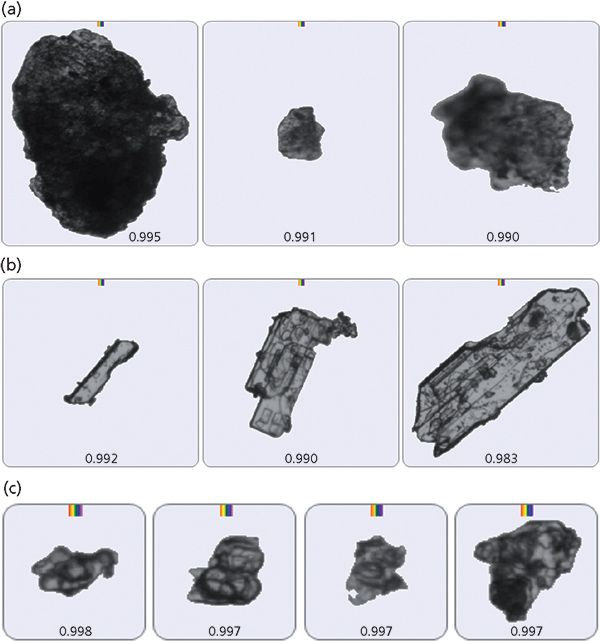
Figure 1: Particle images showing the different morphologies of (a) amphetamine, (b) D-methamphetamine, and (c) cocaine.
The two suspected synthetic cathinones were analyzed by MDRS. The first, "Arctic Rush," did not contain any synthetic cathinones, and instead was composed of L-DOPA, caffeine, and an unidentified chemical. The presence of caffeine is a common cutting agent because it is a stimulant. L-DOPA is commonly used for the treatment of patients with Parkinson's disease, but there have been cases of people abusing L-DOPA as a means of enhancing the dopamine rush, which explains why it would be found in a mixture that people take to induce euphoria. It has been shown to increase aggressive behavior when taken in conjunction with methamphetamine (29). Inositol and phenethylamine were detected in the second, "Fast Forward." Inositol is a sugar alcohol that is commonly used as a cutting agent for narcotics (30). Phenethylamine has a similar chemical structure to synthetic cathinones, but there is a difference in one of the functional groups (31). Phenethylamine has a similar effect to that of synthetic cathinone, often ending in a state of excited psychosis or death (32).
MDRS was able to identify four components in the counterfeit Viagra pills, including the active pharmaceutical ingredient (API) sildenafil citrate, and three excipients: lactose, starch, and talc. In an authentic Viagra sample, one would expect to see microcrystalline cellulose, calcium phosphate dibasic, croscarmellose sodium, and magnesium stearate. These were not detected in the counterfeit samples. Of particular interest is that the sample from India only contained the API and starch, while the two from Singapore also contained the lactose and talc (Figure 2). This has the potential to serve as a useful feature for comparison that could be used for counterfeit source attribution.
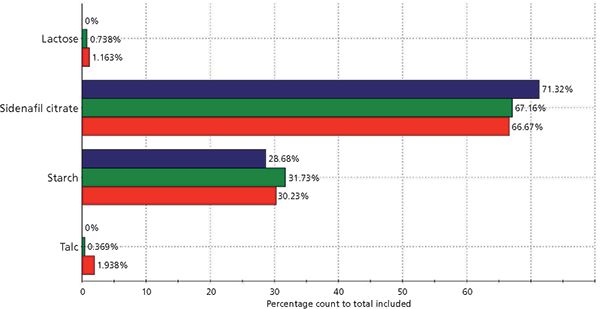
Figure 2: A graph showing the relative percentage count of each of the components (lactose, sildenafil citrate, starch, and talc) in the three counterfeit Viagra samples, with the one from India in blue and the two from Singapore in green and red.
Soil
The mineral morphologies of for each of the four samples were compared, and it was seen that they were all very similar. This is expected since they were collected along the same road in Connecticut. Other research has shown that the morphology of quartz can be used to differentiate different mineral environments (33–38), which could be exploited with MDRS. The PSDs for each location also proved to be indistinguishable.

Table I: The average percent particle counts for each mineral for the four soil sample locations. The four locations can be differentiated because of the presence of some minerals in some sites that are not seen in the others, such as diopside in location C and epidote in location A, or because of differences in mineral counts, such as the higher percentage of muscovite in location B than the other sites.
However, the samples for each location were differentiated when comparing the percent particle counts for each mineral (Table I). Multivariate statistical analysis was performed using R software (The R Foundation), using code written by N.D.K. Petraco, PhD, and adapted for this research by B.W. Kammrath, PhD. Principal component analysis (PCA) was performed on the particle count data, and in three principal components, 87.7% of the variance of the data was captured (Figure 3). Further analysis of the three-dimensional (3D) scores plot shows that there is good separation between the four data sets, with good clustering among replicates, which indicates the mineral counts achieved by MDRS can be used for sample discrimination.
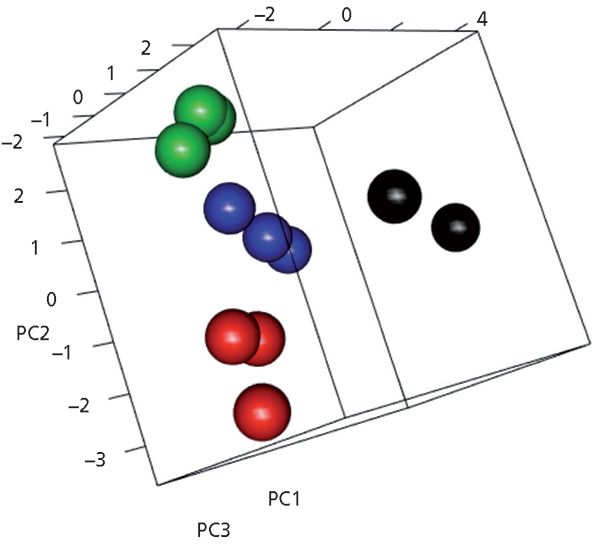
Figure 3: Three-dimensional scores plot of the autoscaled PCA results from the particle counts of the four soil locations. The three replicates cluster well for each of the four locations.
Gunshot Residue
The collected residue from each of the four targets contained particles consistent with GSR as identified by the presence of nitrocellulose. The morphologies and PSDs of the particles were also analyzed (Figure 4). The PSDs have distributions centering on approximately the same circular-equivalent (CE) diameters, although there does appear to be a relationship between the volume distribution and the muzzle-to-target distance. This visual relationship, where the greater muzzle-to-target distance had larger volume distributions, needs to be explored in more detail with additional test fires using various ammunitions before this conclusion can be validated.
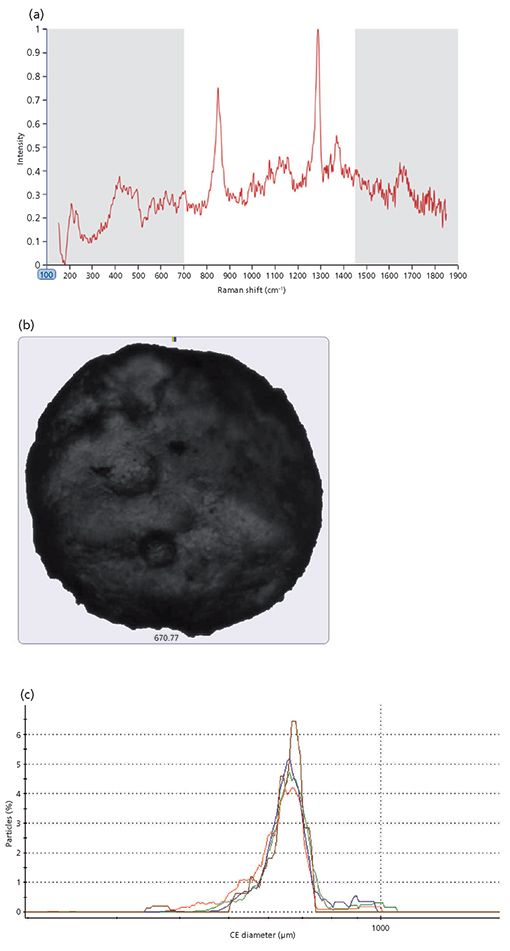
Figure 4: Raman spectra (a) and particle image (b) of one GSR particle showing a spherical morphology and the presence of nitrocellulose. (c) The PSD of nitrocellulose-identified particles for all four muzzle-to-target distances (3, 6, 12, and 24 in. shown in red, blue, green, and brown, respectively).
White Powders
The automated imaging data alone were not enough to definitively identify the components within each of the artificial sweetener samples by particle size or shape. However, with the assistance of Raman chemical identification, individual components can be classified. Furthermore, PSDs were generated and compared for each of the chemical classes identified within a sample. Figure 5 shows the overall PSDs, the PSD of the dextrose, and PSD of the sweetening agent for each of the analyzed blends. The PSD of the entire sample and their distribution of dextrose bulking agents are the same, which shows that the PSD of the entire sample is primarily caused by the bulking agent. In addition, the PSD of the active sweetener component is markedly different from the dextrose, but does not have a detectable effect on the PSD of the entire sample. In a traditional bulk Raman analysis, smaller particles present in a lower volume are masked by the larger volume of dextrose, and thus cannot be identified. However, the particle specific targeting of MDRS enables the individual sweetening agent to be identified, which would allow for classification based on sweetener presence, and its component PSD to be analyzed.
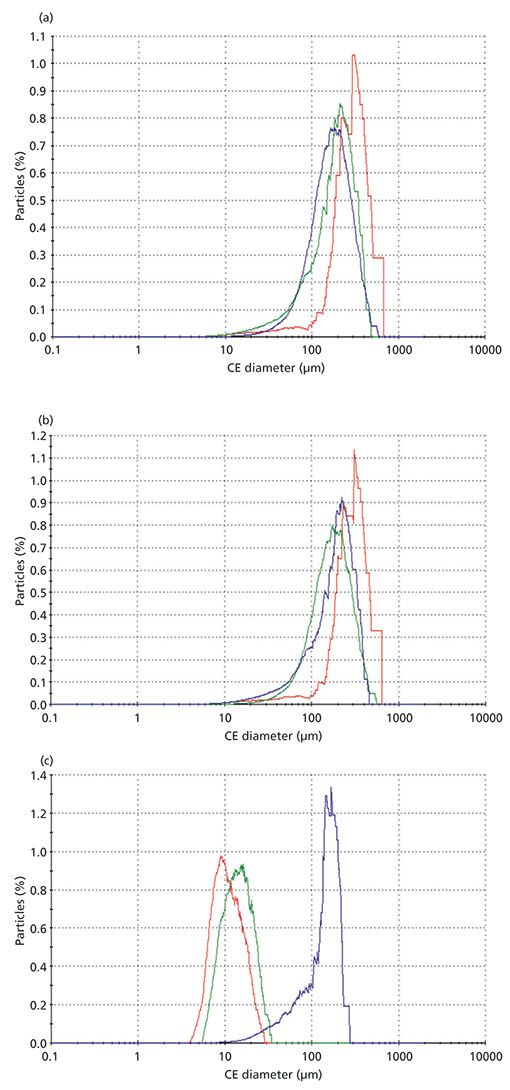
Figure 5: The PSD of Sweet'N Low (blue), Splenda (green), and Equal (red) for (a) all particles in a sample of each of the sweetener blends, (b) the particles identified as dextrose in a sample of each of the sweetener blends, and (c) the sweetener component in a sample of each of the sweetener blends.
When comparing the results of the Splenda with the generic sucralose-based sweetener, the PSDs of the dextrose were the same for both samples. However, the PSDs of the sweetening agent were different (Figure 6). Thus, it was shown that even though these two samples are made with the same chemicals, the individual components have different PSDs that enable their differentiation. Consequently, the PSDs of the sweetening agent could prove to be a class characteristic of the specific manufacturer, thus its analysis could be used in determining and differentiating the particular brand of artificial sweetener.
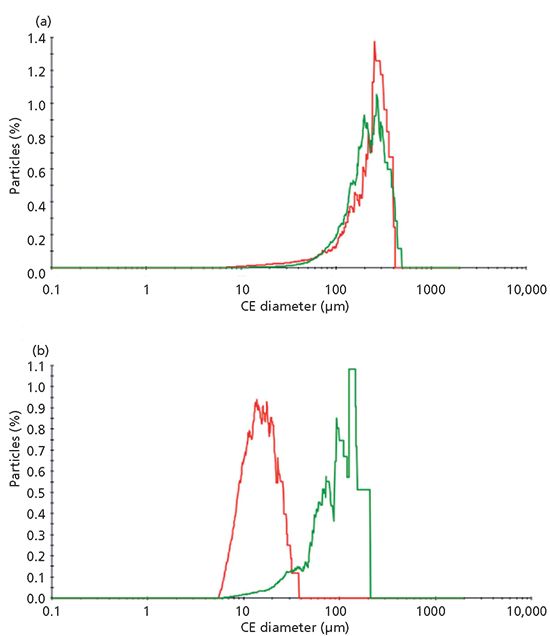
Figure 6: The PSD of Splenda (red) and the generic sucralose-based sweetener (green) for (a) the particles identified as dextrose in a sample of each of the sweetener blends and (b) the sucralose in a sample of each of the sweetener blends.
Conclusion
MDRS is a nondestructive, relatively fast, and automated way to collect chemical and particle size information about samples of forensic interest. MDRS can be used in the forensic analysis of illicit and counterfeit drug mixtures, soil minerals, and hoax white powders by comparing two or more samples, not only based on their concentrations and identities of components, but also on the morphologies and size distributions of the particles. For illicit and counterfeit drugs, this determination of an individual components' particle size or shape distributions can provide additional information for connecting individual drug seizures and suppliers, tracing drug distribution routes and networks, and potentially identifying their geographical origin. For forensic soil analysis, MDRS enables PSDs and morphological examinations of each mineral component, which provides valuable information that can be used for comparison and source determination. In the analysis of hoax powders, MDRS can identify and characterize particles of trace components within mixtures that may be "hidden" in bulk Raman analysis. In addition, two components in a mixture with similar PSDs can be differentiated with MDRS because of the ability to chemically target specific particles, and two mixtures with the same components can be differentiated with MDRS because of their different PSDs.
MDRS is a new approach to GSR analysis that combines Raman identification with particle size and shape information, thus making it comparable to current methods, specifically analysis by scanning electron microscopy with energy dispersive X-ray spectroscopy.
The use of MDRS for the analysis of illicit and counterfeit drugs, soil minerals, GSR, and white powders is a novel and reliable tool that would enable criminalists to obtain more information from forensic evidence than is currently used for investigations and adjudications.
References
(1) J.M. Chalmers, H.G. Edwards, and M.D. Hargreaves, Infrared and Raman Spectroscopy in Forensic Science (Wiley, Chichester, UK, 2012).
(2) C. Eliasson, N.A. Macleod, and P. Matousek, Anal. Chim. Acta. 607, 50–53 (2008).
(3) C.A. Penido, M.T.T. Pacheco, and L. Silveira, Instrum. Sci. Technol. 40, 441–456 (2012).
(4) C.A.F.O. Penido, M.T.T. Pacheco, R.A.. Zangaro, and L Silveira, J. Forensic Sci. 60(1), 171–178 (2015).
(5) M.J. West and M.J. Went, Drug Test. Analysis 3(9), 532–538 (2011).
(6) E.M.A. Ali, H.G.M. Edwards, M.D. Hargreaves, and I.J. Scowen, J. Raman Spectrosc. 40(2), 144–149 (2009).
(7) B. Cletus, W. Olds, P.M. Fredericks, E. Jaatinen, and E.L. Izake, J. Forensic Sci. 58(4), 1008–1014 (2013).
(8) E.M.A. Ali, H.G.M. Edwards, and R. Cox, J. Raman Spectrosc . 46(3), 322–326 (2015).
(9) J.D. Gelder, P. Vandenabeele, F. Govaert, and L Moens, J. Raman Spectrosc. 36(11), 1059–1067 (2005).
(10) P. Buzzini, G. Massonnet, and F.M. Sermier, J. Raman Spectrosc. 37(9), 922–931 (2006).
(11) S.G. Ryland and E.M. Suzuki, in Forensic Chemistry Handbook , L. Kobilinsky, Ed. (John Wiley & Sons, Inc., Hoboken, New Jersey, 2011), pp. 131–224.
(12) S.P. Stewart, S.E.J. Bell, W.J. Armstrong, G. Kee, and S.J. Speers, J. Raman Spectrosc. 43(1), 131–137 (2012).
(13) A. Michalska, A. Martyna, J. Zieba-Palus, and G. Zadora, J. Raman Spectrosc. 46(9), 772–783 (2015).
(14) P. Buzzini and E. Suzuki, J. Raman Spectrosc. 47(1), 16–27 (2016).
(15) P. Buzzini and G. Massonnet, J. Forensic Sci. 58(6), 1593–1600 (2013).
(16) P. Buzzini and G. Massonnet, J. Forensic Sci. 60(3), 712–720 (2015).
(17) K.C. Doty, C.K. Muro, J. Bueno, L. Halámková, and I.K. Lednev, J. Raman Spectrosc. 47(1), 39–50 (2016).
(18) S.E.J. Bell, S.P. Stewart, Y.C. Ho, B.W. Craythorne, and S.J Speers, J. Raman Spectrosc. 44(4), 509–517 (2013).
(19) V. Otieno-Alego, J. Raman Spectrosc. 40(8), 948–953 (2009).
(20) J.Bueno, V. Sikirzhytski, and I.K. Lednev, Anal. Chem. 84, 4334–4339 (2012).
(21) M. López-López, J.J. Delgado, and C. García-Ruiz, Anal. Chem . 84, 3581–3585 (2012).
(22) M.López-López, J.L. Ferrando, and C. García-Ruiz, Anal. Chim. Acta 717, 92–99 (2012).
(23) J.Bueno and I.K. Lednev, Anal.Methods 5, 6292–6296 (2013).
(24) J. Bueno and I.K. Lednev, Anal. Bioanal. Chem. 406(19), 4595–4599 (2014).
(25) J. Zeng, J. Qi, F. Bai, J.C.C. Yu, W.-C. Shih, Analyst 139, 4270–4278 (2014).
(26) C. Zona, Microsc. Microanal. 12, 16–17 (2006).
(27) B. Kammrath, A. Koutrakos, J. Castillo, C. Langley, and D. Huck-Jones, Forensic Sci. Int. (2018) https://doi.org/10.1016/j.forsciint.2017.12.034.
(28) B. Lafuente, R.T. Downs, H. Yang, and N. Stone, in Highlights in Mineralogical Crystallography , T. Armbruster and R.M. Danisi, Eds. (W. De Gruyter, Berlin, Germany, 2015), pp. 1–30.
(29) B. Angrist and S. Gershon, Compr. Psychiatry 17, 715–722 (1976).
(30) P. Lociciro, P. Hayoz, P. Esseiva, L. Dujourdy, F. Besacier, and P. Margot, Forensic Sci. Int. 167, 220–228 (2007).
(31) M. Coppola and R. Mondola, Toxicol. Lett. 211, 144–149 (2012).
(32) B. Dean, S. Stellpflug, A. Burnett, and E. Engebretsen, J. Med. Toxicol. 9, 172–178 (2013).
(33) J.E. Brown, Nature 242, 396–398 (1973).
(34) D.H. Krinsley and J.C. Doornkamp, Atlas of Quartz Sand Surface Textures (Cambridge University Press, Cambridge, UK, 1973).
(35) W.B. Whalley and D.H. Krinsley, Sedimentology 21(1), 87–105 (1974).
(36) D.H. Krinsley and F.W. McCoy, Sedimentology 24(6), 857–862 (1977).
(37) S.J. Culver, P.A. Bull, S. Campbell, R.A. Shakesby, and W.B. Whalley, Sedimentology 30(1), 129–136 (1983).
(38) J. Haines and J. Mazzullo, Marine Geology 78(3–4), 227–240 (1988).
Brooke W. Kammrath is with the Henry C. Lee College of Criminal Justice and Forensic Sciences, Department of Forensic Science, at the University of New Haven in West Haven, Connecticut. Andrew Koutrakos is with the Henry C. Lee College of Criminal Justice and Forensic Sciences, Department of Forensic Science, at the University of New Haven and the University of Verona in Verona, Italy. Pauline E. Leary is with Smiths Detection in Edgewood, Maryland. Josemar Castillo and Joe Wolfgang are with Malvern Panalytical in Westborough, Massachusetts. Deborah Huck-Jones is with the Malvern Panalytical in Worcestershire, UK. Direct correspondence to: bkammrath@newhaven.edu

Geographical Traceability of Millet by Mid-Infrared Spectroscopy and Feature Extraction
February 13th 2025The study developed an effective mid-infrared spectroscopic identification model, combining principal component analysis (PCA) and support vector machine (SVM), to accurately determine the geographical origin of five types of millet with a recognition accuracy of up to 99.2% for the training set and 98.3% for the prediction set.
Authenticity Identification of Panax notoginseng by Terahertz Spectroscopy Combined with LS-SVM
In this article, it is explored whether THz-TDS combined with LS-SVM can be used to effectively identify the authenticity of Panax notoginseng, a traditional Chinese medicine.