Portable Raman Spectroscopy for At-Line Characterization of Carbon Nanomaterials
Special Issues
Raman spectroscopy is ideal for at-line or online material analysis for manufacturers of graphene and other carbon nanomaterials to do materials characterization, product quality control, and process monitoring.
Largely heralded as a "wonder material" since its discovery in 2004, graphene has now entered the era of industrial manufacturing. Although several techniques for large-scale graphene manufacturing have been developed, one important question remains: how to easily and rapidly characterize the quality of graphene and other carbon nanomaterials to effectively monitor and control the production process, where simple and robust analytical tools are required. In this study, three types of materials (graphene powders, graphene powder coated sheets, and carbon nanofibers) were analyzed using portable Raman spectroscopy. This efficient analysis is ideal for at-line or online material analysis for manufacturers of graphene and other carbon nanomaterials to do materials characterization, product quality control, and process monitoring.
Carbon nanomaterials constitute a variety of carbon allotropes including graphene, graphene oxide, carbon nanotubes, and carbon nanofibers. Each of these materials exhibits unique properties in electrical conductivity, thermal conductivity, and mechanical strength thanks to the distinct structures of each allotrope. For instance, graphene is a two-dimensional (2D) material formed from a hexagonal lattice of carbon atoms, whereas graphite is made up of stacked individual layers of graphene. Graphene's strength, superconductivity, and excellent heat conductivity makes it a very attractive material as a conductor in memory chips and batteries for electronics (1), and its flexibility has the potential to invigorate infrastructure, aeronautics, and biotechnology. Graphene oxide, an alternative form of graphene made from oxidized graphite that has been exfoliated to form a few layers or a single layer, is used to desalinate water and remove radioactive isotopes (2). Carbon nanotubes, which are tubes with walls formed from graphene sheets, have attracted interest from industry to potentially generate high-surface-area catalysts in fuel cells with the addition of different functional groups (3). Carbon nanotubes can either be single-walled nanotubes (SWNTs) or multiwalled nanotubes (MWNTs). Recently, MWNTs have found practical use in lithium-ion batteries to increase the lifespan and capacity of portable electronics (4). SWNTs have been slower to find commercial application, but have potential for use as transistors in microelectronics because of their bandgap and as biosensors because of their biomolecular compatibility (4). A carbon nanofiber consists of graphene layers stacked as cones or plates; recently, carbon nanofiber has found applications in construction materials thanks to its flexibility and durability (5).
Because of the intense interest surrounding their unique properties and use in many practical applications, graphene and other graphene-based nanomaterials have now entered the era of large-scale manufacturing. Graphene can be made through various processes including
- mechanical exfoliation, a low-cost technique that involves isolating graphene from bulk graphite (6),
- chemical vapor deposition (CVD), which is performed on a relatively larger scale but at a high cost and with expensive equipment (7,8), and
- exfoliation and reduction of graphene oxide, which is synthesized through the oxidation of graphite powder on a larger scale, but can result in extensive defects (9).
Although recent market forecasts predict the value of the current global graphene market to be only in the low tens of millions of dollars (10), the value of the global graphene market is estimated to reach half a billion dollars by 2025 (11). It may be decades before the potential of these carbon nanomaterials are fully realized, but research and development spending on graphene is likely to reach hundreds of millions of dollars in the coming years.
To reach these market estimates, one important question for large-scale graphene manufacturing remains: how to easily and rapidly characterize the quality of graphene and other carbon nanomaterials to effectively monitor and control the production process? Raman spectroscopy has been used extensively by carbon nanomaterials research communities in recent years because of its ability to characterize materials from their molecular vibrations (12,13). The Raman spectra of carbon nanomaterials are typically characterized by only three major bands: the G band, the D band, and the 2D band (also known as the G? band). Though simple, the spectra of these nanomaterials are rich in information about their quality and their microstructures as revealed by the peak positions, peak shapes, and peak intensities. The G band appears around 1582 cm-1 and represents the graphene in-plane sp2 vibrational mode (13,14); it is an indication of the crystallinity of the material. The dispersion of the G band can be observed in disordered graphene materials, and the dispersion is proportional to the degree of disorder (15). The D band at around 1350 cm-1 is attributed to the structural disorder near the edge of the microcrystalline structure that decreases the symmetry of the structure (14). The Raman peak intensity ratio of these two bands, ID/IG, can be used to characterize the degree of disorder of the materials (15). The 2D band appears around 2700 cm-1 depending on the laser excitation wavelength and is related to the number of graphene layers (3).
The Raman spectra of monolayer graphene (red), carbon nanotubes (black), single crystal graphite (green), and carbon black powder (blue) are shown in Figure 1. High-quality graphene is characterized by the sharp, symmetric single peak of the 2D band. The graphite spectrum displays a high amount of order and thus crystallinity characterized by its prominent G band and the absence of a D band. Since graphite is composed of many layers of monolayer graphene, the 2D band observed in the graphite spectrum is much broader and asymmetric than the graphene 2D band, indicating multiple components from several phonon modes. Carbon nanotubes display unique features of the G band. Because of the confinement and curvature of graphene layers in forming nanotubes, the G band becomes asymmetric for MWNT and more likely splits into two bands, the G+ and the G band for SWNT (15). The spectrum of carbon black, which has the lowest amount of crystallinity, displays a strong D band, a broad G band, and a high ID/IG ratio, indicating a disordered structure.
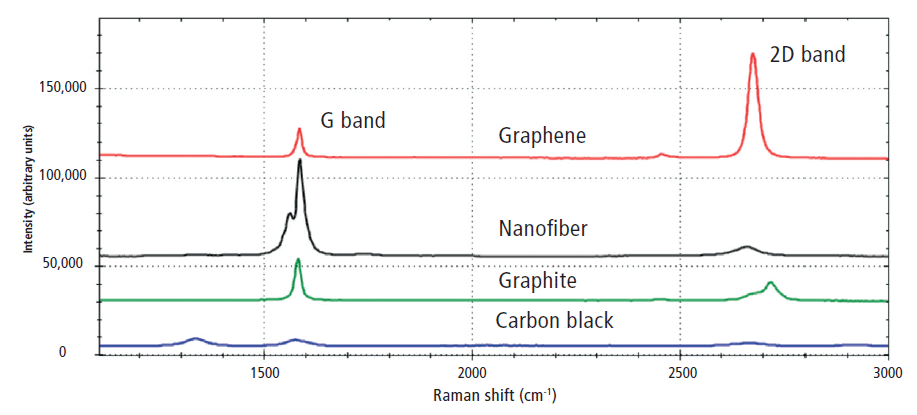
Figure 1: Raman spectra of graphene (red), carbon nanotubes (black), graphite (green), and carbon black (blue). The spectra have been manually offset.
Raman spectroscopy provides rich information about the characteristics of carbon black, graphite, graphene, and other carbon nanomaterials. Although confocal Raman microscopy can provide high-resolution characterization of carbon nanomaterials, the high cost of this instrumentation coupled with the complexity in operation and data interpretation is inadequate for monitoring in a large-scale manufacturing setting, where simple and rapid analytical tools are required. In this study, a high-throughput portable Raman spectrometer is used to characterize three types of materials: graphene powders, carbon nanofibers, and carbon black. This quick analysis can be applied as an at-line or online technique for graphene and other carbon nanomaterials manufacturers to perform materials characterization, product quality control, and process monitoring.
Experimental
An i-Raman Pro HT system (B&W Tek) with a laser excitation of 532 nm via a fiber-optic sampling probe (spot size ~100 µm) was used for measurements of all samples. The system uses a high-throughput Raman spectrometer with a back-thinned charged-coupled device (CCD) thermoelectrically cooled to -25 °C. For materials in powdered forms, no microscope was used. A probe holder with an adjustable xyz stage was used to support the fiber-optic probe over an aluminum pan containing a given carbon sample. The z-focus was used to optimize the working distance from the probe to the sample. BWSpec acquisition software was used for data collection, spectral processing, and programming the automatic calculation of peak intensities and ratios for online measurements or off-line batch processing.
Three types of carbon nanomaterials were analyzed: graphene powders, carbon nanofibers, and carbon black powders. For graphene powders, a laser power of 40 mW with an integration time of 60 s was used to acquire Raman spectra. For carbon nanofiber and carbon black powder samples, an integration time of 90 s was used with a laser power of ~21 mW. Three spectra were collected for each sample. No spectral averaging was used.
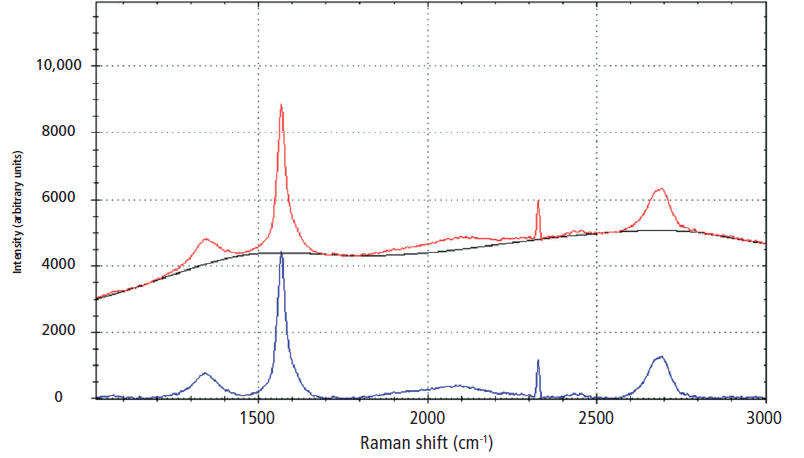
Figure 2: Raman spectrum before (red trace) and after (blue trace) airPLS baseline correction.
Results and Discussion
Graphene Powders
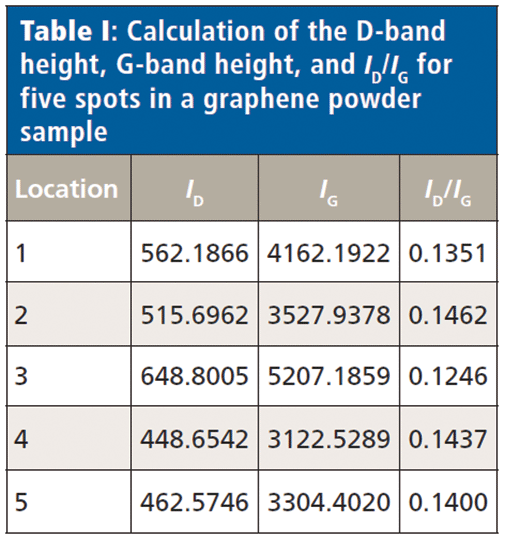
Using the adjustable x,y sample stage of the probe holder, 15 measurements from different locations of one graphene powder were collected to assess the uniformity of the sample. Two types of preprocessing were applied to the spectra prior to the peak ratio calculation. First, an adaptive iteratively reweighted penalized least squares (airPLS) background correction was used to remove any fluorescent background present in the spectra. Figure 2 shows an example of before (red trace) and after (blue trace) baseline correction. A Savitzky-Golay smoothing algorithm with a window size of 7 was also applied to all spectra. Figure 3 shows five manually offset representative spectra from different areas of the graphene powder sample. The D band (1346 cm-1), G band (1569 cm-1), and 2D band (2689 cm-1) can be observed. A prominent band at 2328 cm-1 is the Q-branch Raman peak for atmospheric nitrogen (N2) because of the nitrogen–nitrogen bond (16). The N2 Raman peak is observed because of the high-throughput nature of the Raman spectrometer.
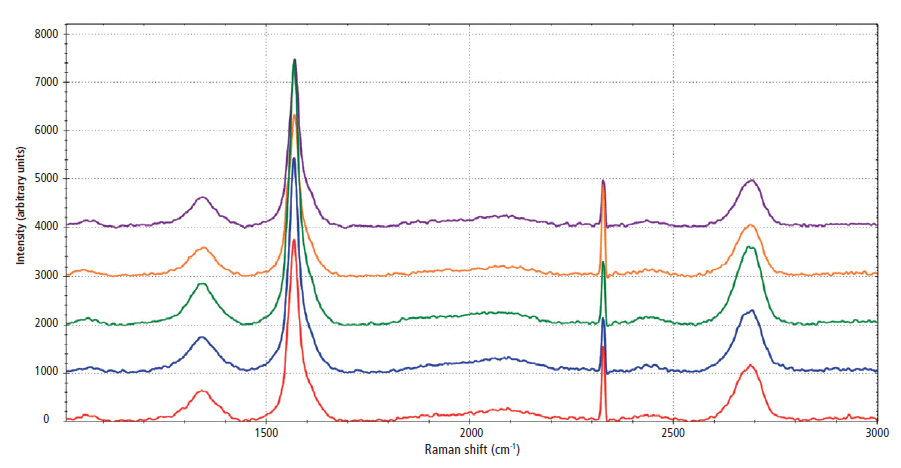
Figure 3: Raman spectra of five locations on a graphene sample. The spectra have been manually offset by 1000 intensity units.
The ratio ID/IG is an important parameter in assessing the level of disorder in the crystal structure of a sample. Table I presents the calculated peak intensities after background removal and intensity ratios for the D and G bands of the five representative spectra. The ID/IG ratios of the 15 measurements ranged from 0.1246 to 0.1462. The average ID/IG of all 15 scans was 0.1386, with a percent relative standard deviation (%RSD) of 4.07%. This result indicates a high level of uniformity within the sample.
Carbon Nanofibers and Carbon Black
Two carbon nanofiber samples and four carbon black samples were also tested. Three spectra were collected at different locations for each sample. For all collected spectra, an airPLS background correction was used to remove any fluorescent background present in the spectra. A Savitzky-Golay smoothing algorithm with a window size of 5 was also applied to all spectra. Figure 4 shows the manually offset representative spectra for each sample. The four carbon black samples display typical carbon black Raman signatures that contain D and G bands but no 2D band. The two carbon nanofiber samples show prominent D bands, indicating a high level of disorder. The G bands in the carbon nanofiber spectra also exhibit some asymmetry. The asymmetry is likely because of the curvature of the nanofiber, with the slight splitting of the G band induced by curvature of graphene layers when forming the nanofiber (15).
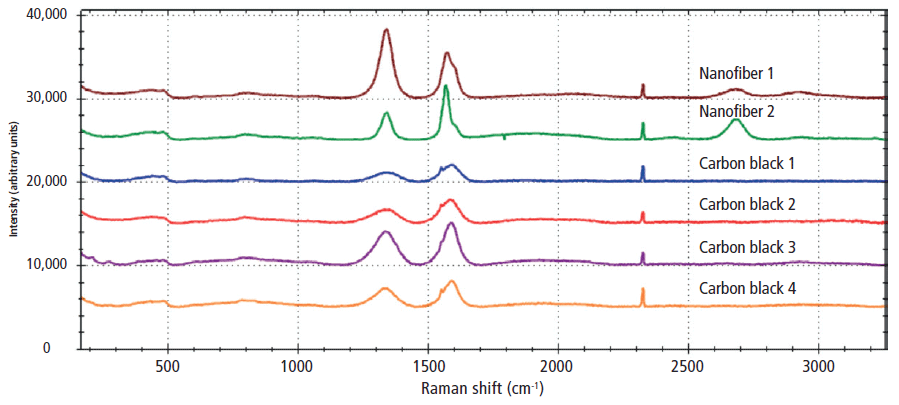
Figure 4: Raman spectra of two carbon nanofiber samples and four carbon black samples. The spectra have been manually offset by 5000 intensity units for clarification.
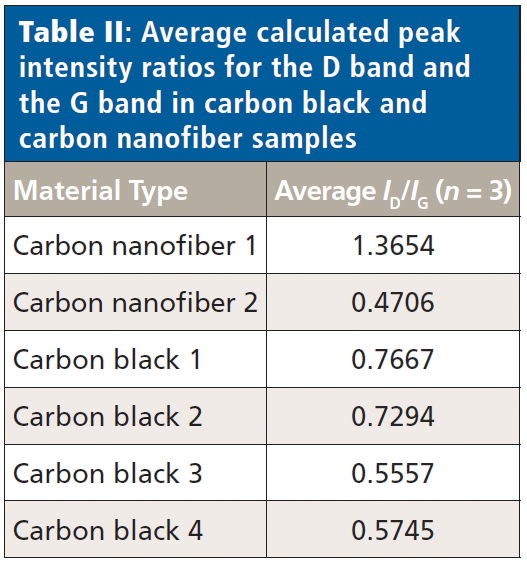
BWSpec software was used to automatically calculate the ID/IG values as spectra were collected. Table II presents the calculated ID/IG peak intensity ratios measured for the four carbon black samples and two carbon nanofiber samples. The carbon nanofiber sample 2 has the highest level of order of all samples with an average ID/IG of 0.4706, whereas the carbon nanofiber sample 1 has an especially high level of disorder with an average ID/IG of 1.3654.
Raman spectroscopy can also be very useful for identifying contaminants or starting materials in carbon nanomaterial final products. For example, the carbon black 3 and carbon black 4 samples contain up to 10% hematite (Fe2O3) because of their manufacturing processes. Figure 5 shows the Raman spectra of carbon black 3 and 4 compared to the Raman spectrum of hematite. Raman peaks at 213 cm-1 and 278 cm-1 are in good agreement with the Raman spectrum of hematite.
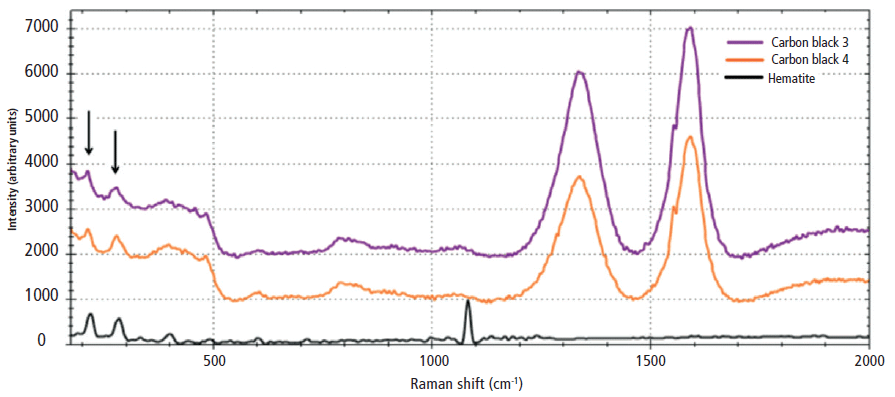
Figure 5: Raman spectra of carbon black 3 (purple) and carbon black 4 (orange). Raman peaks at 213 cm-1 and 278 cm-1 are consistent with a hematite Raman spectrum (black). The spectra have been manually offset by 1000 cm-1 for clarification.
Conclusions
Having robust and simple quality control tools for carbon nanomaterials such as portable Raman spectroscopy will help facilitate the future growth of the global graphene market. Although simple, a Raman spectrum of a carbon nanomaterial can provide a vast amount of information to characterize materials including carbon black, graphite, carbon nanotubes, and graphene. Portable Raman spectroscopy is capable of quickly characterizing carbon nanomaterials, revealing critical information regarding material qualities such as sample crystallinity and level of disorder using various parameters such as D- and G-band intensity ratios. Graphene manufacturers can easily use the analysis to obtain at-line or online measurements for material characterization, product quality control, and process monitoring.
References
(1) C. Ahn, S.W. Fong, Y. Kim, S. Lee, A. Sood, C.M. Neumann, M. Asheghi, K.E. Goodson, E. Pop, and H.S.P. Wong, Nano Lett. 15, 6809–6814 (2015).
(2) H. Hegab and L. Zou, J. Membr. Sci. 484, 95–106 (2015).
(3) C. Luo, H. Xie, Q. Wang, G. Luo, and C. Liu, J. Nanomater. 2015, 1–10 (2015).
(4) M.F.L. DeVolder, S.H.Tawfick, R.H. Baughman, andd J. Hart, Science 339, 535–539 (2013).
(5) Y.L. Mo and R.H. Roberts in Advances in Nanofibers, R. Maguire, Ed. (InTech, 2013).
(6) M. Yi and Z. Shen, J. Mater. Chem. A. 3, 11700–11715 (2015).
(7) C. Mattevi, H. Kim, and M. Chhowalla, J. Mater. Chem. 21, 3324–3334 (2011).
(8) Y. Zhang, L. Zhang, and C. Zhou, Acc. Chem. Res. 46, 2329–2339 (2013).
(9) S. Stankovich, D.A. Dikin, R.D. Piner, K.A. Kohlhaas, A. Kleinhammes, Y. Jia, Y. Wu, S.T. Nguyen, and R.S. Ruoff, Carbon 45, 1558–1565 (2007).
(10) Deloitte Global analysis, 2015, www.deloitte.com/TMTpredictions.
(11) https://www.grandviewresearch.com/industry-analysis/graphene-industry.
(12) M.S. Dresselhaus, A. Jorio, M. Hofmann, G. Dresselhaus, and R. Saito, Nano Lett. 10, 751–758 (2010).
(13) A.C Ferrari and D.M. Basko, Nat. Nanotechnol. 8, 235–246 (2013).
(14) A.C. Ferrari, J.C. Meyer, V. Scardaci, C. Casiraghi, M. Lazzeri, F. Mauri, S. Piscanec, D. Jiang, K.S. Novoselov, S. Roth, and A.K. Geim, Phys. Rev. Lett. 97, 1874011–1874014 (2006).
(15) A.C. Ferrari, Solid State Commun. 143, 47–57 ( 2007).
(16) D. Tuschel, Spectroscopy 29, 14–21 (2014).
Dawn Yang and Kristen Frano are with B&W Tek in Newark, Delaware. Direct correspondence to: kristenf@bwtek.com or dawny@bwtek.com

New Study Reveals Insights into Phenol’s Behavior in Ice
April 16th 2025A new study published in Spectrochimica Acta Part A by Dominik Heger and colleagues at Masaryk University reveals that phenol's photophysical properties change significantly when frozen, potentially enabling its breakdown by sunlight in icy environments.