Sulfobutyl Ether-β-Cyclodextrin–Assisted Fluorescence Spectroscopy for Determination of L-Amlodipine in Tablets
This study describes a validated spectrofluorometric method for the analysis of L-amlodipine in tablets.
A spectrofluorometric method for the rapid and highly sensitive screening of L-amlodipine was developed using sulfobutyl ether-β-cyclodextrin (SBE-β-CD)-enhanced fluorescence detection. The method depends on measuring the native fluorescence of L-amlodipine in water at 455 nm after excitation at 365 nm. Under optimum reaction conditions, linear relationships with good correlation coefficients (0.9998) were found between the fluorescence intensity and the concentrations of L-amlodipine in the concentration range of 0.56–11.34 µg/mL with a limit of detection 0.17 µg/mL and limit of quantification of 0.55 µg/mL. The method was fully validated and successfully applied for the determination of L-amlodipine in tablets with an average percentage recovery of 98.12–103.21%. Compared to reference methods, it has merits of ease of accessibility, greater sensitivity, low-cost, and a broader range of detection. Moreover, the inclusion interactions were examined by ultraviolet–visible (UV–vis), fluorescence, and nuclear magnetic resonance (NMR) spectroscopy.
From 1980 to 2013, various types of cyclodextrins became everyday commodities in separation science as well as enabling additives for the enhancement in sensitivity and selectivity of different analytical techniques (1). L-Amlodipine, or 2-[(2-aminoethoxy) methyl]-4-(2-chlorophenyl)-3-ethoxycarbonyl-5-methoxycarbonyl-6-methyl-1,4-dihydropyridine, is a calcium channel blocking agent of the dihydropyridine derivative, which is used in the treatment of hypertension and angina (2). Moreover, it selectively inhibits the arterial vascular smooth muscle cell proliferation, which prevents the progressive narrowing of the arteries (3). Therefore, very sensitive and specific analytical methods for its quantitative determination in pure, pharmaceutical dosage forms or biological fluids are necessary.
So far, high performance liquid chromatography (HPLC) (4), gas chromatography (GC) with electron capture detection (ECD) (5), capillary electrophoresis (CE) with UV detection (6), flow injection analysis (7), enzyme-linked immune sorbent assay (ELISA) (8), and mass spectrometry (MS) (9,10) methods have been developed for the quantitative determination of L-amlodipine. These methods offer the required sensitivity and selectivity for the analysis of L-amlodipine, but problems associated with high-analysis cost and long analysis times cannot be ignored with respect to some of these methods. In particular, the Fell group (11) has produced the earliest example of the resolution of amlodipine enantiomers using a charged cyclodextrin additive in 52 min on a C8 column, which possess a short analysis time for a spectrofluorometric method. In 2008, A.M. Mahmoud and colleagues (12) reported the first example of spectrofluorometric analysis of L-amlodipine by its condensation reaction with ninhydrin and phenylacetaldehyde.
In the present study, we extend the scope of Mahmoud's research by avoiding tedious derivatization and using sulfobutyl ether-β-cyclodextrin (SBE-β-CD)-assisted spectrofluorometric analysis. This enabled the improvement in the sensitivity and accuracy of luminescence spectroscopy and broadened the linear relationships with good correlation coefficient (0.9998). Moreover, we investigated the inclusion complex interaction of L-amlodipine and SBE-β-CD by means of ultraviolet–visible (UV–vis), fluorescence, and nuclear magnetic resonance (NMR) spectroscopy.
Experimental
Instrumentation
An RF-5301 PC spectrofluorimeter (Shimadzu), with 1-cm matched quartz cells, was used for all measurements. The spectrofluorimeter was set at an excitation and emission slit width of 5 nm. A thermostatically controlled water bath (Schetzort) was used. The pH of the samples was measured using a Qph 70 pH meter (Shanghai REX). UV-vis spectra were recorded using a Cary 50 Scan UV-vis spectrophotometer (Agilent Technologies). NMR spectra were recorded on a Bruker Avance DMX-500 spectrometer. The size of NMR tubes was 3 mm.
Chemicals and Reagents
All reagents were of analytical grade and were used as received without further purification. L-Amlodipine besylate was purchased from Beijing J&R Times Technology Co., Ltd. SBE-β-CD was provided by Shandong Xinda Fine Chemical Co., Ltd. The pH of separate portions of the solution was adjusted to 2.0, 3.0, 5.0, 7.0, 9.0, and 11.0 before the addition of SBE-β-CD at the desired concentration, by addition of sodium hydroxide and phosphoric acid. The concentration of SBE-β-CD was varied from zero to 2.0 × 10⁻² mol/L. A stock solution of L-amlodipine (5 × 10⁻³ mol/L) was prepared. The available tablets (Shihuida Pharmaceuticals (jilin) Ltd.) used in the present investigation were labeled to contain 2.5 mg L-amlodipine besylate per tablet. Water was doubly distilled for the preparation of aqueous solutions.
Preparation of Inclusion Complex of L-Amlodipine with SBE-β-CD
Accurately prepared 20-mL volumes of L-amlodipine solution (5 × 10⁻⁵ M) were transferred into 50-mL conical flasks. The pH was adjusted to 3 by adding the appropriate amount of NaH2PO4 and H3PO4. The same molar concentration of SBE-β-CD was prepared in distilled water. Subsequently, 20 mL of SBE-β-CD solution was added to the L-amlodipine solution and stirred with an electromagnetic stirrer. The mixture was continuously stirred for 30 min at room temperature to establish the optimum complexation equilibrium. The pH varied from 2 to 11, and all the solutions are transparent. The prepared solutions were placed in a 1-cm pathlength quartz cuvette for obtaining fluorescence spectra, then concentrated on a rotary evaporator for recording the 1H NMR spectrum. The 1H NMR spectra were recorded at 400 MHz with D2O as the solvent at 25 °C.
Tablet Solution
Four tablets were weighed and finely powdered. An accurately weighed amount of pulverized tablets equivalent to 10.0 mg of L-amlodipine was transferred into a 100-mL calibrated flask and dissolved in 100 mL of water as stock solution. A 1-mL volume of stock solution was pipetted into a 50-mL volumetric flask and diluted to the mark with the same solvent according to the method mentioned above.
Results and Discussion
Optimization of Reaction Conditions
Effects of Time on the Reaction of L-Amlodipine with SBE-β-CD
The results obtained from optimizing the reaction time indicated that the maximum fluorescence intensity was attained after 30 min. As seen in Figure 1, longer reaction times led to a reduction in the fluorescence intensity. Therefore, all subsequent experiments were carried out at room temperature for 30 min.
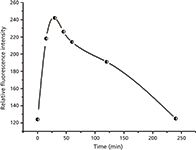
Figure 1: Effect of time on the reaction of L-amlodipine with SBE-β-CD.
Effects of pH with SBE-β-CD Medium
For investigating the effect of pH, the complexation reaction was performed at different pH values (2.00–11.00). The results indicated that the fluorescence intensity was pH dependent, as shown in Figure 2. The optimum pH for maximum fluorescence intensity was found to be 3.0.
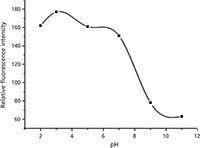
Figure 2: Effect of pH on the reaction of L-amlodipine with SBE-β-CD.
Effect of SBE-β-Cyclodextrin
The UV–vis absorption spectra of L-amlodipine at different concentrations of SBE-β-CD are shown in Figure 3. The absorption peaks of L-amlodipine at pH 3.0 appear at 366 nm. Upon increasing the concentration of SBE-β-CD, the absorption maximum is systematically blue shifted from 366 to 360 nm and results in an enhanced spectral response. The absorption spectra of L-amlodipine undergo a slight blue shift, showing a change in absorption maxima even in the presence of the highest concentration of SBE-β-CD used (2 × 10⁻² mol/L). There is no change in the observed absorbance by further addition of SBE-β-CD. This behavior can be explained by a significant and temporary change of the analyte microenvironment (from aqueous hydrophilic to the lipophilic phase) in the SBE-β-CD cavity.
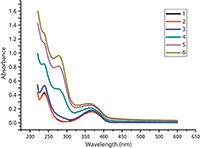
Figure 3: Upon increasing the concentration of SBE-β-CD, the absorption maximum is systematically blue shifted from 366 to 360 nm.
In water, the relatively lipophilic nanocavities of SBE-β-CD offer such a local microenvironment for L-amlodipine that it results in the useful enhancement of the fluorescence signals of the complexed analyte. The fluorescence spectra changes of L-amlodipine plotted against the SBE-β-CD concentration (Figure 4) illustrate two effects: First, the fluorescence spectrum is blue shifted from 455 to 442 nm. Second, the fluorescence intensity of L-amlodipine initially decreased, then subsequently increased with an increase in the value of SBE-β-CD concentration, which is consistent with the formation of inclusion complexes between L-amlodipine and SBE-β-CD. When the SBE- β -CD concentration was 2 × 10⁻² mol/L, the fluorescence maxima can be attained. Thus, a concentration of 2 × 10⁻² mol/L SBE-β-CD was selected for subsequent experiments.
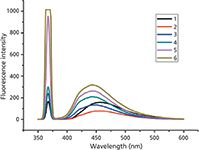
Figure 4: Plot of the fluorescence spectra of L-amlodipine versus SBE-β-CD concentration.
The Stoichiometry Between L-Amlodipine and the Anionic SBE-β-CD
Using the methods of Likussar and Boltz (13), continuous-variation plots were generated. In the characteristic triangular continuous-variation plots, the function used was (AL)/([AL]+[CD]) on the ordinate, against (CD)/([AL]+[CD]) on the abscissa. This indicates that the continuous-variation plot has a maximum corresponding to the L-amlodipine–anionic SBE-β-CD molar fraction in solution of 0.5:0.5 and further indicates a stoichiometry of 1:1 for the complex between L-amlodipine and anionic SBE-β-CD is the predominant molecular species in solution (14). Moreover, using the software tool DMol3 found in the Materials Studio software package (Accelrys), both optimization of the initial structure and calculation of the complex's structure energy (-7554.2520640 Hartrees) indicates it is fairly stable (Figure 5). This result is clearly consistent with the fact that SBE-β-CD forms a stable 1:1 complex with L-amlodipine in water, and indicates that the CH2NH3+ group of L-amlodipine is trapped and retained in the cavity of SBE-β-CD.

Figure 5: Formation of the inclusion complex between L-amlodipine and SBE-β-CD. The initial structures were optimized. Color labels: gray = carbon in L-amlodipine; white= hydrogen in L-amlodipine; red= oxygen in L-amlodipine; blue = nitrogen in L-amlodipine; and green = chlorine in L-amlodipine. SBE-β-CD is shown with a annulus representation.
NMR Analysis of the Interactions Between L-Amlodipine and the Anionic SBE-β-CD
Figure 6 shows the changes in the 1H NMR signals of L-amlodipine induced by the addition of SBE-β-CD in D2O at 25 °C. Upon the addition of SBE-β-CD, significant chemical shift changes of the protons on L-amlodipine were noted. The signal corresponding to L-amlodipine at δ = 6.15 and δ= 4.50 ppm disappeared, whereas the resonance signals associated with SBE-β-CD all shifted downfield dramatically and broadened. Slight broadening occurred because of the complexation dynamics (Figure 6). Shielding effects exist between SBE-β-CD (the host) and the L-amlodipine (the guest). These phenomena provided strong evidence for interactions between SBE-β-CD and L-amlodipine.
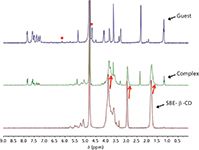
Figure 6: 1H NMR spectra (400 MHz): (upper) L-amlodipine (guest); (lower) SBE-β-CD (host); (middle) 1:1 Complex of L-amlodipineâSBE-β-CD. 1H NMR spectral changes observed in D2O at 25 °C. Red circles denote the signals associated with L-amlodipine at δ = 6.15 and δ = 4.50 ppm disappeared.
Validation of the Proposed Methods
Linearity and Sensitivity
Under the specified optimum reaction conditions, calibration curves for L-amlodipine with different analytical reagents used were constructed by measuring a series of eight concentrations of the standard solutions of L-amlodipine. All measurements were carried out using six replicate measurements (n = 6). The assays were carried out according to the general procedures previously established. In all cases, standard curves were linear with acceptable intercepts and very good correlation coefficients (0.9998) in the general concentration range of 0.56–11.34 µg/mL (Table I) .

Table I: Quantitative parameters for the mentioned spectrofluorometric methods for analysis of L-amlodipine
The limit of detection (LOD) was defined as the concentration of drug giving a signal-to-noise ratio of 3:1; while the lower limit of quantification (LOQ) was determined using the formula:

where SDa is the standard deviation of the intercept, and b is the slope. From the results of the calculation, we obtained an LOD = 0.17 µg/mL, while the LOQ = 0.55 µg/mL.
Precision
The precision of the method was estimated by measuring six replicate samples of L-amlodipine. The assays provided satisfactory results, where the relative standard deviation (RSD) was 0.73%, less than 2%. This level of precision of the proposed method was adequate for the quality control analysis of L-amlodipine in its pharmaceutical dosage forms.
Analysis of Pharmaceutical Dosage Forms
The validity of the proposed method for the determination of L-amlodipine in pharmaceutical preparations was tested by application of the standard addition technique. The results obtained were reproducible and the mean recoveries were in the range of 98.12–103.21%.
Conclusion
The present study describes a validated spectrofluorometric method for the analysis of L-amlodipine in tablets. Because L-amlodipine forms a 1:1 complex with SBE-β-CD, the method has merits of being simple, rapid, accurate, and reliable for the determination of L-amlodipine in tablets. The method also has great value for the quality control analysis of L-amlodipine because of its improved simplicity and sensitivity.
Acknowledgments
This work was supported by the National Natural Science Foundation of China (21305118), and Hunan Provincial Science & Technology Department (2013SK2021). All authors express their sincere thanks.
References
(1) L. Szente and J. Szemán, Anal. Chem. 85, 8024–8030 (2013).
(2) B. Suchanova, R. Kostiainen, and R.A. Ketola, Eur. J. Pharm. Sci. 33, 91–99 (2008).
(3) Y.M. Lai, N. Fukuda, J.Z. Su, R. Suzuki, Y. Ikeda, H. Takagi, Y. Tahira, and K. Kanmatsuse, Hypertens. Res. 25, 109–115 (2002).
(4) A.R. Tengli, B.M. Gurupadayya, and N. Soni, Inter. J. Chem. Anal. Sci. 4, 33–38 (2013).
(5) F. Scharpf, K.D. Riedel, H. Laufen, and M. Leitold, J. Chromatogr. B. 655, 225–233 (1994).
(6) P. Mikǔs, K. Maráková, J. Marák, I. Nemec, I. Valášková, and E. Havránek, J. Chromatogr. B. 875, 266–272 (2008).
(7) G. Altiokka and M. Altiokka, Pharmazie. 57, 500 (2002).
(8) K. Matalka, T. El-Thaher, M. Saleem, T. Arafat, A. Jehanli, and A. Badwan, J. Clin. Lab. Anal. 15, 47–53 (2001).
(9) K. Sarkar, D. Ghosh, A. Das, P.S. Selvan, K.V. Gowda,U. Mandal, A. Bose, S. Agarwal, U. Bhaumik, and T.K. Pal, J. Chromatogr. B. 873, 77–85 (2008).
(10) J.Z. Shentu, L. Z. Fu, H.L. Zhou, X.J. Hu, J. Liu, J.C. Chen, and G.L. Wu, J. Pharm. Biomed. Anal. 70, 614–618 (2012).
(11) P.K. Owens, A.F. Fell, M.W. Coleman, and J.C. Berridge, Chirality 8, 466–476 (1996).
(12) H.M. Abdel-Wadood, N.A. Mohamed, and A.M. Mahmoud, Spectrochim. Acta, Part A. 70, 564–570 (2008).
(13) W. Likussar and D.F. Boltz, Anal. Chem. 43, 1265–1272 (1971).
(14) P.K. Owens and A.F. Fell, J. Chromatogr. A. 797, 187–195 (1998).
Lin Yang, Jiaqi Xie, Xiaoming Deng, Shenzhi Lai, and Xiaoming Chen are with the Key Laboratory of Environment-Friendly Chemistry and Application in Ministry of Education at the College of Chemistry at Xiangtan University in Xiangtan, China.
Direct correspondence to: 352180014@qq.com

Geographical Traceability of Millet by Mid-Infrared Spectroscopy and Feature Extraction
February 13th 2025The study developed an effective mid-infrared spectroscopic identification model, combining principal component analysis (PCA) and support vector machine (SVM), to accurately determine the geographical origin of five types of millet with a recognition accuracy of up to 99.2% for the training set and 98.3% for the prediction set.
Authenticity Identification of Panax notoginseng by Terahertz Spectroscopy Combined with LS-SVM
In this article, it is explored whether THz-TDS combined with LS-SVM can be used to effectively identify the authenticity of Panax notoginseng, a traditional Chinese medicine.