Tip-Enhanced Raman Spectroscopy: An Emerging Technique for Probing Biology and Electrochemistry at the Nanoscale
TERS has sub-nanometer spatial resolution and single-molecule sensitivity, making it useful for exploring structure and dynamics at the nanoscale in fields such as biology and electrochemistry.
This review discusses the most recent advances of tip-enhanced Raman spectroscopy (TERS), a modern spectroscopic technique that has subnanometer spatial resolution and single-molecule sensitivity in biology and electrochemistry. It also shows how this spectroscopic technique can be used to explore structure and dynamics at the nanoscale.
Raman spectroscopy is a label-free, noninvasive, and nondestructive spectroscopic technique that provides information about the chemical structure of analyzed specimens. It is based on the phenomenon of inelastic light scattering of photons that excite molecules to higher vibrational or rotational states. As a result, scattered photons have lower (Stokes) and higher (anti-Stokes) energies, compared to the incident light. The shift in energy provides information about vibrational modes of molecules and, consequently, can be interpreted in terms of specific chemical groups. Inelastic scattering is a very rare event; only one out of 1010 photons exhibits such an energy exchange, which makes spontaneous Raman scattering relatively weak compared to fluorescence or phosphorescence processes (1-3).
In 1977, Van Duyne discovered that Raman scattering can be amplified by a factor of 105-108 by noble metal nanoparticles (4). This phenomenon, known as surface-enhanced Raman spectroscopy (SERS), is based on light-induced coherent oscillations of an electron cloud at the surface of nanoparticles (5-7). SERS is minimally invasive, simultaneously providing single-molecule sensitivity. Noble metal nanoparticles can be grown or electrochemically etched at the apex of a scanning probe that is used in atomic force microscopy (AFM). If this probe is positioned above the sample of interest and illuminated with electromagnetic radiation, the nanoparticle would enhance the Raman signal from molecules located directly under it. The advantage of this methodology, known as tip-enhanced Raman spectroscopy (TERS), is that probe position can be precisely controlled at the substrate's surface (8-10). Consequently, collection of TER spectra at different regions of the substrate allows for acquisition of a chemical map of the analyzed specimen with nanometer spatial resolution. In 2000, three laboratories led by Zenobi, Kawata, and Anderson independently provided the first experimental evidence of TERS (11-13). Specifically, Stöckle and coworkers acquired 25 spectra at the boundary of a brilliant cresyl blue (BCB) film on a bare glass slide using silver-coated AFM tip. The researchers demonstrated that only Raman spectra acquired over the BCB region exhibited the signature of the dye molecules. It has also been suggested that TERS spatial resolution was limited to the size of an apex of the metal-coated tip (12). Independently, Hayazawa and coworkers reported TERS using another dye, rhodamine-6G (R6G). Using a similar AFM-based experimental setup, the researchers showed that TERS could provide ~40-fold signal enhancement compared to a far-field Raman signal (13). In the same year, Anderson demonstrated TERS on thin sulfur films deposited on quartz slides with a 104 signal enhancement (11). These first experiments paved the way for practical applications of TERS in many research areas, ranging from solid-state physics to art conservation science (14-20). Critical discussions of reported results can be found in several excellent reviews (21,22).
Mechanisms of Heterogeneous Catalysis and Angstrom Spatial Resolution
During the last several years, a variety of interesting studies came out that transformed our understanding of the capabilities and limitations of this spectroscopic technique. Most of them were made on ultrahigh vacuum scanning tunneling microscope (UHV-STM) TERS systems (20,23). One of the advantages of UHV systems is that they allow for an excellent control of the sample–molecule interactions and molecule orientation on the surface. Using these advantages, UHV-TERS enabled elucidation of weak (24) and strong molecule–substrate interactions (25), as well as mechanisms of heterogeneous catalysis (26). For instance, Ren and coworkers used phenyl isocyanide (PIC) as a molecular reporter to probe well-defined surface features at the atomic level (Figure 1). PIC was deposited on an Au(III) substrate with a submonolayer of Pd (26).
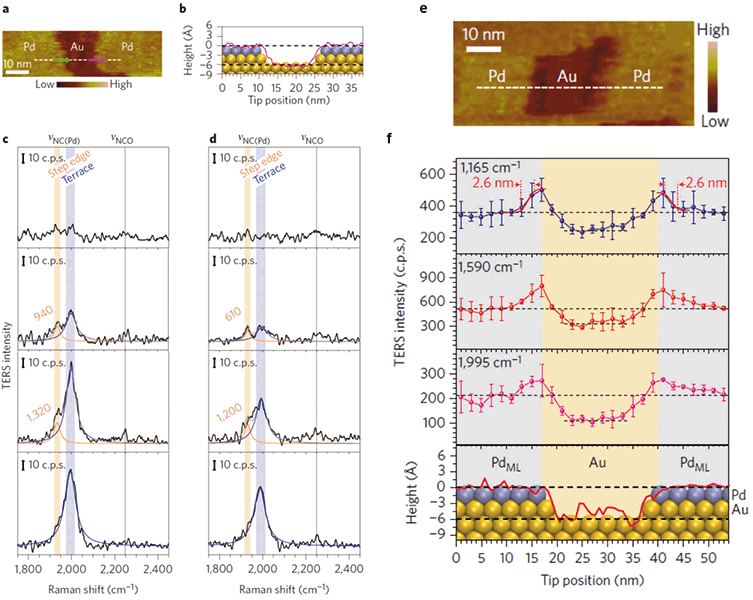
Figure 1: TERS reveals catalytic properties of bimetallic Pd/Au(III) surfaces. STM image (a) of sub-monolayer of Pd on an Au(III) surface with adsorbed PIC molecular reporter, and a height profile (b) along the dashed line in (a), superimposed with the atomic model of the surface atoms. Line-scan (c) TERS spectra (from bottom to top) across a Pd terrace–Pd step edge–Au terrace region (indicated by green arrow in (a)). Line-scan (d) TERS spectra (from top to bottom) across Au terrace–Pd step edge–Pd terrace region (indicated by pink arrow in (a)). Plots of intensities (f) and corresponding STM image (e) of the three main TERS peaks (1165, 1590 and 1995 cm–1 ) with the tip position are shown. Error bars indicate standard deviation for the three measurements (26).
The researchers demonstrated that in TER spectra collected at Pd edges, the C≡N vibrational band of the PIC is red-shifted by 60 cm–1 compared to the Pd terrace. These results were consistent with DFT calculations, which showed that the degree of back donation from the d band of the metal to the antibonding π* orbital of PIC at the step site is greater than at the terrace sites. This back-donation weakens the C≡N bond, suggesting that PIC molecules will have higher reactivity on Pd steps as compared to Pd terraces. Ren and coworkers also observed an increase in TER signal intensity at the edges of Pd, possibly due to an increased field concentration at sharp metallic features (lightning rod effect). This indicates that TERS can be used to prove catalytic performances of sharp features on a catalytic surface such as steps, kinks, isolated adatoms, or metal or oxide interfaces, which are considered to be the active sites in a variety of reactions.
Recent reports demonstrated that UHV-TERS was capable of providing Angstrom spatial resolution. Chaing and coworkers investigated conformational dynamics of H2TBPP adsorbed on a Cu(III) surface with UHV-TERS (27). The H2TBPP/Cu(III) system has two metastable surface-mediated conformations: buckled up and buckled down. At room temperature, the barrier between these conformations can be easily overcome, and H2TBPP can randomly switch between these two states. Simultaneous measurement of STM and TERS line scans across four H2TBPP molecules demonstrated that TERS has 2.6 Å lateral resolution under ultrahigh vacuum (UHV) conditions (Figure 2).
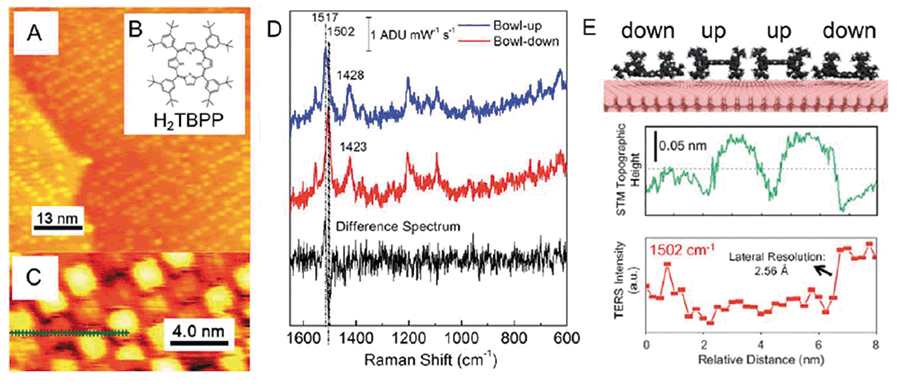
Figure 2: Experimental evidence of Angstrom spatial resolution of TERS. High resolution UHV-TERS: (a) large-scale STM topographic image of a submonolayer coverage of H2TBPP on Cu(III), (b) Molecular structure of H2TBPP, and (c) high-resolution STM topographic image probed by a Ag tip before the TERS imaging experiment. The dotted green line indicates the points where TERS spectra were obtained: (d) TERS spectrum of the bowl-up and bowl-down conformations of H2TBPP reconstructed from the line scan. The difference spectrum shows a ~15 cm-1 shift in the 1502 cm-1 mode for the down geometry. Figure (e) Top: Schematic of H2TBPP porphyrin rings on Cu(III) buckled up/down, middle: simultaneously acquired STM line scan, bottom: TERS line scan of the integrated 1502 cm-1 mode (27).
In 2017, the Apkarian group introduced TERS-relayed molecular force microscopy using CO-terminated tips. These researchers utilized an advantage of a large Stark tuning rate of the CO stretch to image Co(II)-tetraphenylporphyrin (Co-TPP) arrays with atomic resolution (28). Tallarida and coworkers concluded that localization of the field, rather than enhancement, is the crucial consideration in single molecule sensitivity and subnanometer spatial resolution. At this extreme confinement of TERS, plane-wave selection rules break down, and scattering driven by field gradients dominate the observable spectra.
Probing Electrochemistry at the Nanoscale by TERS
In 2015, the Van Duyne and Ren research groups independently demonstrated that TERS can be used to probe electrochemical processes at the solid–liquid interface. The Van Duyne group investigated nanoscale redox behavior of Nile Blue (NB) using electrochemical TERS (EC-TERS) and compared these results with conventional cyclic voltammetry (CV) (Figure 3) (18).
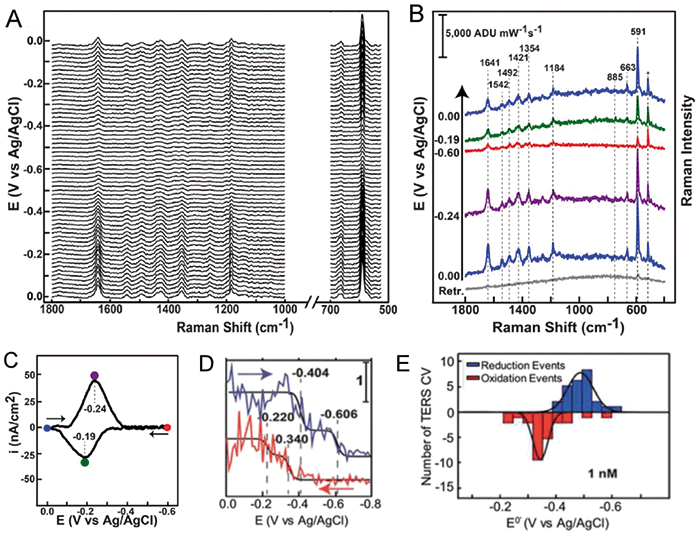
Figure 3: EC-TERS of redox reaction of NB. Stack plot: (a) and individual (b) EC-TER spectra of NB acquired at different potentials during cyclic voltammetry (CV) showing reversible reduction and oxidation of NB. The asterisk denotes the Si Raman band from the AFM tip. Figure (c) is background subtracted CV of NB on ITO acquired concurrently with the EC-TER spectra in (a). E0' = â«0.215 V (d) charge acquired by integrating the CV in (c). The charge is directly proportional to the number of molecules reduced during the CV experiment. The reverse sweep is offset by 0.6 µC/cm2 for clarity. (e) Histograms of single-molecule formal potentials extracted from fitting TERS CVs.
This simple molecule undergoes a two electron one proton reduction at negative potentials (approximately -0.5 V vs Ag/AgCl) at a pH above 6. In the reported EC-AFM-TERS experiment, NB was spontaneously adsorbed onto an indium tin oxide (ITO) film that was used as a working electrode (WE). Pt and Ag/AgCl were used as counter (CE) and reference (RE) electrodes, respectively (Figure 4a). After an Au-coated AFM tip was positioned on the WE, changes in acquired TER spectra were monitored as the potential was swept from 0.0 to -0.6 V vs Ag/AgCl and returned back to 0.0 V vs Ag/AgCl. Kurouski and coworkers found that overall intensities of the spectra decrease with a decrease of the potential, in agreement with the change in electronic states of NBO and NBR. As the potential was swept from -0.6 V back to 0.0 V, ~75% of the initial spectral intensity returned, demonstrating reversibility of the monitored redox reaction of NB under the AFM tip.
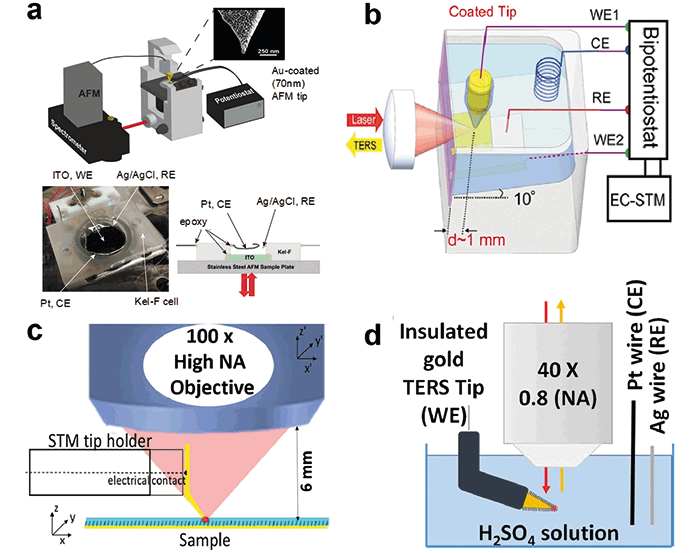
Figure 4: Configurations of proposed EC-TERS instruments: (a) inverted TERS-AFM set-up, as developed in the Van Duyne group, (b) upright EC-STM-TERS set-up with a side illumination through the cell, as proposed by Ren and Domke, (c) upright STM-TERS configuration with a thin layer of organic solvent, as proposed by Touzalin, (d) upright EC-Tip-SERS using a functionalized TERS tapered electrode and an immersion objective.
The researchers also observed step-like changes of TER intensity of NB in some TERS voltammograms, such as the one shown in Figure 3e. Such a step-like behavior of TERS CVs suggested that redox reactions of only a few NB molecules were probed at those surface sites. This was further corroborated by calculating the average number of molecules under the tip. For a tip radius of 20 nm and an average surface number density of 2 × 10¹² molecules per cm2, the average number of molecules under the tip was 6. This study highlighted the potential of TERS for studying redox reactions at the nanoscale, probing few- or single-molecule behavior across heterogeneous surfaces (18).
This work was followed by Mattei and coworkers demonstrating that EC-TERS could be used to measure nanoscale variations in the formal potential (E0') of a surface-bound redox couple. The researchers acquired multiple TERS CVs at different surface coverages of NB on the surface of ITO, and different locations on the ITO surface. Next, collected TERS CVs were fit to the Laviron model for surface-bound electroactive species, which allowed for a quantitative extraction of the formal potential E0' at each spatial location. Histograms of the single-molecule E0' at each coverage indicated that the electrochemical behavior of the cationic oxidized species is less sensitive to the local environment than the neutral reduced species.
Independently, the Ren research group reported a very interesting application of EC-TERS, reporting that it could be used to monitor arrangements and elucidation of protonation states of molecules (4'-(pyridin-4-yl)biphenyl-4-yl) methanethiol (4-PBT)) on a Au(III) surface (29). The researchers developed an elegant EC-STM-TERS setup with a tilted sample plate relative to the incident laser light (Figure 4b). To reduce Faraday current from the probe shaft, Zeng and coworkers embedded freshly etched Au or Ag wire into polyethylene glue, which allowed for the tip's apex to remain plasmonically active. Following this study, the Domke group examined adsorption geometry and chemical reactivity of adenine on Au(III) as a function of applied potential (30). Martín Sabanés and coworkers demonstrated that protonated physisorbed adenine adopted a tilted orientation at low potentials while it is vertically adsorbed near the point of zero charge. Further potential increase induces adenine deprotonation and reorientation to a planar configuration (30).
The Lucas group proposed an elegant experimental setup for STM-EC-TERS measurements (31,32). Touzalin and coworkers used a very thin layer of liquid and slightly bent tip to access its focal point by an air objective located on the top of the sample (Figure 4c). It has been shown on the example of 4-nitrothiophenol layer assembled on large gold substrates that the distribution of the surface transformation products could be inhomogeneous and explained by the ohmic drop and the spatial dispersion of RC charging time constants across large electrodes (31). Further exploring the possibility of top-access of EC-TERS, Touzalin and coworkers were able to demonstrate EC-TERS with the immersed objective in the electrolyte solution (Figure 4d). Using this experimental setup, the researchers were able to track the progressive conversion of the nitro group of 4-NTP to amino (4-ATP). It has been found that the intermediate 4 e– reduction of the nitro group of 4-NTP to hydroxylamine (4-HATP) competed with the 6 e– reduction to amine (4-ATP) at a potential where this was not expected to occur (32).
Unraveling Structural Organization of Biomolecules using TERS
During the last decade, TERS was extensively utilized to explore structural organization of biological macromolecules, including DNA, RNA, amyloid, and collagen fibrils (33–36). Direct utilization of TERS in these research areas is probably the most challenging, because of a high complexity of biological objects. Nevertheless, in many cases, obtained results transformed our understanding about the structural organization of biological macromolecules due to the sub-diffraction spatial resolution and nondestructive and noninvasive nature of this technique.
One of the most attractive and desired applications of TERS is DNA and RNA sequencing. Pioneering work on the feasibility of this TERS application came from the Deckert group. Deckert and coworkers used TERS to read individual nucleobases on single stranded calf thymus DNA with an arbitrary sequence (33,37). The reported results demonstrated that, while the Raman signals with respect to the four nucleobases differ remarkably, specific TER signatures could be identified for each respective base. It has been also shown that all four nucleobases could be identified in both RNA and DNA strands (38,39). In 2014, Najjar was able to read DNA of a λ-phage virus revealing vibrational modes typical of DNA nucleobases and the molecular backbone. However, reported 9 nm spatial resolution significantly limited base-by-base readout of DNA that was necessary for its sequencing (40). At the same time, the Deckert group reported spatial resolution below 1 nm in TERS sequencing of specifically designed single-stranded DNA (ssDNA) composed of adenine and cytosine (41). Lin and coworkers demonstrated that, while stepping along a strand with a TERS tip, they were able to obtain clear spectral evidence of individual nucleobases and their conformations, and reveal sharp adenine-cytosine transitions. Pashaee and coworkers investigated whether TERS could be used to distinguish plasmid-free DNA from plasmid-embedded DNA (42). It was found that plasmid-embedded DNA showed stronger TERS signals, due to the additional presence of nucleic acids from the plasmid. Using low temperature UHV-STM-TERS, Zhang and coworkers recently demonstrated that adenine and thymine bases adsorbed to Ag(III) could be resolved with 0.9 nm spatial resolution (43). Independently, Lipiec and coworkers reported that the molecular structure of terminal groups of DNA fragments could be determined using TERS. Based on these results, it has been proposed that UV-initiated DNA damage occurred via cleavage of the C=O bonds. Lipiec and associates concluded that TERS could be employed for identification of double-strand breaks of DNA that are induced by UV radiation (44).
Elucidation of structural organization of amyloid fibrils and their precursors is another hot area of TERS. Amyloid fibrils are β-sheet-rich protein aggregates that are strongly associated with various neurodegenerative diseases (45). The first evidence was reported by Deckert-Gaudig and coworkers in 2012 (35). The researchers were able to acquire a series of TERS spectra across insulin fibril surface deposited on a gold nanoplate. It was demonstrated that TERS could be used to track individual amino acids on the surface of fibrils, with up to 1.5 nm spatial resolution. Additionally, the researchers showed that TERS could be used to probe changes in protein secondary structure on the surface of insulin fibrils. In the same year, Kurouski and coworkers reported more detailed characterization of insulin fibril surfaces, captured in Figure 5 (34). The researchers collected multiple spectra from the surfaces of several insulin fibrils and were able to correlate propensity presence of certain amino acids with protein secondary structure. It was found that aromatic amino acids, such as tyrosine and phenylalanine, as well as cysteine, are much more frequently present on β-sheet clusters than on the areas dominated by a-helix and/or unordered protein. At the same time, proline, which is known to disrupt β-sheet integrity, is much more abundant in a-helix and/or unordered protein clusters.
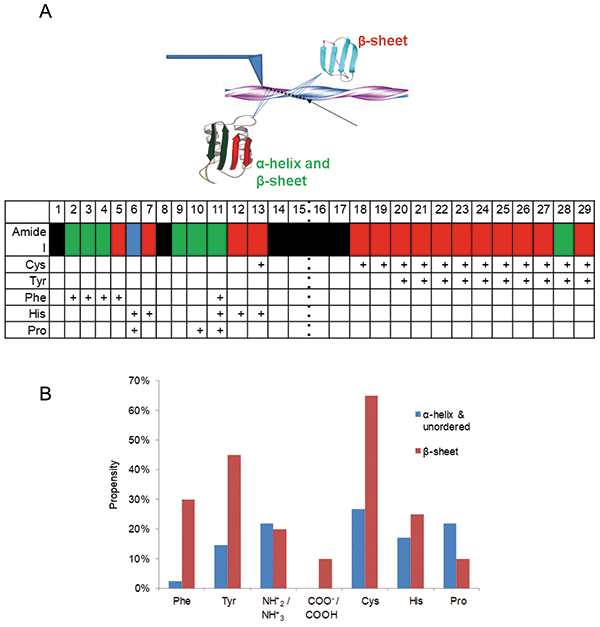
Figure 5: (a) A schematic illustration of the scan direction along insulin fibril profile (top) and graph (bottom) showing changes in the protein secondary structure (first row) and amino acid residue composition. β-sheets, α-helix/unordered, and mixed protein structures are shown in red, blue and green, respectively. TERS spectra with suppressed amide I bands are shown in black. The black dotted line indicates the center of the fibril. The presence of characteristic bands for Cys, Tyr, Phe, His and Pro in the spectrum are marked by a "+". (b) The relative propensity plot of amino acid residues for β-sheet (red) and α-helix/unordered (blue) structures on the surface of insulin fibrils.
These studies were further extended by the same research team. Deckert-Gaudig and coworkers were able to image hydrophobic and hydrophilic domains on the surface of insulin fibrils, as well as clusters of specific amino acids, such as cysteine and proline (46). Moreover, the researchers found that the surface of insulin fibrils was composed of a mixture of α-helix and unordered protein secondary structures, whereas the core of the fibrils was built exclusively by β-sheet. Independently, Bonhommeau and coworkers employed TERS to probe structural organization of Aβ1–42 fibrils, as well as two synthetic mutants forming less toxic amyloid fibrils (L34T), and highly toxic oligomers (oG37C) (47). Analysis of the amide III region of collected TER spectra was used to determine protein secondary organization of these fibril polymorphs. Bonhommeau and coworkers concluded that Aβ1–42 and L34T fibrils had a parallel β-sheet, whereas Og37C had an anti-parallel β-sheet protein secondary structure.
The Zenobi group utilized TERS to investigate an aggregation pathway of Aβ1–42 fibrils (48). Lipiec and coworkers determined spatial distribution of β-sheet and turn/random coil protein secondary structure in fibrillar species at different stages of their propagation into mature fibrils. The researchers anticipated that Aβ1–42 monomers first form metastable oligomers, which then rearrange to ordered β-sheets, already at the oligomeric or protofibrillar stage. The researchers also imaged large areas of mature Aβ1–42 fibrils showing distribution of β-sheet and turn/random coil protein secondary structure on their surface.
Morphologically different fibrils could grow from the same protein or peptide under slightly different conditions, a phenomenon known as fibril polymorphism (49,50). Fibril polymorphism could be caused by variations in monomer–monomer aggregation at the stage of protein nucleation or different association pathways of fibril filaments and proto-fibrils (51,52). Kurouski and coworkers used TERS to unravel surface organization of insulin fibril polymorphs with different topologies: tapelike and twisted fibrils (53). It has been found that surfaces of these polymorphs had distinctively different amino acid compositions and protein secondary structures. Also, for the first time, the surface of filaments, precursors of fibrils, was investigated. Comparison of amino acid propensities and protein secondary structures on the surface of the filaments with mature fibrils allowed proposing the mechanism of filaments' propagation into mature insulin fibrils for both fibril polymorphs. Krasnoslobodtsev and coworkers investigated polymorphism of amyloid fibrils formed by an eight amino acid peptide (CGNNQQNY) from the yeast prion protein Sup35 (54). It was found that fibrils that were formed at pH 5.6 were composed of a mixture of peptide conformations (β-sheets, random coil, and a-helix), whereas fibrils grown at pH~2 primarily had a β-sheet protein secondary structure. Based on the amide III band, the researchers concluded that pH 5.6 fibrils had an antiparallel β-sheet, whereas pH 2 fibrils showed a parallel arrangement of β-sheets. Sereda and Lednev reported TER analysis of individual insulin fibril, the protein cast film and a short peptide (LVEALYL) microcrystal mimicking the fibril core (55). The researchers found that TER spectral acquisition from the top of the microcrystal yielded highly reproducible TER signals, which showed high similarity to the normal Raman spectra of this microcrystal. At the same time, TER spectra collected from the edges of the same microcrystal, peptide film and fibrils prepared from LVEALYL peptide exhibited high spectral variability and low reproducibility. This difference in acquired spectra has been attributed to short-range (chemical) and long-range (physical) mechanisms for tip enhancement of Raman scattering.
Van den Akker and coworkers investigated structural organization of fibrils formed on a lipid interface using TERS (56). It was found that fibrils that were grown on the lipid interface contained lipid molecules on their surface. Using TERS, Tabatabaei and coworkers were able to image amyloid β plaques on the surface of neuronal spines, as seen in Figure 6 (57). The plaques have highly heterogeneous protein secondary structure, including disordered, a-helical, and β-sheet structures.
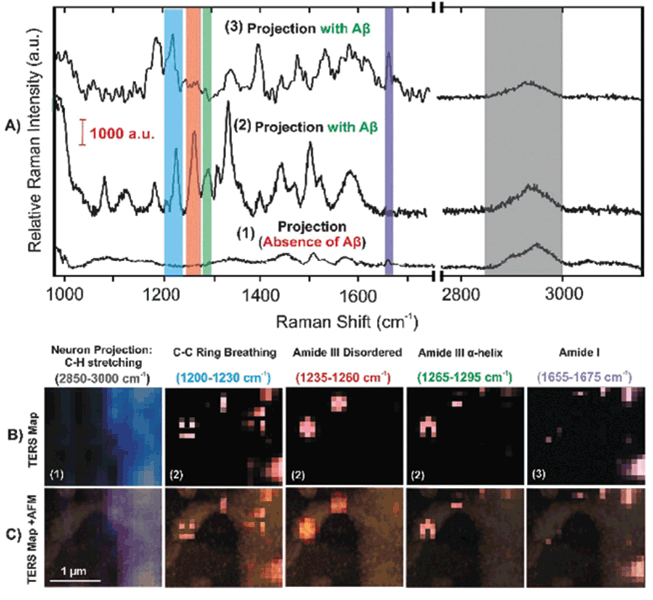
Figure 6: TER spectra and maps of Aβ at neuronal spines with representative signals: (a) TERS spectra of untreated (1) and treated (2, 3) neuronal projections with Aβ, (b) TERS maps with different spectral integrated regions as stated, and (c) the overlap of the TERS maps with the AFM morphology of a spine (57).
Several very interesting and innovative studies recently came from the Deckert and Schultz groups that significantly expanded horizons of potential of this technique in biology (58-60). Ashtikar and coworkers used TERS to probe the penetration mechanism of invasomes (liposomal system) in the stratum corneum, a primary skin barrier to percutaneous absorption (58). The researchers prepared invasomes from a head deuterated phospholipid and measured C-D TERS bands on the flattened vesicles after their application on stratum corneum. Ashtikar and coworkers were able to monitor penetration of invasomes in stratum corneum and distribution of diffused deuterated phospholipid on the surface of corneocytes. It was also shown that TERS was capable of detecting hemozoin crystals that were formed inside of red-blood cells infected by Plasmodium falciparum (61). This malaria parasite catabolizes the breakdown of erythrocyte hemoglobin into hemozoin and free hem. Both of these products of parasite metabolism are toxic to the human organism. Using TERS, Wood and coworkers were also capable of determining the oxidation state of iron ions in the hemozoin crystals that were found in the blood cells. Xiao and coworkers showed that TERS could be used to unravel chemical information about specific ligand-receptor binding sites of integrin avβ3 in a cancer cell membrane (62). The researchers were able to obtain distinct Raman signal that was observed using gold nanoparticles functionalized with three different peptide ligands. Variations within the collected TERS spectra shed light on chemical heterogeneity in the binding interaction that correlates with the diffusional motion of these particles in vitro.
Challenges and Limitations of TERS
One may note that often unambiguous interpretation of TER spectra from biological specimens is a challenging task. In addition to high structural heterogeneity and complexity of biological specimens, most of biological molecules have the same chemical groups, such as carbonyls and aliphatic and aromatic moieties (50). Therefore, detection of such a chemical group in a TER spectrum cannot be used for unambiguous assignment of this band to a certain class of macromolecules. Moreover, band assignment to a specific amino acid is often a challenging task. For instance, CH, CH2, and CH3 bands (1475 cm-1, 1457 cm-1, 1372-1377 cm-1, 1355 cm-1) can be assigned to alanine, valine, leucine, and isoleucine, as well as lipids. Therefore, it becomes nearly impossible to distinguish amino acid residues with saturated hydrocarbon side chains from each other. A vibrational band at 1144 cm-1 may be assigned to amino and imino groups, which are present in several amino acids, such as asparagine, glutamine, lysine, and arginine. Simultaneously, it can originate from N-termini of all amino acids. Carboxyl groups have two vibrational frequencies at 1400 cm-1 and 1687 cm-1. In TER spectra of protein specimens, these bands can be assigned to aspartic or glutamic acids, as well as the C-terminal amino acid of the peptide chain. Nevertheless, aromatic amino acids tyrosine, phenylalanine, and histidine have clearly defined Raman bands and therefore can be unambiguously assigned.
Silicon or silicon nitrile cantilevers commonly used in AFM-TERS obscure disulfide band vibrations (510-540 cm-1) (the Raman band of silicon is at 521 cm-1). Nevertheless, C-S vibrations of cysteines (650-690 cm-1, 750-790 cm-1, and 800 cm-1) can be clearly resolved. Based on the presence or absence of cysteine bands, valuable information about the localization of disulfide bridges on the surface of protein specimens can be obtained.
Definitive interpretation and assignment of vibrational bands associated with protein backbone is also challenging. There are three commonly recognized amide band vibrations, known as amide I, II, and III. Both amide I and amide III bands are used to interpret protein secondary structure of analyzed protein specimens (35,53,63). Amide I band (1640-1680 cm-1) assignment is relatively simple because there are no amino acid bands present in this spectral region (50,52). At the same time, assignment of vibrational bands in the amide III region (1200-1340 cm-1) to the protein chromophore may be challenging due to vibrational bands of some chemical groups (C-C ring, COH and CH2) that can also be found in this spectral window. It should be noted that TER spectra acquired from protein molecules often lack amide bands, which limits their utilization for a determination of protein secondary structure. Kurouski and coworkers proposed that such amide I "silencing" can be due to a distancing of the peptide bond from the rough metal surface of the apex of a TER tip by amino acid side chains, as seen in Figure 7 (52). However, it is very likely that other factors, which have yet to be discovered, can contribute to the amide band's suppression (64).
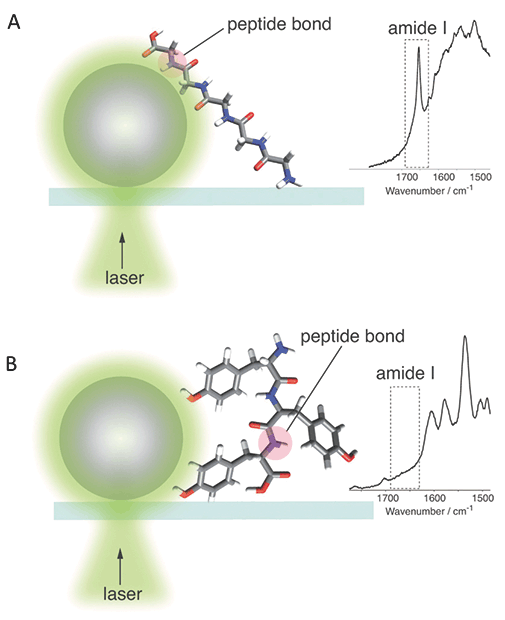
Figure 7: Graphical illustration of peptide band distancing by amino acid side chains that results in (a) presence and (b) absence of amide I band in TER and SER spectra of protein specimens.
References
(1) D.A. Long, The Raman Effect: A Unified Treatment of the Theory of Raman Scattering by Molecules (John Wiley and Sons, West Sussex, England, 2002).
(2) P.A.M. Dirac, Proc. R. Soc. A 114, 243–265 (1927).
(3) R. McCreery, Raman Spectroscopy for Chemical Analysis (Wiley, New York, 2000).
(4) R.P. Van Duyne and D.L. Jeanmaire, J. Electroanal. Chem. 84, 1–20 (1977).
(5) F.W. King, R.P. Van Duyne, and G.C. Schatz, J. Chem. Phys. 69, 4472–4481 (1978).
(6) G.C. Schatz, and R.P. Van Duyne, Surf. Sci. 101, 425–438 (1980).
(7) M. Moskovits, J. Chem. Phys. 69, 4159–4161 (1978).
(8) D. Kurouski, Vibrat. Specrosc. 91, 3–15 (2017).
(9) T. Deckert-Gaudig, A. Taguchi, S. Kawata, and V. Deckert, Chem. Soc. Rev. 46(13), 4077–4110 (2017).
(10) X. Wang, S.C. Huang, T.X. Huang, H.S. Su, J.H. Zhong, Z.C. Zeng, M.H. Li, and B. Ren, Chem. Soc. Rev. 46(13), 4020–4041 (2017).
(11) M.S. Anderson, Appl. Phys. Lett. 76(21), 3130–3132 (2000).
(12) R.M. Stöckle, Y.D. Suh, V. Deckert, and R. Zenobi, Chem. Phys. Lett. 318(1–3), 131–136 (2000).
(13) N. Hayazawa, Y. Inouye, Z. Sekkat, and S. Kawata, Opt. Commun. 183(1–4), 333–336 (2000).
(14) D. Kurouski, S. Zaleski, F. Casadio, R.P. Van Duyne, and N.C. Shah, J. Am. Chem. Soc. 136(24), 8677–8684 (2014).
(15) B. Birmingham, Z. Liege, N. Larson, W. Lu, K.T. Park, H. Lee, D.V. Voronine, M. Scully, and Z. Zhang, J. Phys. Chem. C 122(5), 2753–2760 (2018).
(16) L. Opilik, T. Bauer, T. Schmid, J. Stadler, and R. Zenobi, Phys. Chem. Chem. Phys. 13(21), 9978–9981 (2011).
(17) L. Opilik, P. Payamyar, J. Szczerbinski, A.P. Schutz, M. Servalli, T. Hungerland, A.D. Schluter, and R. Zenobi, ACS Nano 9(4), 4252–4259 (2015).
(18) D. Kurouski, M. Mattei, and R.P. Van Duyne, Nano Lett. 15(12), 7956-7962 (2015).
(19) N. Jiang, E.T. Foley, J.M. Klingsporn, M.D. Sonntag, N.A. Valley, J.A. Dieringer, T. Seideman, G.C. Schatz, M.C. Hersam, and R.P. Van Duyne, Nano Lett. 12(10), 5061–5067 (2012).
(20) R. Zhang, Y. Zhang, Z.C. Dong, S. Jiang, C. Zhang, L.G. Chen, L. Zhang, Y. Liao, J. Aizpurua, Y. Luo, J.L. Yang, and J.G. Hou, Nature 498(7452), 82–86 (2013).
(21) M. Richard-Lacroix, Y. Zhang, Z. Dong, and V. Deckert, Chem. Soc. Rev. 46(13), 3922–3944 (2017).
(22) P. Verma, Chem. Rev. 117(9), 6447–6466 (2017).
(23) J. Lee, N. Tallarida, X. Chen, P. Liu, L. Jensen, and V.A. Apkarian, ACS Nano 11(11), 11466–11474 (2017).
(24) P.J. Whiteman, J.F. Schultz, Z.D. Porach, H. Chen, and N. Jiang, J. Phys. Chem. C 122(10), 5489–5495 (2018).
(25) J.M. Klingsporn, N. Jiang, E.A. Pozzi, M.D. Sonntag, D. Chulhai, T. Seideman, L. Jensen, M.C. Hersam, and R.P. Van Duyne, J. Am. Chem. Soc. 136(10), 3881–3887 (2014).
(26) J.H. Zhong, X. Jin, L. Meng, X. Wang, H.S. Su, Z.L. Yang, C.T. Williams, and B. Ren, Nature Nanotechnol. 12(2), 132–136 (2017).
(27) N. Chiang, X. Chen, G. Goubert, D.V. Chulhai, X. Chen, E.A. Pozzi, N. Jiang, M.C. Hersam, T. Seideman, L. Jensen, and R.P. Van Duyne, Nano Lett. 16(12), 7774–7778 (2016).
(28) N. Tallarida, J. Lee, and V.A. Apkarian, ACS Nano 11(11), 11393-11401 (2017).
(29) Z.C. Zeng, S.C. Huang, D.Y. Wu, L.Y. Meng, M.H. Li, T.X. Huang, J.H. Zhong, X. Wang, Z.L. Yang, and B. Ren, J. Am. Chem. Soc. 137(37), 11928–11931 (2015).
(30) N. Martin Sabanes, T. Ohto, D. Andrienko, Y. Nagata, and K.F. Domke, Angew. Che. Int. Ed. 56(33), 9796–9801 (2017).
(31) T. Touzalin, A.L. Dauphin, S. Joiret, I.T. Lucas, and E. Maisonhaute, Phys. Chem. Chem. Phys. 18, 15510–15513 (2016).
(32) T. Touzalin, S. Joiret, E. Maisonhaute, and I.T. Lucas, Anal. Chem. 89, 8974–8980 (2017).
(33) R. Treffer, R. Bohme, T. Deckert-Gaudig, K. Lau, S. Tiede, X. Lin, and V. Deckert, Biochem. Soc. Transac. 40(4), 609–614 (2012).
(34) D. Kurouski, T. Deckert-Gaudig, V. Deckert, and I.K. Lednev, J. Am. Chem. Soc. 134(32), 13323–13329 (2012).
(35) T. Deckert-Gaudig, E. Kämmer, and V. Deckert, J. Biophotonics 5, 215–219 (2012).
(36) C. Gullekson, L. Lucas, K. Hewitt, and L. Kreplak, Biophys. J. 100(7), 1837–1845 (2011).
(37) R. Treffer and V. Deckert, Curr. Opin. Biotechnol. 21(1), 4–11 (2010).
(38) R. Treffer, X. Lin, E. Bailo, T. Deckert-Gaudig, and V. Deckert Beilst, J. Nanotechnol. 2, 628–637 (2011).
(39) A. Rasmussen and V. Deckert, J. Raman Spectrosc. 37, 311–317 (2006).
(40) S. Naijar, D. Talaga, L. Schué, Y. Coffinier, S. Szunerits, R. Boukherroub, L. Servant, V. Rodriguez, and S. Bonhommeau, J. Phys. Chem. C 118, 1174–1181 (2014).
(41) X.-M. Lin, T. Deckert-Gaudig, P. Singh, M. Siegmann, S. Kupfer, Z. Zhang, S. Grafe, and V. Deckert, arXiv 1604.06598 (2016).
(42) F. Pashaee, M. Tabatabaei, F.A. Caetano, S.S. Ferguson, and F. Lagugne-Labarthet, Analyst 141(11), 3251–3258 (2016).
(43) R. Zhang, X. Zhang, H. Wang, Y. Zhang, S. Jiang, C. Hu, Y. Zhang, Y. Luo, and Z. Dong Angew, Chem. Int. Ed. 56(20), 5561–5564 (2017).
(44) E. Lipiec, R. Sekine, J. Bielecki, W.M. Kwiatek, and B.R. Wood Angew, Chem. Int. Ed. 53(1), 169-172 (2014).
(45) T.P. Knowles, M. Vendruscolo, and C.M. Dobson, Nature Rev. 15(6), 384–396 (2014).
(46) T. Deckert-Gaudig, D. Kurouski, M.A. Hedegaard, P. Singh, I.K. Lednev, and V. Deckert, Sci. Rep. 6, 33575 (2016).
(47) S. Bonhommeau, D. Talaga, J. Hunel, C. Cullin, and S. Lecomte, Angew. Chem. Int. Ed. 56(7) 1771–1774 (2017).
(48) E. Lipiec, D. Perez-Guaita, J. Kaderli, B.R. Wood, and R. Zenobi, Angew. Chem. Int. Ed. Engl. 57(28), 8519–8524 (2018). doi.org/10.1002/anie.201803234.
(49) D. Kurouski, R.A. Lombardi, R.K. Dukor, I.K. Lednev, and L.A. Nafie, Chem. Commun. 46(38), 7154–7156 (2010).
(50) D. Kurouski, R.P. Van Duyne, and I.K. Lednev, Analyst 140(15), 4967–4980 (2015).
(51) D. Kurouski, R.K. Dukor, X. Lu, L.A. Nafie, and I.K. Lednev, Biophys. J. 103(3), 522–531 (2012).
(52) D. Kurouski, T. Postiglione, T. Deckert-Gaudig, V. Deckert, and I.K. Lednev, Analyst, 138, 1665–1673 (2013).
(53) D. Kurouski, T. Deckert-Gaudig, V. Deckert, and I.K. Lednev, Biophys. J. 106(1), 263–271 (2014).
(54) A.V. Krasnoslobodtsev, T. Deckert-Gaudig, Y. Zhang, V. Deckert, and Y.L. Lyubchenko, Ultramicroscopy 165, 26–33 (2016).
(55) V. Sereda and I.K. Lednev, Appl. Spectrosc. 71(1), 118–128 (2017).
(56) C.C. vandenAkker, T. Deckert-Gaudig, M. Schleeger, K.P. Velikov, V. Deckert, M. Bonn, and G.H. Koenderink, Small 11(33), 4131-4139 (2015).
(57) M. Tabatabaei, F.A. Caetano, F. Pashee, S.S.G. Ferguson, and F. Lagugne-Labarthet, Analyst 142(23), 4415–4421 (2017).
(58) M. Ashtikar, L. Langeluddecke, A. Fahr, and V. Deckert, Biochim. Biophys. Acta 1861(11 Pt A), 2630–2639 (2017).
(59) C. Helbing, T. Deckert-Gaudig, I. Firkowska-Boden, G. Wei, V. Deckert, and K.D. Jandt, ACS Nano 12(2), 1211–1219 (2018).
(60) L. Xiao and Z.D. Schultz, Anal. Chem. 90(1), 440–458 (2018).
(61) B.R. Wood, E. Bailo, M.A. Khiavi, L. Tilley, S. Deed, T. Deckert-Gaudig, D. McNaughton, and V. Deckert, Nano Lett. 11(5), 1868–1873 (2011).
(62) L. Xiao, K.A. Bailey, H. Wang, and Z.D. Schultz, Anal. Chem. 89(17), 9091–9099 (2017).
(63) V. Deckert, T. Deckert-Gaudig, M. Diegel, I. Gotz, L. Langeluddecke, H. Schneidewind, G. Sharma, P. Singh, P. Singh, S. Trautmann, M. Zeisberger, and Z. Zhang, Farad. Discuss. 177, 9–20 (2015).
(64) C. Blum, L. Opilik, J.M. Atkin, K. Braun, S.B. Kammer, V. Kravtsov, N. Kumar, S. Lemeshko, J.-F. Li, K. Luszcz, T. Maleki, A.J. Meixner, S. Minne, M.B. Raschke, B. Ren, J. Rogalski, D. Roy, B. Stephanidis, X. Wang, D. Zhang, J.-H. Zhong, and R. Zenobi, J. Raman. Spectrosc. 45(1), 22–31 (2014).
Dmitry Kurouski is an assistant professor in the Department of Biochemistry and Biophysics and the The Institute for Quantum Science and Engineering at Texas A&M University, College Station, Texas. Direct correspondence to: dkurouski@tamu.edu
Geographical Traceability of Millet by Mid-Infrared Spectroscopy and Feature Extraction
February 13th 2025The study developed an effective mid-infrared spectroscopic identification model, combining principal component analysis (PCA) and support vector machine (SVM), to accurately determine the geographical origin of five types of millet with a recognition accuracy of up to 99.2% for the training set and 98.3% for the prediction set.
Authenticity Identification of Panax notoginseng by Terahertz Spectroscopy Combined with LS-SVM
In this article, it is explored whether THz-TDS combined with LS-SVM can be used to effectively identify the authenticity of Panax notoginseng, a traditional Chinese medicine.