2011 Salary Survey: The Upside of Science
Survey participants report on their salaries, workload, stress levels, and job satisfaction.
As we delve into a new year, market analysts are predicting a comeback in the spectroscopy field. Our 2011 Salary Survey takes a deeper look into that forecast to see if the fortune tellers have it right on the money or if the outlook is still murky.
The meaning of the word science can be traced to the latin scientia, having knowledge. Spectroscopists go several steps further and apply their expertise to a variety of fields, and in doing so, are at the forefront of many scientific breakthroughs. Given what spectroscopists offer, one would think that jobs should be in excess for them. Indeed, for most of the last decade that has been the case; however, the economic downturn has reached its hand into all markets, including spectroscopy. Nevertheless, the spectroscopy field is on a fast track to recovery and proving that there is indeed an upside to making a career in science.
Our salary survey had 562 respondents this year, with 88% completing all the questions. Staying consistent with previous surveys, the respondents represent spectroscopists from a broad range of job sectors and locations. Here is an overview of the results we will be discussing:
- Area of employment: 61% private industry; 18% government or national laboratories; 16% academia; 5% other areas such as hospitals, nonprofits, or research institutes; and less than 1% military.
- Employment status: 91% employed full-time; 3% consultants; 2% postdoctoral researchers or graduate students; 2% employed part-time; 1% contract employees; 1% unemployed; and less than 1% temporary employees.
- Age range: 1% were 20–24; 5% were 25–29; 8% were 30-34; 9% were 35–39; 12% were 40–44; 14% were 45–49; 19% were 50–54; 16% were 55–59; 10% were 60–64; 6% were 65+.
- Gender: 75% male and 25% female.
- Education level: 38% of respondents have a doctoral degree; 23% have a master's degree; 37% have a bachelor's degree; and 2% have an associate's degree.
Salaries Continue to Soar
This year's average salary for all respondents is $84,511. This is a significant increase from last year's average salary of $80,778. Our new average is the highest reported salary thus far (see Table I).
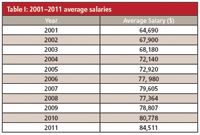
Table I: 2001â2011 average salaries
The salaries reported in this survey over the past decade have risen each year by a few thousand dollars. This year's increase was $3733, which is the largest jump since 2006, when the salary rose by $5000.
Education level and work experience are two big factors that contribute to a person's salary. As mentioned above an estimated 60% of respondents have either a doctoral or master's degree. An estimated 4% of respondents had 41 or more years of experience; 7% had 36–40 years of experience; 40% had 21–35 years of experience; 14% had 16–20 years of experience; 17% had 10–15 years of experience; 10% had 5–9 years of experience; and 8% had less than 5 years of experience. The highest percentage of our participants had doctoral degrees or 21–35 years of experience, or both; taking those factors into account it is no wonder that the average salary was on the rise this year.
Gender Wars
The salary gap between women and men continues to be an item of debate and often, controversy. Our survey respondents were 75% male and 25% female (which illustrates that women are still underrepresented in the sciences). The average salary for males is $86,000 and $76,882 for females. That salary difference of $9118 is the smallest difference we have reported. The salary gap has improved compared to last year's results, which consisted of $69,356 for women and $83,056 for men. Furthermore, women have closed the salary gap by about $4500 compared to last year's gap of $13,698. Figure 1 shows the salary gap from 2009 through 2011.

Figure 1: Salary gap between males and females.
Our results showed that 93% of women were employed full time, while only 90% of men were; 3% of men were employed part time, no women were; 1% of men and 1% of women were contract employees; 4% of men were consultants, no women were; 1% of men were postdoctoral researchers or graduate students, while 3% of women were; less than 1% of men were temporary employees and 1% of women were; finally 1% of men were unemployed and 2% of women were.
Another interesting finding based on gender was the level of experience of our male and female respondents. About 5% of males and 2% of females had 41 or more years of experience; 7% of males and 2% of females had between 36 and 40 years of experience; 45% of males and 32% of females had between 21 and 35 years of experience; 16% of males and 11% of females had between 16 and 20 years of experience; 24% of females and 15% of males had between 10 and 15 years of experience; 15% of females and 7% of males had between 5 and 9 years of experience; and 14% of females and 5% of males had less than 5 years of experience.
These statistics are important factors when examining the salary gap between men and women because it points out the differences among work experience and employment status. For example, a slightly higher number of female participants were employed full time, but the male participants had higher percentages of work experience in the 21–35, 36–40, and 41 or more ranges.
The Daily Grind (Job Sectors)
The places that spectroscopists spend their workdays fall into the three main areas: private industry, government or national laboratories, and academia. This year 61% of respondents work in private industry; 18% in government or national laboratories; 16% in academia; 5% in other areas such as hospitals, nonprofits, or research institutes; and less than 1% in the military.
The average salary for respondents in the private sector was $91,364, which is about $6500 higher than last year's average of $84,799. Respondents in this category had the following job titles: 21% were chemists or spectroscopists; 16% were senior scientists, researchers, or research fellows; 15% were laboratory directors or managers; 12% were staff scientists, researchers, or research fellows; 8% were analysts; 4% were laboratory technicians or technologists; 4% were technical directors; 2% were CEOs or presidents; 2% were research assistants/associates; 1% were process engineers; 1% were process chemists; and 14% listed "other" as their job function. Private sector participants had the following years of experience: 4% 41 or more years; 6% between 36 and 40 years; 40% between 21 and 35 years; 14% between 16 and 20 years; 20% between 10 and 15 years; 9% between 5 and 9 years; and 6% less than 5 years.
Respondents working in government or national laboratories reported an average salary of $75,515, which is only slightly higher than last year's average of $75,373. The following job titles were reported for people working in this sector: 34% were chemists or spectroscopists; 15% were analysts; 14% were senior scientists, researchers, or research fellows; 11% were staff scientists, researchers, or research fellows; 10% were laboratory directors or managers; 3% were laboratory technicians or technologists; 2% were technical directors; 2% were research assistants/associates; 1% were process engineers; 1% were associate professors; and 7% listed "other" as their job function. About 4% of respondents had 41 or more years of experience; 7% had between 36 and 40 years of experience; 41% had between 21 and 35 years of experience; 16% had between 16 and 20 years of experience; 14% had between 10 and 15 years of experience; 10% had between 5 and 9 years of experience; and 8% had less than 5 years of experience.
Respondents working in academia reported an average salary of $70,121 — a $4000 increase from last year's average. Six percent of academic respondents had 41 or more years of experience; 3% had between 36 and 40 years of experience; 44% had between 21 and 35 years of experience; 13% had between 16 and 20 years of experience; 8% had between 10 and 15 years of experience; 12% had between 5 and 9 years of experience; and 14% had less than 5 years of experience. Respondents' job functions consisted of 37% full professor; 11% associate professor; 11% staff scientist, researcher, or research fellow; 10% laboratory director or manager; 9% assistant professor; 6% research assistant or associate; 2% chemist or spectroscopist; 2% senior scientists, researcher, or research assistant; 2% laboratory technician or technologist, and 10% other.
Figure 2 illustrates the average salaries we have reported from 2009 through 2011. The trend for salaries to increase slightly is evidenced throughout the years and offers a bright outlook for next year.

Figure 2: Salary summary by job sector, 2009â2011.
All Work and No Play
The proverb "All work and no play makes Jack a dull boy," should strike a chord with many of our readers as workloads continued to rise this year and stress levels remained stagnant for many respondents. Despite these stats, our respondents also reported an increased level of job satisfaction. Let's take a closer look at the findings.
According to our survey, 65% of respondents reported an increase in workload within the past year; 29% said their workloads remained the same; and 5% reported a decrease in their workloads (1% responded with "not applicable"). Respondents were given several choices as possible causes for increased workloads, with the option to select as many as applied: 57% selected an increase in business; 54% selected staffing cuts; 30% selected new equipment in the lab; 26% selected new handling techniques or procedures; and 26% selected new regulations. Respondents were given several choices as possible causes for decreased workloads, with the option to select as many as applied: 25% selected more automation through new equipment; 24% selected new technology increased productivity or quality; 25% selected improved workplace attitudes; 13% selected increased staffing; 13% selected continuing education; and 13% selected specialization of lab personnel.
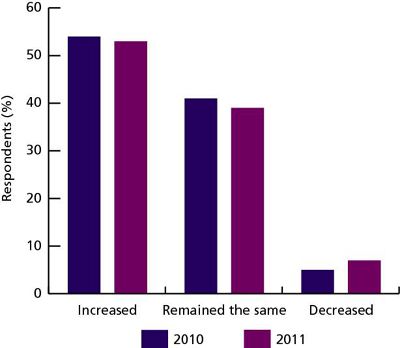
Fifty-three percent of respondents reported an increase in stress level at work; 39% reported their stress levels remained the same; and 7% reported a decrease in stress level (1% replied "not applicable"). Figure 3 shows the results from this year compared to 2010. Respondents were given several choices as possible causes for increased stress levels, with the option to select as many as applied: 53% selected staff management uncertainty; 48% selected negative workplace attitudes; 42% selected business uncertainty; 29% selected inter-department conflicts; 20% selected lack of training and continuing education; 19% selected more-stringent procedures; 10% selected foreign competition; 10% selected the requirement to publish; and 7% said they cannot keep up with technological advances. Respondents were also given several choices as possible causes for decreased stress levels, with the option to select as many as applied: 50% selected improved workplace attitudes; 27% selected new technology increased productivity or quality; 23% selected increased staffing; 23% selected continuing education; 19% selected more automation through new equipment; and 19% selected specialization of lab personnel.
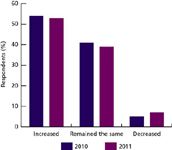
Figure 3: Stress levels, 2010â2011 (1% responded not applicable in 2011).
In spite of increased workloads and stress levels, our respondents continued to feel satisfied with their current positions: 40% report feeling satisfied; 33% feel very satisfied; 11% feel extremely satisfied; 13% are not satisfied; and 3% are not satisfied at all. Figure 4 shows this year's results.
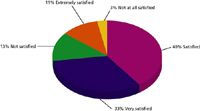
Figure 4: Job satisfaction levels, 2011.
Following suit, 42% of respondents felt satisfied with their current employer; 22% felt very satisfied; 13% felt extremely satisfied; 19% were not satisfied; and 4% were not at all satisfied. Respondents were allowed to write in their own reasons for feeling satisfied with their employers; here are some common responses: ethical company; stable or good working environment; good benefits; good colleagues; interesting work; and good opportunities. Respondents were also allowed to write in reasons why they do not feel satisfied with their employers, common responses included: unethical; no advancement or training opportunities; low salary; no leadership or planning; job uncertainty; and poor benefits.
The Career Food chain
Given that 77% of repondents are satisfied, very satisfied, or extremely satisfied with their jobs, is is not surprising that most plan to stay put: 58% are not considering making a job change within the next year; 21% are considering making a job change; and 21% are unsure. Of the respondents that would like to make a job change, the majority cited professional advancement as the incentive. Other reasons included income, job environment, intellectual challenge, geographic location, and job security.
Career advancement is a high priority for many people and knowing which moves to make when is a key component to success. Figuring this out can often be a challenge, as demonstrated by our respondents, 34% of whom don't know or are not sure what the next step in their careers are. Many of our respondents are ready to take a step back from their busy work lives, as evidenced by 27% selecting retirement as their next career step. Other respondents selected specific career steps: 22% chose lab director or manager as their next move; 6% selected consultant; 5% selected company executive; 3% selected associate professor; 2% selected full professor; and 1% selected assistant professor.
Following a certain timeframe is another crucial aspect of career advancement. Our respondents have a firm grasp on this, with 27% projecting that they will wait more than 5 years before making their next move and another 27% projecting between one and two years. Seventeen percent expect to change jobs in two or three years; 10% projected less than a year; 10% projected between four and five years; and 9% projected between three and four years. When asked what was needed to make their next move, respondents wrote in answers such as more education, management experience, more instruments, publishing more research, and a better economic climate. Along a similar line, when asked how the economy and job market would affect their next career move, the majority of respondents said that it would have a negative effect or slow down the process.
Working with a company that values its employees and wants to see them grow from within can be hard to find, but it seems like many of our readers have found such employers. In our survey, 47% of respondents said that their companies were supportive of career advancement; 18% said their companies were very supportive; 6% said their companies were extremely supportive; whereas 22% said their companies were not supportive; and 7% said their companies were not supportive at all. These numbers have varied slightly since last year, but the percentage of companies that are supportive of career advancement has continued to rise.
A key way that companies support employees is by offering training. According to our survey respondents, 61% of company's offer training. The programs of those that do offer training include training courses, seminars, and tuition reimbursement. Our respondents also reported that 78% of companies cover the cost of conferences or web seminars.
Career paths can change drastically over the course of a person's work life and spectroscopists have a variety of options to choose from. Our survey respondents are just a small glimpse into this field, but they are a good representation of the dynamic between worker and employer.
The Emerging Southwest
Finally, we asked our survey respondents to tell us which region of the country they hail from. This year, 24% of respondents were from the Midwest; 22% were from the Northeast; 19% were from the Southeast; 19% were from the Southwest; 12% were from outside the United States; and 4% were from the Northwest. We took a closer look at these data and broke them down by salary in each region (Figure 5). The Southwest had an average salary of $101,023, a large increase from last year's average of $94,496. This places the Southwest in the top spot once again this year. Education levels offer some insight into the increase, but not as much as in previous years: 39% of respondents in that region have bachelor's degrees; 38% have doctoral degrees; and 23% have master's degrees. The focus of those degrees was 56% chemistry; 17% physics; 9% biochemistry or biophysics; 9% biology; 5% environmental engineering or science; and 4% chemical engineering.
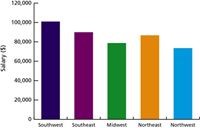
Figure 5: Salary summary by geographical region, 2011. (Southwest: CA, HI, AZ, NM, NV, CO, UT, OK, TX; Southeast: LA, MS, AL, GA, FL, TN, KY, NC, SC, AR, DE, VA, WV, MD, DC; Midwest: OH, IN, IL, IA, MO, MI, MN, WI, KS, ND, SD, NE; Northeast: NY, MA, CT, PA, VT, NH, RI, ME, NJ; Northwest: OR, WA, ID, MT, WY, AK.)
The Southeast reported a large increase in salary since last year with an average of $89,775. This is a $12,000 increase from 2010's average salary of $77,021 and bumps the region from fourth to second place. These respondents' highest degree of education was 37% doctoral degrees; 35% bachelor's degrees; 24% master's degrees; and 4% associate degrees. The majority of respondents got their degrees in chemistry (68%); 15% received degrees in biology; 7% received degrees in biochemistry or biophysics; 5% received degrees in environmental engineering or science; 2% received degrees in geology or earth science; 2% received degrees in physics; and 1% received degrees in chemical engineering.
Remaining in third place once again this year is the Midwest, with an average salary of $78,777, an increase of about a $1700 from last year's average of $77,080. Respondents in this region reported the following education levels: 43% have bachelor's degrees; 37% have doctoral degrees; 19% have master's degrees; and 2% have associate degrees. The areas that these degrees focus on are 67% chemistry; 8% biology; 6% biochemistry or biophysics; 6% physics; 5% polymer science; 4% environmental engineering or science; 3% pharmaceutical science; 1% chemical engineering; and 1% geology or earth science.
The Northeast reported a decrease in salary compared to last year, with an average of $86,774. The Northeast fell from second place (2010) to fourth place this year. This average is close to 2009's results, which boasted an average salary of $85,593 — the highest salary by region that year. The education levels for this group consisted of 38% doctoral degrees; 33% bachelor's degrees; 25% master's degrees; and 4% associate degrees. Degrees were mainly received in chemistry (69%); biochemistry or biophysics (11%); biology (11%); physics (4%); chemical engineering (1%); geology or earth science (1%); polymer science (1%); pharmaceutical science (1%); and environmental engineering or science (1%).
The average salary in the Northwest was $73,380 this year, which is almost a $5000 increase compared to last year's average of $68,406. The majority of participants in this region selected bachelor's degrees as their highest level of education (50%); 22% selected master's degrees; 22% selected doctoral degrees; and 6% selected associate degrees. The focus of those degrees was 71% chemistry; 12% biochemistry or biophysics; 12% biology; and 5% geology or earth science.
Methodology
The staff of Spectroscopy designed the 2011 Spectroscopy Salary Survey and adminstered it using an online survey tool. A link for the online survey was sent to the entire circulation. The invitation was successfully sent to 26,318 subscribers. A total of 562 individuals responded. The field time for the survey was December 14, 2010 through February 14, 2011 (a reminder email was sent). To encourage participation, subscribers who responded to the survey were entered into a drawing to win one of five $100 gift cards.
LIBS Illuminates the Hidden Health Risks of Indoor Welding and Soldering
April 23rd 2025A new dual-spectroscopy approach reveals real-time pollution threats in indoor workspaces. Chinese researchers have pioneered the use of laser-induced breakdown spectroscopy (LIBS) and aerosol mass spectrometry to uncover and monitor harmful heavy metal and dust emissions from soldering and welding in real-time. These complementary tools offer a fast, accurate means to evaluate air quality threats in industrial and indoor environments—where people spend most of their time.
NIR Spectroscopy Explored as Sustainable Approach to Detecting Bovine Mastitis
April 23rd 2025A new study published in Applied Food Research demonstrates that near-infrared spectroscopy (NIRS) can effectively detect subclinical bovine mastitis in milk, offering a fast, non-invasive method to guide targeted antibiotic treatment and support sustainable dairy practices.
Smarter Sensors, Cleaner Earth Using AI and IoT for Pollution Monitoring
April 22nd 2025A global research team has detailed how smart sensors, artificial intelligence (AI), machine learning, and Internet of Things (IoT) technologies are transforming the detection and management of environmental pollutants. Their comprehensive review highlights how spectroscopy and sensor networks are now key tools in real-time pollution tracking.