2017 Salary Survey: The Right Direction?
Spectroscopy
Analysis of Spectroscopy’s annual reader survey on salary, workload, job satisfaction, and the job market in general. The latest Spectroscopy salary survey shows that the average salary has increased slightly but is this a cause for celebration or is stagnation still rampant?
We present our analysis of Spectroscopy’s annual reader survey on salary, workload, job satisfaction, and the job market in general. This year’s salary survey shows that the average salary has increased slightly. Is this a sign that things are going in the right direction?
It’s alive! Following the previous two years’ slump, our results from this year’s survey indicate that the average salary for spectroscopists across the entire market has increased by 2.7% (Table I). The 2017 average of $84,718 is still lower, however, than average salaries seen in 2013 and 2014, which were in the region of $88,000 and the highest results attained this decade. Yet compared to the previous decade, spectroscopists’ salaries have, in general, increased. Whether they have kept up with increases in costs of living and inflation is another matter.

If we delve into the data more closely, we can see where the gains have originated. Breaking down the data by gender, sector, education, and age (Table II), male averages have increased from last year by 4% to $90,781, whereas the female average is almost identical to last year. The data for specific sectors suggest the salary gains were primarily because of increases in salaries for those working in industry (up 2.7%) and government (up 3.4%) with those in academia witnessing virtually no change from 2016. Education level appears to be the biggest differentiator; those with a PhD saw a significant increase from last year (26%) and those with a master’s degree showed a good increase as well (5.0%). Salaries for those whose highest level of education is a bachelor’s degree continue to show weakness, with another minor decrease in 2017 continuing a downward trend, dropping significantly from an average of $81,777 in 2013 to $67,361 in 2017 (–17.6%). This trend could be indicative of a surfeit of graduates with master’s degrees or doctorates limiting job opportunities for those with less education, or perhaps could be related to increasing levels of automation as companies seek ways to cut costs.
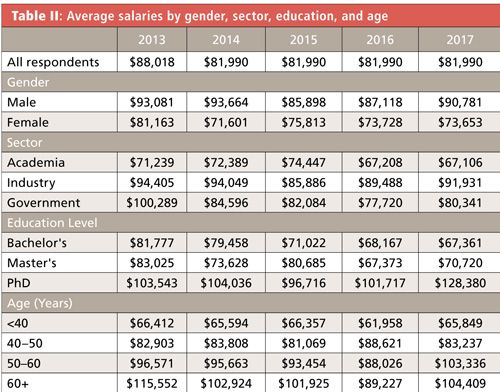
Results based on age have returned to the status quo, with last year’s unusual salary clustering for workers over 40 giving way to a steadied increase for older spectroscopists. Salaries for those younger than 40 returned to an average of $65,849 following a 2016 slip. The reverse happened in the age group of 40–50: Following an increase in 2016 to $88,621, the average salary for this group fell to $83,237 (–6.1%), about the level of the 2013–2015 average. We see good news for spectroscopists above the age of 50, who have shown a dramatic recovery following 2016, with averages above the $100,000 mark after languishing just beneath the $90,000 barrier last year. A look back to results from 2013–2015 suggests that the 2016 drop in the over 40 age ranges in 2016 was just a blip.
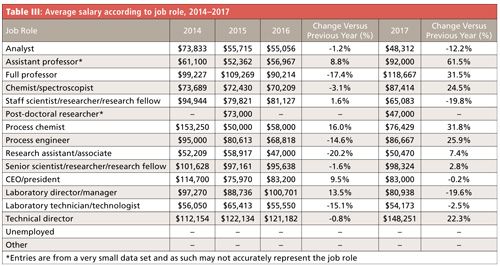
This year’s data for salaries by job role (Table III) make for interesting reading, with the fourth year of data in this area starting to flesh out the picture of how much spectroscopists can expect to be paid for specific types of jobs. Following last year’s drop, analysts suffered a further reduction to $48,312, joining staff scientists/researchers/research fellows (–19.8%) and laboratory directors/managers (–19.6%) as 2017’s biggest losers. As for this year’s winners, full professors had a return to the $100,000 plus category, a 31.5% increase on 2016’s dismal result. Chemists/spectroscopists showed an increase of 24.5%, as did research assistants/associates, who returned to having an average salary above $50,000, an increase of 7.4% over 2016. Other groups showed increases, including process chemists (up 31.8% to $76,429), process engineers (up 25.9%), and technical directors (up 22.3%), but these numbers result from the small sample sizes and thus may not be representative.
Call Me Overworked
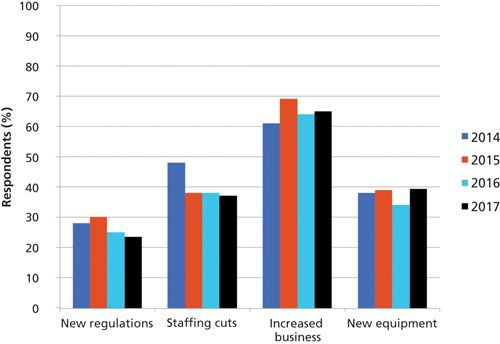
How we perceive workloads can vary, but most spectroscopists seem to feel overworked, according to our survey. Almost 64% of respondents indicated that their workloads increased this year, compared to 28% who said their workload stayed the same and almost 8% who said their workload decreased. Those figures are remarkably similar to those from 2016, as are the reasons (Figure 1): Increased business is again the most common cause of increased workloads, with new equipment and staffing cuts closely behind. Interestingly, for three consecutive years, fewer and fewer people have cited “new regulations” as a cause of workload increases.
Figure 1: Reasons for respondents' increased workload 2014–2017.
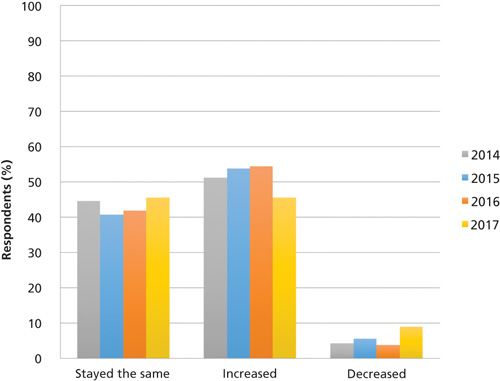
Despite increased workloads, we are happy to report a higher percentage of spectroscopists reporting a reduction in stress levels (Figure 2), with 9% of respondents reporting that their stress levels had decreased over the past year. Unfortunately, this group is still in the minority, and the remaining respondents were split down the middle, with half claiming their stress levels had either stayed the same or increased over the past year.
Figure 2: Change in stress levels of respondents 2014–2017.
Workloads and stress aside, spectroscopists are overall a satisfied bunch, as an overwhelming 76% (Figure 3) indicated they are either satisfied and highly satisfied with their jobs-a 2% increase from 2016. High job satisfaction, combined with 64% of respondents saying that they receive fair monetary recognition (Figure 4), results in 71% of respondents planning to stay in their jobs for the near future. The reasons for staying vary quite considerably, but by far the two most important factors are convenient job location, which 61% of respondents highlighted as a reason for staying, and good colleagues, which 63% of respondents picked out. The lack of potential jobs in the geographic area was another popular cause for job stasis, with 43% of respondents citing it as a reason for staying put. Having a good manager was selected by 28%. Yet there is room for improvement: One area in which managers could improve is in nonmonetary recognition of their employees, with 45.5% of respondents indicating that they believe they do not receive fair recognition for the work they do (Figure 4).
Figure 3: Percentage of respondents satisfied with their careers.

Alternatively, those seeking to leave their current employment (28.8%) highlighted a higher salary as the biggest motivator (57%), followed closely by a general dissatisfaction with their employer (48%) and looking for a new challenge (45%). The full set of reasons for seeking a new job appears in Table IV.

Germanely Positioned Spectroscopists (GPS)
Location matters. It affects everything from cost of living to standard of living, to comfort and emotional wellbeing. But in a modern economy, location also dramatically affects your earning potential, as this year’s survey confirms (Table V).

For the third consecutive year, the Northeast has suffered a decrease in average salary (–13.3%), going from the highest-paid region to the second lowest, with only the Midwest having a lower average salary ($80,195) despite a 0.8% increase. From a high of last year, the Southwest has seen a minor dip down to $90,569 (–9.8%) but is still showing good figures, considering that the region had previously been subjected to several years of decreases. The biggest change came in the Southeast, which had a 33.3% increase in average salary, making it this year’s highest paid region. Last but not least, the Northwest maintained a steady increase (1.5%) landing it right in the middle of all the regions.
Women’s Salaries
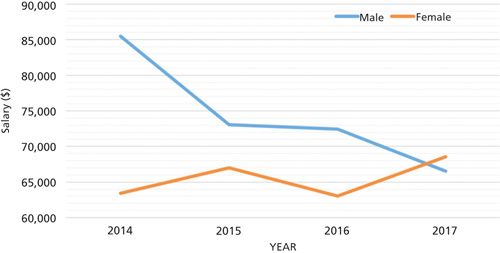
When it comes to salary, women have historically gotten the short end of the stick (Table VI). They consistently earn less regardless of education level, employer type, and whether they are in a management position or not. This year’s survey continues that trend but perhaps hints at impending parity-though not in the way most would have hoped. For the first time in this survey’s history, women with a bachelor’s degree have out-earned their male counterparts, with an average salary of $68,507 compared to $66,473 for men in that group-a difference of 3.1%. But it is how we got to that point that is alarming. The data in Table VI suggest that rather than wages of women being brought up to the same level as men, men’s wages have been brought down to the same level as those of women.
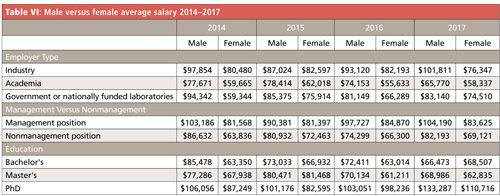
Women with PhDs broke the $100,000 average salary mark for the first time, but salaries for those with PhDs were unusually high across the board this year, with male PhD salaries 29% higher than the data from 2016. The data set is no smaller than in previous years, but these big jumps make us cautious about coming to significant conclusions about changes in this portion of the market.
A Look at Discrimination
While our survey has long analyzed the gender gap in terms of salary, this year our survey took a deeper look at whether our respondents have experienced various forms of discrimination in their work.
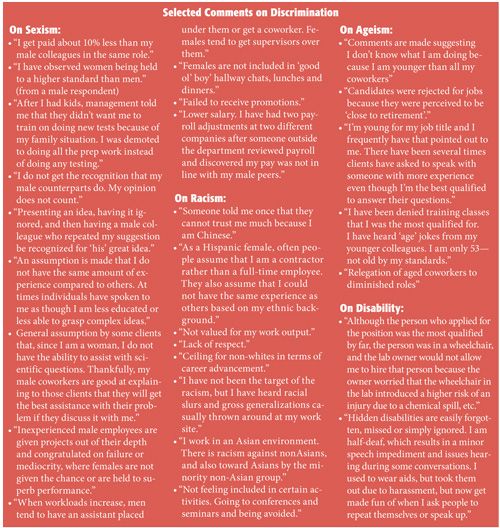
The first issue our survey tackled was sexism, and 62.8% of women surveyed and 13.5% of men surveyed indicated they had experienced sexism in some form. Given the opportunity to expand on this, many comments followed patterns: women not being taken seriously or having their opinions dismissed, being talked over or down to at meetings, men taking credit for their ideas or work, women being held to a higher standard, assumptions both internally and by clients that women are not or do not belong in technical roles, demeaning comments, perceived inferiority in knowledge, consistent lack of promotion of women, men being paid more than women, and women being excluded from the boy’s clubs (intentionally and unintentionally).
One subject that we singled out was the effect of raising children on careers. For one respondent, this was a challenge. “I strongly feel that I cannot give the same to a job that my male counterparts can. I have children and their day affects mine-and not just sick days and pick up times,” she said. “I find I am distracted thinking about how to get in soccer practice, or how to get a healthy meal on the table.” Her solution was to cut back to 30 hours, which her employer allowed. Many respondents indicated their workplaces are trying to address these concerns for parents-both women and men. The scheme has worked for our respondent, even if sometimes she has to finish work late at night while the kids sleep. But there are still issues. “I still feel that I am looked down on for not working full time and the men all concluded that my career is not important to me, which is not true.” This is an example of the challenges faced by millions worldwide-women and men.
The next issue we tackled was racism, and 10.8% of respondents indicated they had experienced racism in some form. Specific concerns described varied, and included concerns such as a general lack of respect, lack of promotion, casual racist slurs, gross generalizations, and the outright admission of prejudices by coworkers. Society rightly judges those who believe in racial superiority very harshly and as our survey indicates while in the minority, these beliefs persist even in our own profession.
Ageism consistently comes up when spectroscopists are asked about changing jobs. Older spectroscopists worry about being overlooked in favor of someone younger who has more years ahead and lower salary demands. Younger scientists fear having their ideas dismissed and their abilities demeaned. Ageism was the second most common form of discrimination identified, with 25.6% of respondents indicating they had experienced it in some form. Of those respondents who experienced ageism, 22.8% believed it had affected their career greatly, 36.8% believed it had affected their career somewhat, and 38.6% believed it had not affected their career. A few comments we received about ageism appear in the box on page 38.
Figure 5: Male versus female salary when educated to bachelor's level.
We also asked about discrimination based on disabilities, and 4% of respondents indicated they had experienced this type of discrimination. Responses highlighted the difficulties faced by those who are physically disabled (temporarily or permanently) when elevators are not available, but also touched on hidden disabilities. Partial deafness and weakening caused by age-related problems can affect people greatly around the workplace; color blindness in men was also mentioned, which in a laboratory setting it may require forethought. With color blindness affecting 1 in 12 men and 1 in 200 women, it is one of the few issues of discrimination that primarily affects males.
Conclusion
Overall, increases in salary this year reversed a two-year slump in wage growth, with some positive indications that there is stability across the market. But with wages not significantly increasing at all this decade, spectroscopists are likely to feel the pinch from increasing living costs. Once again, our results indicated that stopping one’s education at a bachelor’s level is a risky proposition for future earning potential, as experience continues to correlate with higher salaries.
Stress and workloads are on the rise, but not to the same extent as previous years, and job satisfaction remains high. In the US, the Northeast suffered its third year of successive salary decreases, while the Southeast continued to expand.
The discrimination section of this year’s survey offered a snapshot of the problems still faced by spectroscopists in the workplace, offering a reminder that there is still a long way to go in many areas.
Lewis Botcherby is an associate editor for LCGCEurope, a sister publication to Spectroscopy. Direct correspondence to lewis.botcherby@ubm.com.

AI Boosts SERS for Next Generation Biomedical Breakthroughs
July 2nd 2025Researchers from Shanghai Jiao Tong University are harnessing artificial intelligence to elevate surface-enhanced Raman spectroscopy (SERS) for highly sensitive, multiplexed biomedical analysis, enabling faster diagnostics, imaging, and personalized treatments.
Machine Learning and Optical Spectroscopy Advance CNS Tumor Diagnostics
July 1st 2025A new review article highlights how researchers in Moscow are integrating machine learning with optical spectroscopy techniques to enhance real-time diagnosis and surgical precision in central nervous system tumor treatment.