A Different Kind of Art Analysis
Using Raman spectroscopy and X-ray fluorescence (XRF) to examine the paint on the floor of Jackson Pollock’s studio reveals a list of pigments—published here for the first time—that could be used to verify the authenticity of the abstract expressionist’s paintings.
Jackson Pollock is considered one of the preeminent artists of the 20th century, and perhaps the most important U.S.-born painter. A pioneer in modern art, Pollock used controlled deposition of paint to canvas or masonite to achieve a beautiful effect—one that many have tried to copy. In fact, Pollock has been one of the most plagiarized modern artists, which makes proper authentication important and tricky.
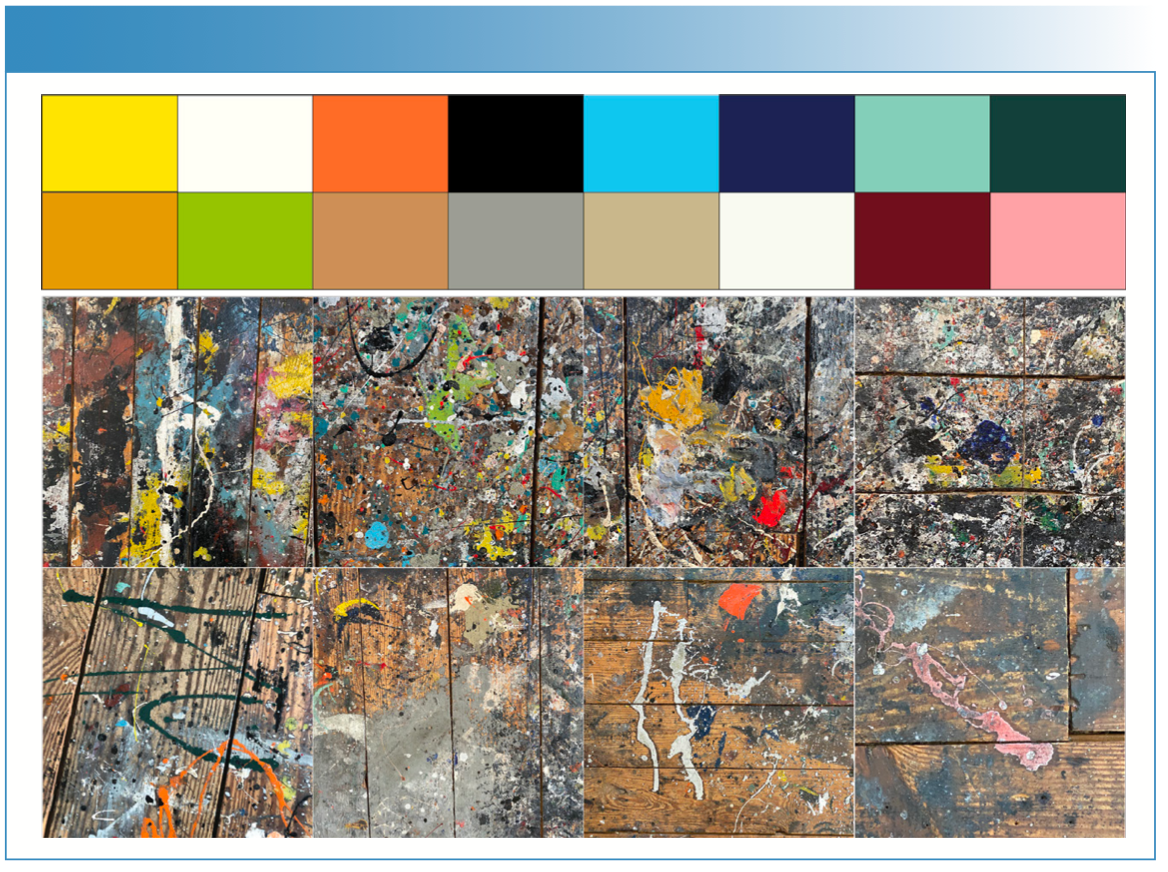
Provenance is key to validating an object as authentic, but scientific analysis is also of great importance. There have been several manuscripts describing the analysis of known Pollock paintings, but few encompassing the most common pigments he used. Recently, we had the opportunity to use an integrated analytical approach to investigate paints on the floor of Pollock’s studio, located at Pollock-Krasner House in East Hampton, New York. As Figure 1 shows, the remnants of paint from Pollock’s many projects remain on the studio floor, and they are ripe for scientific analysis using portable and noninvasive spectroscopic techniques, such as Raman and X-ray fluorescence (XRF). It is almost certain that Pollock created paintings with pigments now present on the studio floor, meaning that they can be used as a reference to help determine the authenticity of any future unknown works. To facilitate future comparisons, a color palette has been provided in Figure 2. The top images in Figure 2 show the isolated colors that have been digitally matched to the actual paint deposited on the workshop floor (shown in the lower portion of Figure 2).
FIGURE 1: (a) Picture of the Pollock-Krasner House museum workshop, located on Long Island, NY, and (b) the interior of the workshop showing the area where Jackson Pollock created many of his paintings.
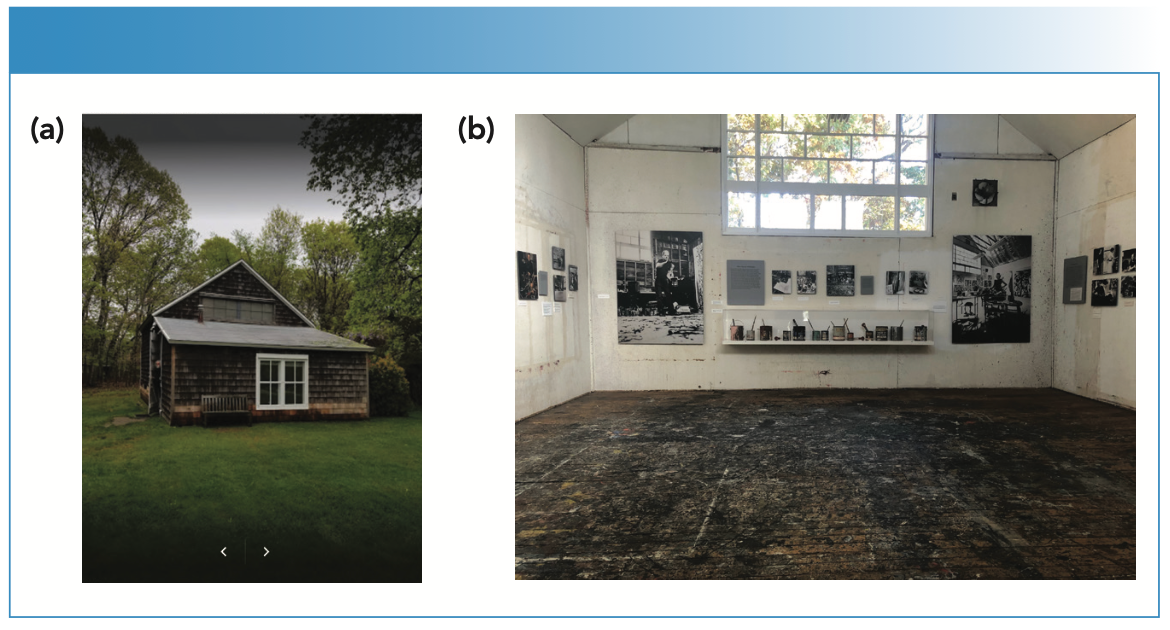
FIGURE 2: Pigment palette, from upper left to lower right: yellow, white, orange, black, museum gray-blue, dark blue, Midas blue-green, hunter green, mustard-color, lime green, brown, slate gray, dingy gray, aluminum/silver-colored, dark red, and pink. Accompanying images show in situ examples of paints at different locations on the barn floor.
Beneath a Masterpiece
Each area of paint was analyzed by using a Raman spectrometer (Bravo, Bruker) and a handheld XRF instrument (XRF, Tracer 5g, Bruker). The Raman spectrometer used two excitation laser sources (785 and 852 nm) to minimize fluorescence interference, and each laser was actively controlled to shift the emission wavelength to further allow for the removal of any fluorescence interference. Finally, a concave baseline correction was used to remove any residual fluorescence. Acceptable Raman data could be collected on all but the brown pigment.
The handheld XRF spectrometer was equipped with a 4 W Rh X-ray tube, and an energy dispersive spectrometer with a graphene window, allowing a higher transmission of low-energy X-rays. Measurements of each paint target were conducted using three excitation settings—15 kV, 30 kV, and 50 kV—to enhance the elemental resolution in different parts of the energy spectrum. We present only the 30 kV spectra to simplify comparisons. All spectra were collected for 30 s using a collimated spot size of 8 mm.
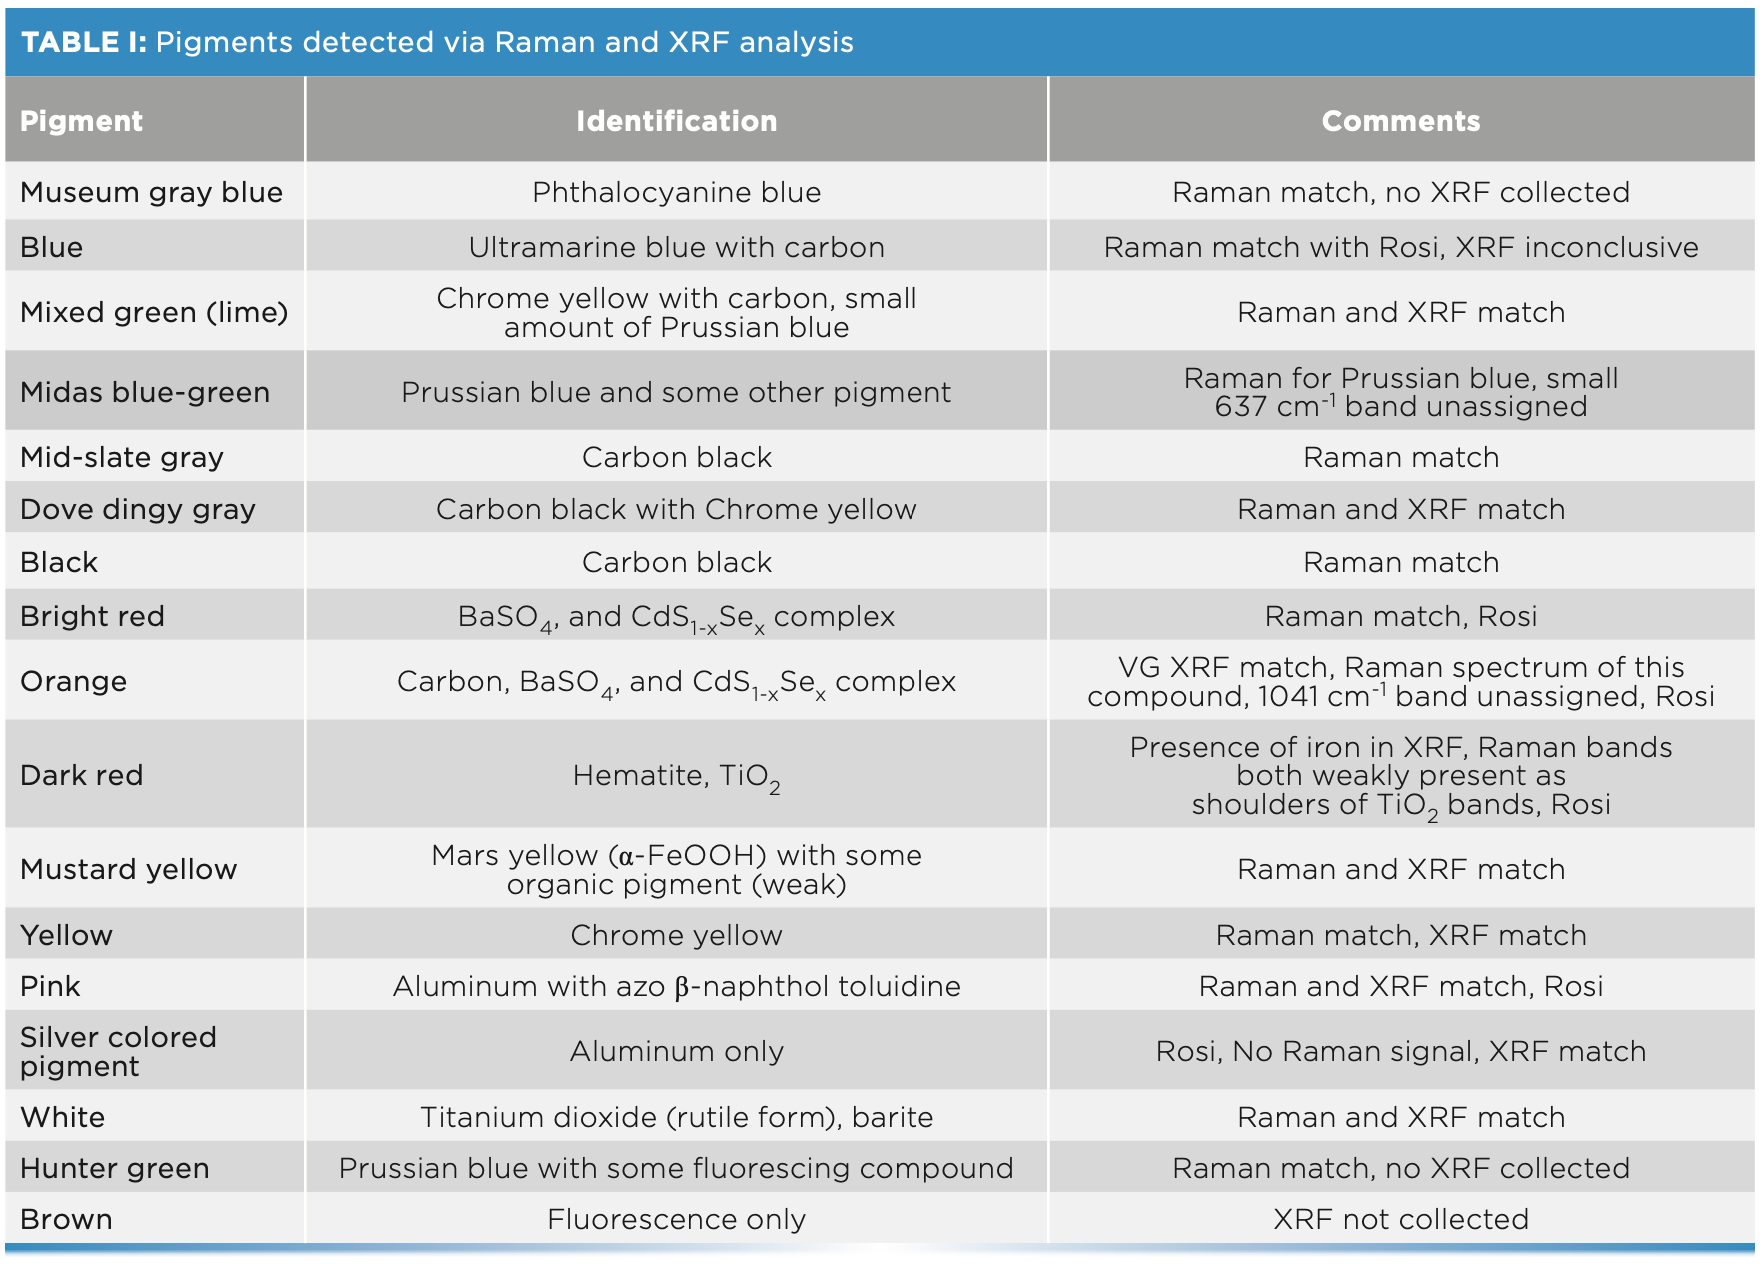
It is worth noting that Raman is a surface technique in this case; the paint is strongly absorbing, which significantly reduces the depth of penetration. However, the primary X-ray beam penetrates to greater depths, with the detected XRF signal including surface species of interest along with contributions from any underlying paint. Table I gives an overview of the pigments we detected. We identified the pigments using the established literature. The Raman data shown was not manipulated or corrected in any way to facilitate the comparison to data collected from other Pollock paintings.
Blue and Green Pigments
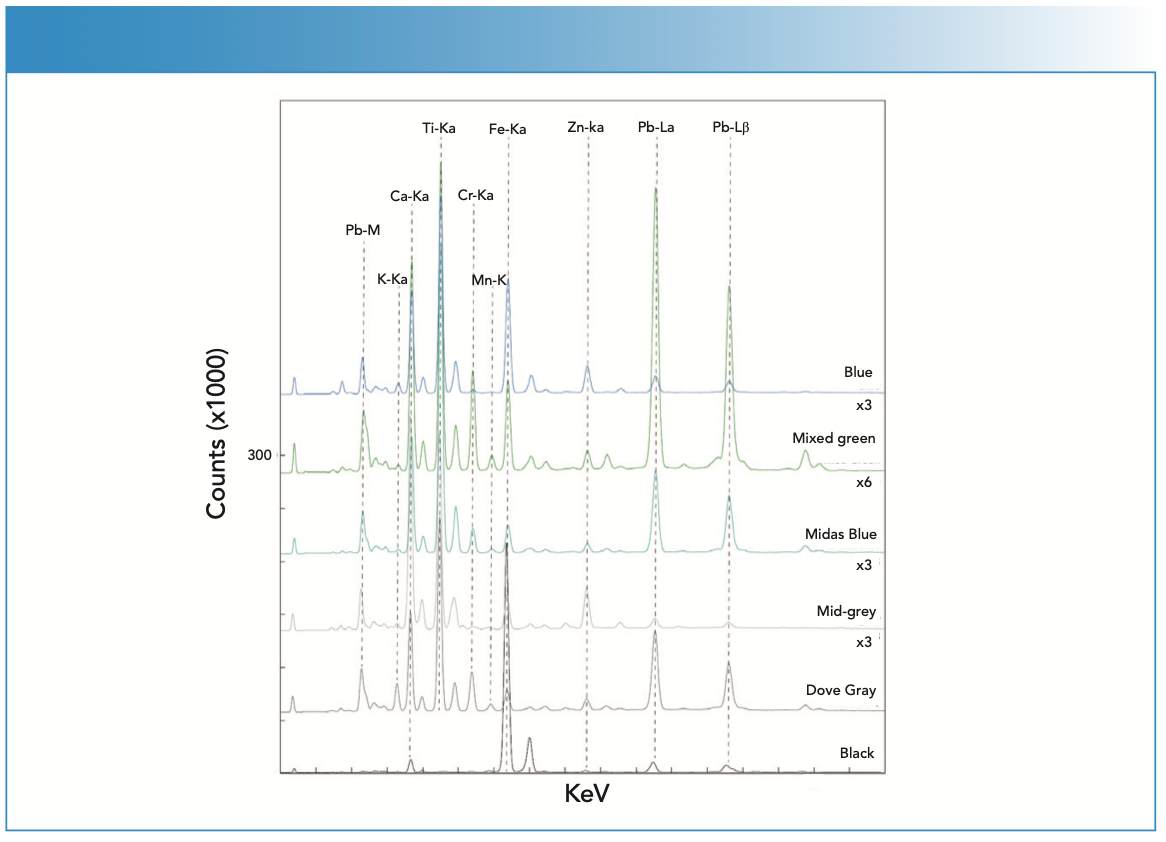
There were three blue colored paints found on the floor—museum gray-blue, deep blue, and Midas blue-green. The Raman and XRF spectra collected from these paints are shown in Figures 3 and 4, respectively. Raman analysis of the museum gray-blue showed the conclusive presence of phthalocyanine blue, which matched the recorded spectrum of the known reference for this pigment (1). The Raman spectrum from the dark blue paint was interpreted to contain ultramarine (2); the presence of amorphous carbon was also detected. The spectrum from Midas blue-green indicated the presence of Prussian blue (2) and some other highly fluorescing compound. There was a band at 637 cm-1 that could not be assigned (there were several possible compounds that have Raman peaks in this area). The XRF results showed prominent peaks at titanium, calcium, and lead, possibly from various underlying white paint layers or mixtures with Prussian blue. The mixed or lime green paint spectra has characteristic Raman bands for carbon black and chrome yellow. The XRF spectrum indicates the presence of chromium, along with lead, barium, and calcium, which may be mixtures with or underlying the lime-green paint. The hunter green paint Raman spectrum also exhibits significant fluorescence, but the two-band signature for Prussian blue was weakly present compared to the Raman spectrum, which was very similar to that collected on Midas blue (not shown). No XRF spectrum was collected from this pigment.
Mid-Gray (Slate) and Dove (Dingy) Gray Pigments
This mid-gray pigment was interpreted to contain carbon black, as shown by the Raman spectrum (2). The XRF spectrum indicates the presence of titanium, barium, and sulfur, suggesting one or more white paints mixed with a carbon-based black paint. The dingy gray paint was found to contain chrome yellow mixed with black (1). The Raman spectrum has bands indicative of carbon black and chrome yellow (Figure 3). Chromium is also present in the XRF spectrum (Figure 4). The presence of titanium and lead further indicated mixing with titanium white and lead white pigments.
FIGURE 3: The uncorrected or unaltered Raman spectra collected from the blue, green, gray, and black pigments found on the Pollock workshop floor.
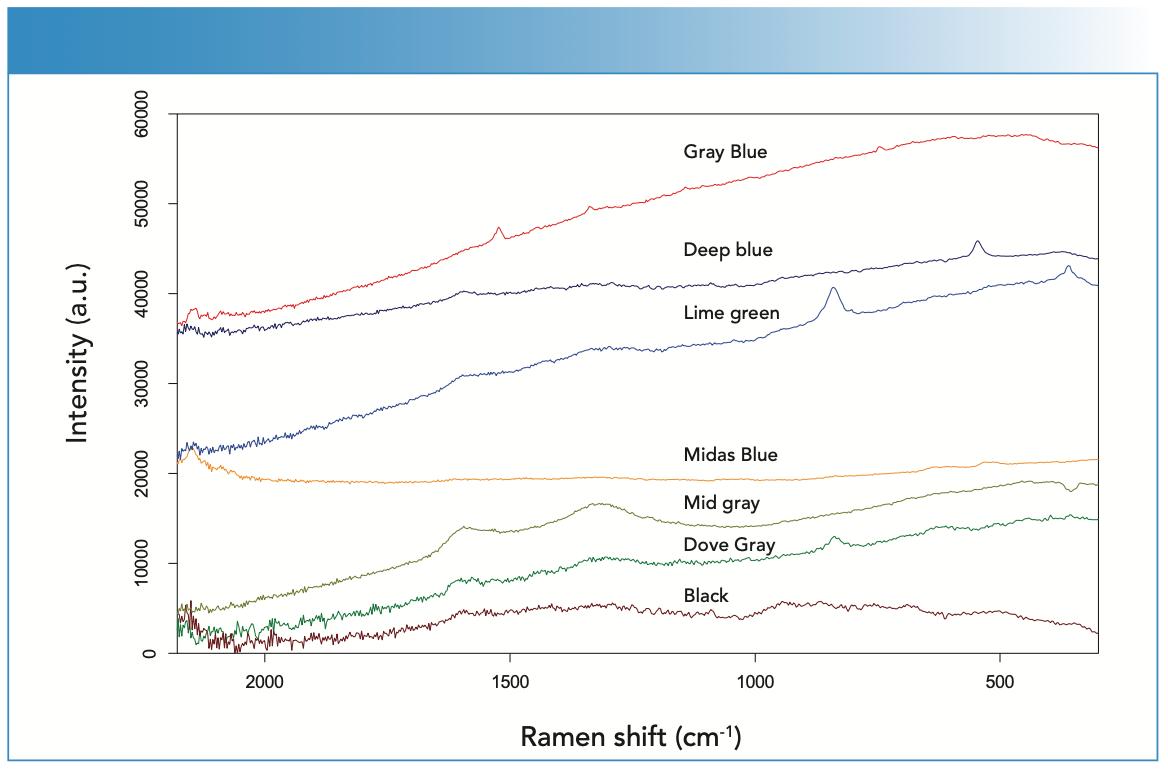
FIGURE 4: The X-ray fluorescence (XRF) spectra collected from the blue, green, gray, and black pigments found on the workshop floor. All spectra presented were collected at 30 kV and 50 μA for 30 s, with no primary beam filter. Select spectra have been scaled for clarity, with the scaling factor indicated relative to the Y-axis scale.
Black Paint
The black paint has the signature response of amorphous carbon, as shown in the Raman spectrum (bottom spectrum of Figure 3). Carbon is too light an element to be detectable by portable XRF (2), suggesting that all element peaks in the measured XRF spectrum are from underlying sources.
Red and Orange Pigments
The dark red paint contains hematite. Hematite bands are present in the Raman spectrum (Figure 5), but are weak shoulders on the titanium oxide peak, which indicates an anatase form. However, the XRF spectrum confirms the assignment (Figure 6). Hematite red was observed by Rosi and associates (3). In comparison, the bright red paint has been determined to be based on a CdS1-xSex complex mixed with BaSO4, as previously reported on authenticated works by Pollock (3). This paint produces substantial fluorescence, with the Raman spectrum shown in Figure 5, and it was the first spectrum successfully collected from this compound that the authors could determine from an extensive literature search. The XRF spectrum was useful in making this identification (Figure 6).
FIGURE 5: The uncorrected or altered Raman spectra collected from the red, orange, and yellow pigments found on the Pollock workshop floor.

FIGURE 6: The X-ray fluorescence (XRF) spectra collected from the red, orange, and yellow pigments found on the workshop floor.
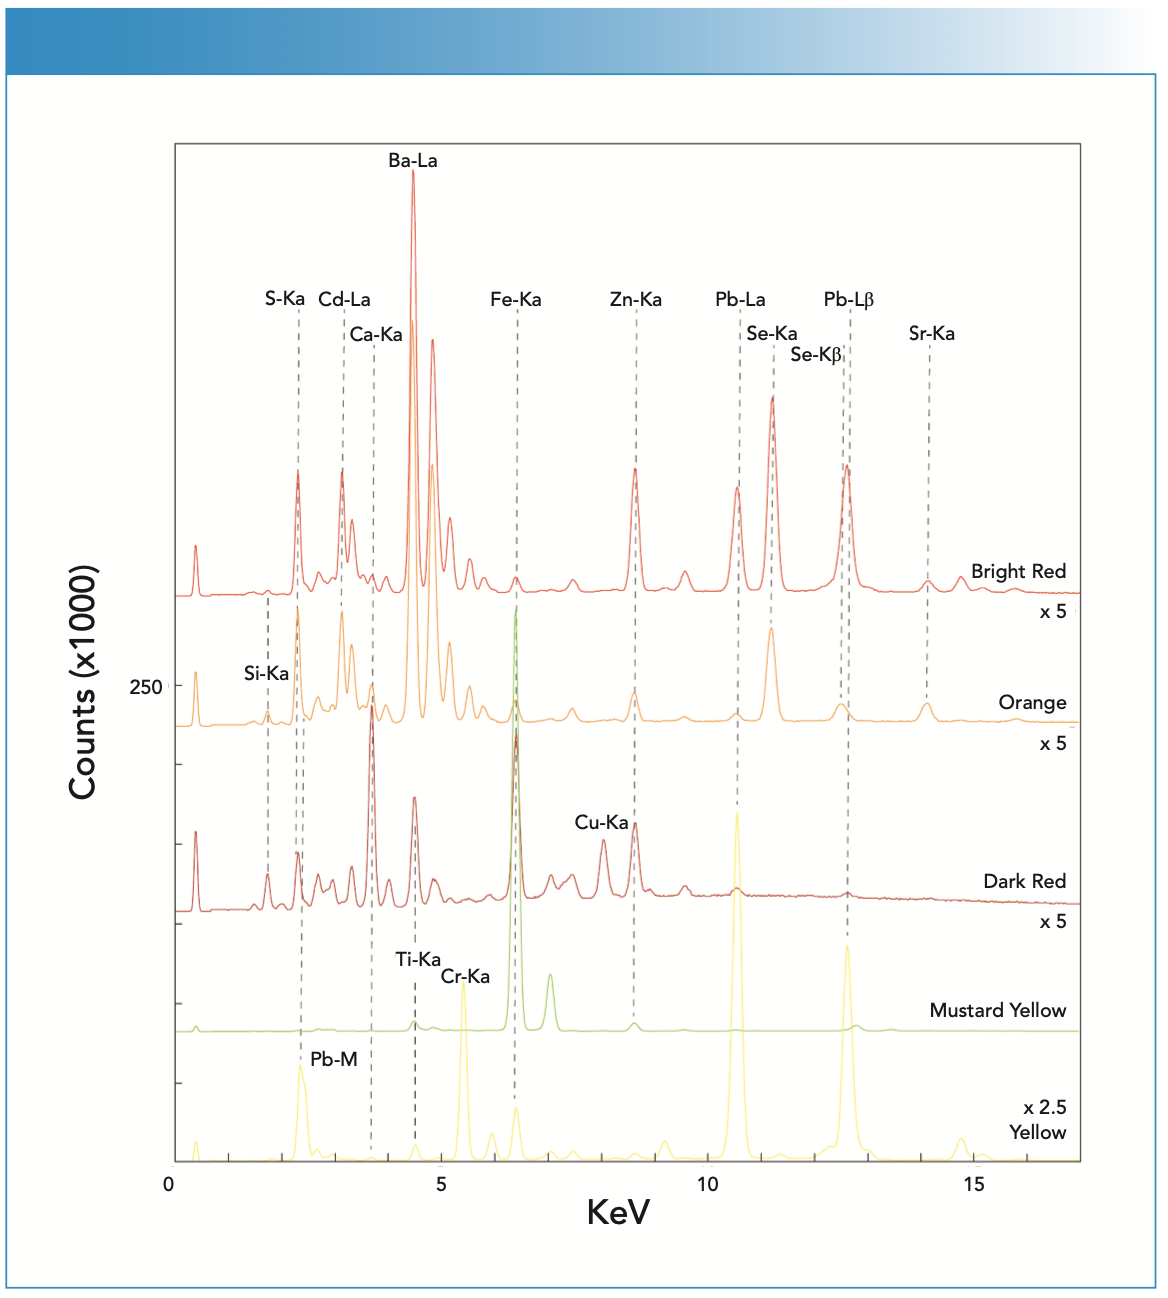
The orange paint was found to contain some carbon and the same BaSO4, and the CdS1-xSex complex was observed in the bright red pigment. This identification was also reported by Rosi (3). The XRF spectrum exhibited a strong signal for barium and prominent peaks for sulfur, cadmium, and selenium. The Raman spectrum showed bands attributed to amorphous carbon (not detectable by XRF) and barium white. The mustard-colored paint was found to contain evidence for Mars yellow (FeOOH) and some organic pigment, confirmed by both Raman (Figure 5) and XRF measurements (intense Fe peaks in Figure 6). In the Raman spectrum, the triplet of bands from Mars yellow are evident (2). There were four weak bands present at 1734, 1589, 1286, and 1042 cm-1 that were likely because of an unassigned organic pigment. The bands match somewhat the crinacridone red reported by Schulte and associates (5). However, this would be a tentative assignment. The Raman spectrum collected on yellow paint has a strong signature characteristic of chrome yellow (PbCrO4). The XRF spectrum confirmed the interpretation based on prominent Cr and Pb peaks (Figure 6). Chrome yellow has been reported in use by Pollock in other works (3).
White, Pink, and Aluminum Paints
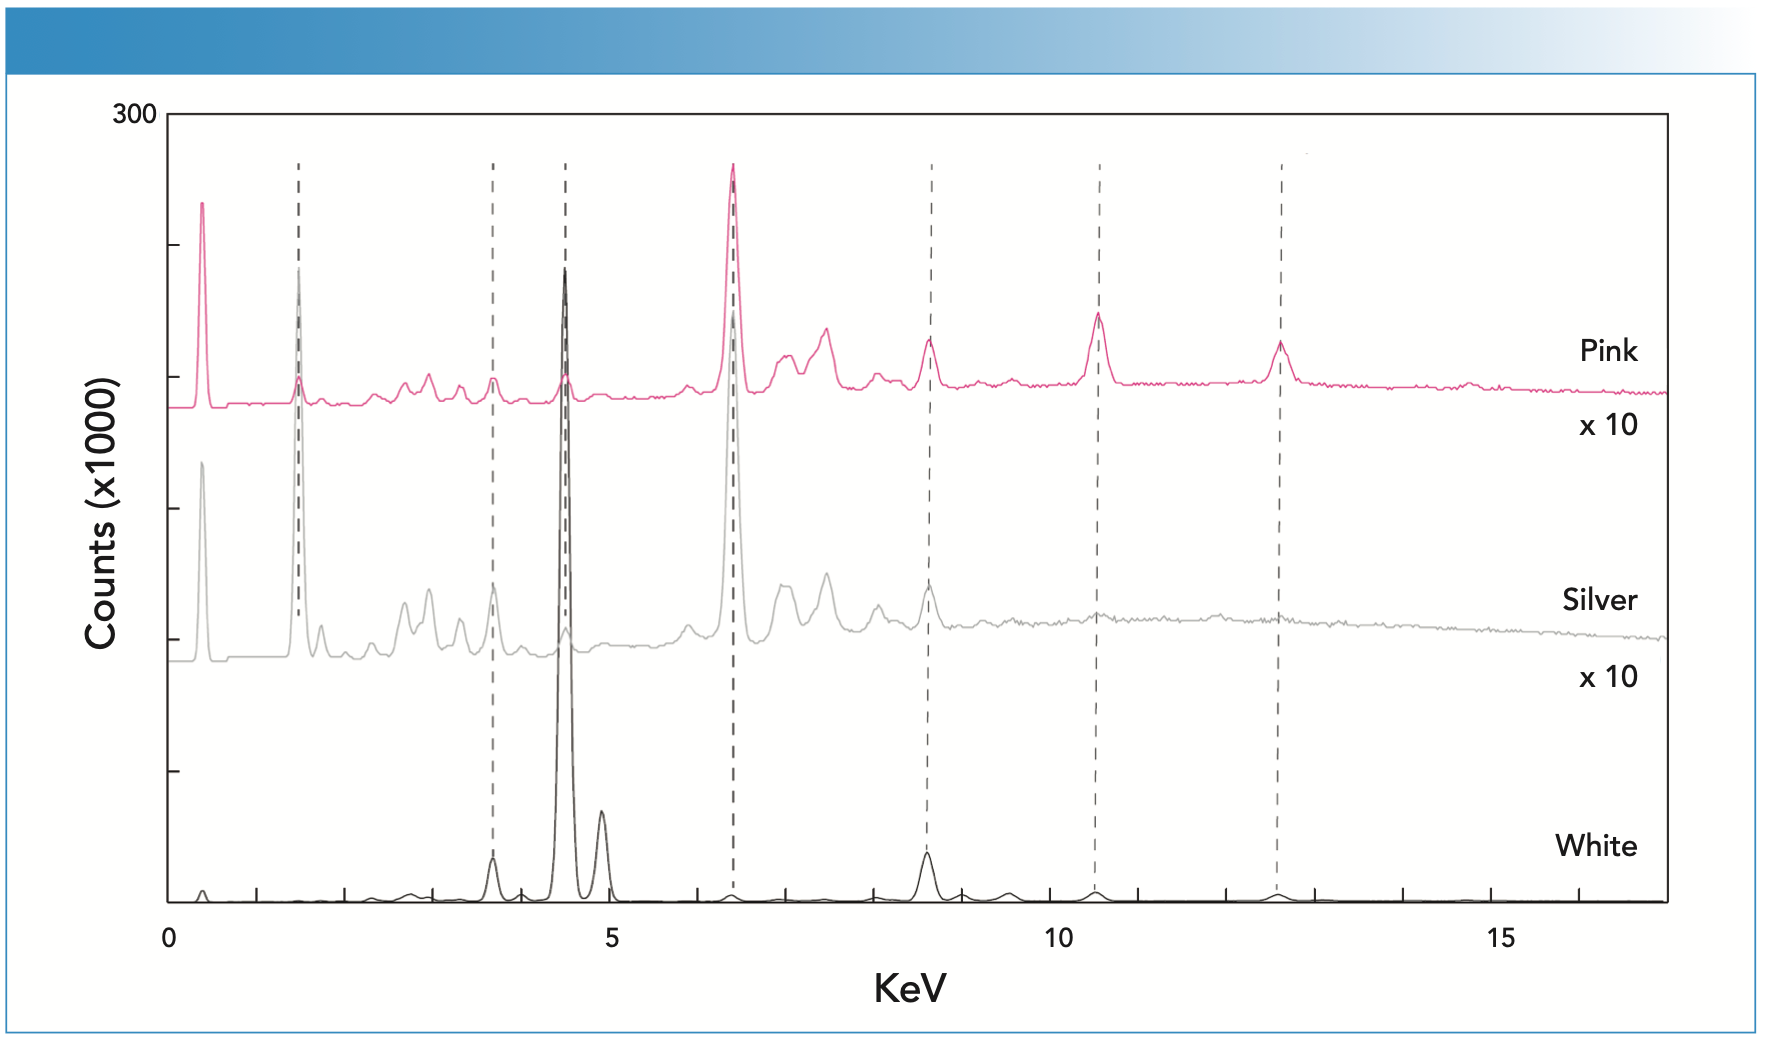
The prominent white paint present on the floor of the Pollock studio is titanium white (Figures 7 and 8), as previously observed by Rosi (3). The Raman spectrum contained the well-known doublet for the rutile form of titanium oxide, supported by a strong titanium signal in the XRF spectrum (Figure 8). Minor Zn and Pb peaks in the XRF spectrum likely reflect mixtures of multiple white pig- ments in other paints. The pink paint was interpreted to be azo β-napthol toluidine as identified by the Raman spectrum (Figure 7) with bands at 1620, 1567, 1493, 1440, 1392, and 1326 cm-1, as also reported by Rosi (3). The XRF spectrum was weak, also indicating an organic-based pigment. However, the XRF spectrum showed a strong signal for aluminum, confirming the visual inspection that suggested the pink was achieved by mixing the toluidine red pigment with metallic aluminum paint. The Raman spectrum collected from the aluminum-colored paint yielded a spectrum with no bands. Figure 8 shows the XRF spectrum which records a very prominent peak at aluminum, along with other contributions from underlying paints. Bare metals do not have a Raman signature, so no Raman pigment bands would be expected.
FIGURE 7: The uncorrected or altered Raman spectra collected from the blue, green, gray, and black pigments found on the Pollock workshop floor.
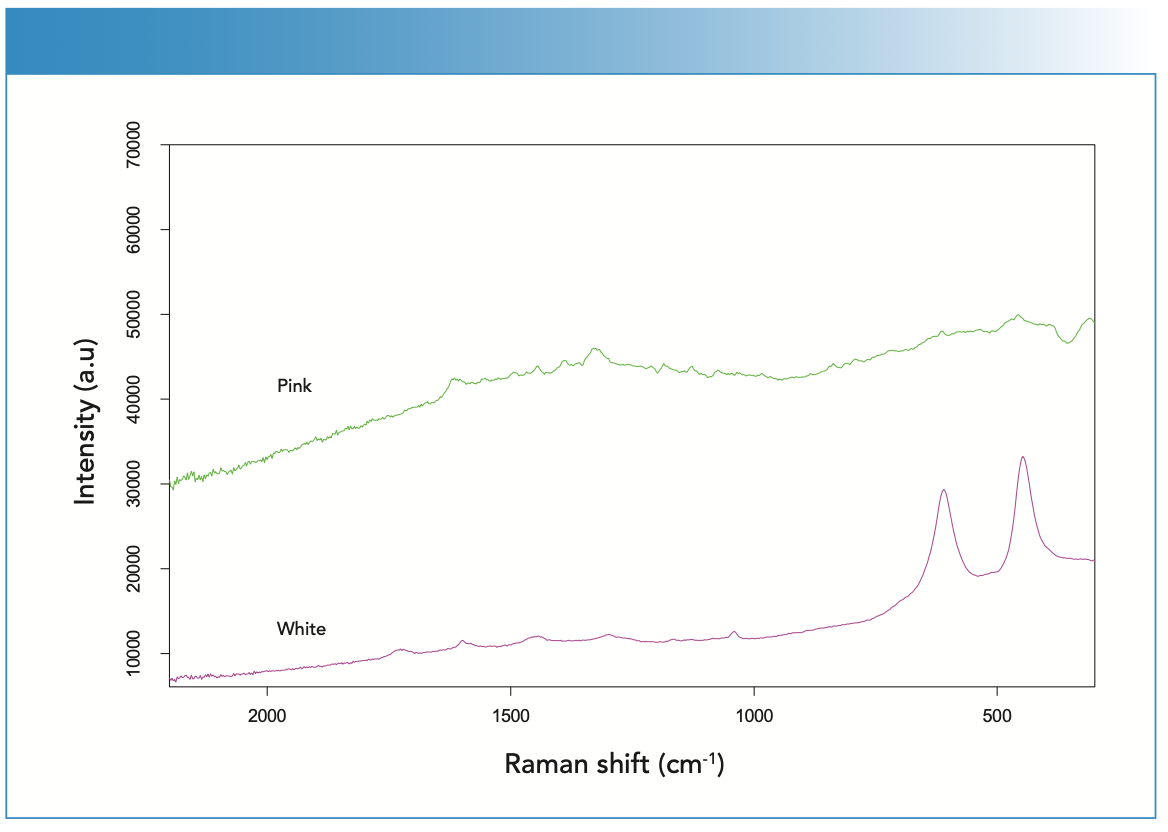
FIGURE 8: The X-ray fluorescence (XRF) spectra collected from the pink, silver, and white pigments found on the workshop floor.
Brown Paint
Raman analysis of the brown paint yielded only fluorescence, and no XRF was performed on the brown paint. It is commonly difficult to obtain a Raman spectrum from brown paint because there is significant fluorescence interference.
Multilayered Musings
By performing a non-invasive paint analysis of Jackson Pollock’s workshop floor with the integrated use of portable Raman and XRF spectrometers, we came to a few conclusions. We found that most pigments could be readily identified by Raman or XRF analysis. However, the CdS1-xSex complex in the active orange pigment was identified only by XRF analysis; De Faria and Lopes (4) also observed the presence of this uncommon pigment. For bare metals, such as the aluminum pigment, XRF was also essential for making the identification because bare metals do not have a Raman response.
The advantage in this study of portable Raman analysis is that it is primarily a surface technique. As observed from the photographs of the Pollock workshop floor, there were certainly many layers of paint! Raman measurements allowed targeted analysis of only the surface paint, whereas XRF may contain mixed measurements of multiple layers. Additionally, the Raman technique allowed the characterization of the molecular structures of materials, which facilitates highly specific identification for organometallic and organic compounds that do not have unique elemental signatures.
We hope that the pigments identified through our multi-instrumental analysis of a studio floor may provide additional puzzle pieces for future researchers who need to verify whether they really do have a genuine Jackson Pollock—or just a drip painting of unknown origin.
Acknowledgment
The authors with to express their gratitude to the Pollock-Krasner House curator, Helen Harrison, for allowing us to visit the museum and collect scientific data from paint on the workshop floor.
References
(1) L. Burgio and R.J.H. Clark, Spectrochim. Acta, Part A 57, 1491–1521 (2001).
(2) I.M. Bell, R.J.H. Clark, and P.J. Gibbs, Spectrochim. Acta, Part A 53, 2159–2179 (1997).
(3) F Rosi, et al., Herit. Sci. 4(18), 1–18 (2016).
(4) D.L.A. De Faria and F.N. Lopes, Vib. Spectrosc. 45(2), 117–121 (2007).
(5) F Schulte, et al., J Raman Spectrosc. 39, 1455–1463 (2008).
Thomas J. Tague, Jr. is an Applications Manager, with Bruker Optics. Gene Hall is a Professor of Chemistry at Rutgers University. Nigel Kelly is Senior Market Applications Scientist, Bruker Nano Analytics. Direct correspondence to: Tom.Tague@bruker.com ●
AI-Powered SERS Spectroscopy Breakthrough Boosts Safety of Medicinal Food Products
April 16th 2025A new deep learning-enhanced spectroscopic platform—SERSome—developed by researchers in China and Finland, identifies medicinal and edible homologs (MEHs) with 98% accuracy. This innovation could revolutionize safety and quality control in the growing MEH market.
New Raman Spectroscopy Method Enhances Real-Time Monitoring Across Fermentation Processes
April 15th 2025Researchers at Delft University of Technology have developed a novel method using single compound spectra to enhance the transferability and accuracy of Raman spectroscopy models for real-time fermentation monitoring.
Nanometer-Scale Studies Using Tip Enhanced Raman Spectroscopy
February 8th 2013Volker Deckert, the winner of the 2013 Charles Mann Award, is advancing the use of tip enhanced Raman spectroscopy (TERS) to push the lateral resolution of vibrational spectroscopy well below the Abbe limit, to achieve single-molecule sensitivity. Because the tip can be moved with sub-nanometer precision, structural information with unmatched spatial resolution can be achieved without the need of specific labels.
