Advanced Structural Mass Spectrometry for Systems Biology: Pulling the Needles from Haystacks
Special Issues
Ion mobility–mass spectrometry (IM-MS) is outlined as a separations method, several examples of the utility of IM-MS for complex biological measurements are illustrated, and the implications of this approach for systems biology research are discussed.
Systems-wide measurements in life sciences research have considerable promise in areas ranging from personalized medicine to understanding dominant or prevailing biological processes. However, formidable challenges remain in the comprehensive analyses of complex living systems, such as the necessity for detection limits that encompass wide concentration dynamic ranges while maintaining molecular specificity, sensitivity, and throughput. Recent work has demonstrated the ability to address several of these challenges with multidimensional separations using gas-phase ion mobility–mass spectrometry (IM-MS). IM-MS provides the capability to analyze a wide breadth of biomolecular classes on a single instrument simultaneously by separating the molecules according to their apparent surface area (equating roughly to their size) as well as their mass-to-charge ratio. The addition of a size separation parameter distributes the molecular classes into different regions of conformation space based upon differences in the prevailing intermolecular folding forces. This distribution negates the predominance of endogenous and exogenous matrix interferences experienced with traditional MS and provides a rapid (millisecond) means for separating biomolecules similar to liquid chromatography (LC)–MS approaches. Because separations are performed following ionization, additional dimensions of molecular information can be obtained through combining LC–IM-MS and gas chromatography (GC)–IM-MS. In this report, IM-MS is outlined as a separations method, several examples of the utility of IM-MS for complex biological measurements are illustrated, and the implications of this approach for systems biology research are discussed.
Systems biology seeks to describe the function of a biological system using a holistic, multiscale approach. This approach encompasses the analyses of molecular classes such as the genome, transcriptome, proteome, and metabolome (among others) of a biological system. Most modern approaches choose to either rapidly sample a single aspect (for example, the electrochemical detection of glucose and the use of green fluorescent protein as a means of monitoring translation) or infrequently sample a more comprehensive set of data. Intermittent sampling results in a fractional snapshot of the system, upon which biological inferences must be placed. When considering the turnover rate of certain enzymatically catalyzed reactions (for example, millimolar per second rates for ATP, ADP, and cytosolic glucose) or the rate of ribosomal translation (that is, six to nine amino acids per second for a eukaryotic cell), for example, single minute sampling resolution is considered coarse (1–3). The rapid acquisition rate of time-of-flight mass spectrometry (TOF-MS) measurements allows for sampling at a timescale that is relevant for a greater number of biological processes. However, MS alone lacks the necessary peak capacity for systems biology analyses, even when considering high-resolution methods that can provide a resolving power greater than ~50,000 (4,5). This limited peak capacity may be alleviated through the coupling of mass spectrometry to one of several additional separations methods, notably ion mobility (IM), which is a post-ionization separation that resolves ions based on their relative size-to-charge ratio and occurs on the order of milliseconds (6,7). Nevertheless, the ability of MS and IM-MS to perform proteomic and metabolomic analyses is unquestionable (8,9). The sensitivity, dynamic range, and ability to obtain accurate mass measurements, among other figures of merit, are the stronger suits of IM-MS.
In this article we describe the utility of IM-MS as a platform for systems biology research, the data that are acquired from these analyses, how it is interpreted, the strengths and limitations of the technology, and the outlook for future possibilities.
Theory and Instrumentation
Measuring the gas-phase electrophoretic mobility of ions, although popularized by the advances of electrospray ionization (ESI) and matrix-assisted laser desorption–ionization (MALDI) in the 1980s (10–12), really came to the forefront of separation science in the 1970s (13–17). There are currently several different forms of IM; however, all operate under similar guiding principles. Foremost, a mobility or separation cell is pressurized with a neutral background gas. The gas-phase ions from the sample are introduced into the cell and traverse the cell under the influence of a weak electric field at a rate inversely proportional to the number of collisions they experience with the background gas. Thus, smaller ions (for example, small-molecule metabolites) will traverse the cell with fewer collisions than large ions (for example, proteins). To a first approximation, these collisions are assumed to be completely elastic and the conditions of the cell (that is, electric field, temperature, and gas number density of the ion cloud) are tuned such that the collisions are of low enough energy to avoid inducing any structural or chemical changes. Thus, the elution order of ions is based upon their gas-phase packing density (that is, the physical density to which the individual molecule is folded and packed) in the gas-phase.
The simplicity of the design of IM makes the technology versatile and robust enough to be found in the commercial and military sectors, in which it is used for detection of explosive compounds. In the research laboratory, the millisecond timescale of the separations facilitates the multiplexed combination of ion mobility with higher repetition-rate sampling techniques such as MS. The addition of IM to MS can be likened to the coupling of liquid chromatography (LC) or gas chromatography (GC) to MS, where pre-ionization separations (GC and LC), which inherently have a longer separations timescale (minutes to hours), interface with the higher sampling rate MS (for example, microseconds for time-of-flight MS), allowing many spectra to be taken for a given LC or GC separation. The resulting data comprise an LC trace with an associated MS spectrum acquired at subsecond intervals, which is typically displayed in two dimensions (Figure 1a). The hydropathic separation of LC is highly orthogonal to the m/z separation of MS and yields a spectrum where the molecular signals occupy a large region of separations space. IM-MS is a similar marriage of two temporally disparate separations, with IM dispersing ions based upon their relative gas-phase size and charge state and occurring on the order of milliseconds, allowing for hundreds of MS spectra to be taken for a given IM separation. These data produce two-dimensional spectra, as shown in Figure 1b, with the mass of the ion (m/z) displayed on the abscissa and drift time (the time it takes the ions to traverse the ion mobility drift cell in milliseconds) on the ordinate. The drift time of an ion, dictated by its gas-phase packing density, is not highly orthogonal to the mass differentiation of MS. This results in more concentrated occupation of separations space.

Figure 1: A comparison of the orthogonality of (a) LCâMS and (b) IM-MS.
Advantages of the IM dimension include the ability to reduce chemical noise (by partitioning inherent chemical noise to other areas of two-dimensional conformation space) and to perform separations on the order of milliseconds (providing no significant reduction in acquisition time). The millisecond time-scale of these separations also allows for the addition of an LC- or GC-based separation before the mobility separation (yielding a three-dimensional data set). IM is also capable of separating analytes based upon their charge state and providing insight into prevailing intermolecular forces by effectively measuring gas-phase packing density, the implications of which will be discussed below.
IM-MS as a Separation Method
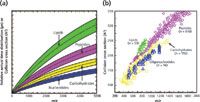
When compared to LC–MS data, two-dimensional IM-MS data exhibit several prevalent dissimilarities. Chief among these is the high degree of correlation seen in the two-dimensional IM-MS data (Figure 1). This correlation is inversely related to the orthogonality of the two measurements (18). The fact that the mass of an ion is intrinsically related to its size precludes ion mobility from being highly orthogonal to MS. Therefore, where LC and GC sample the chemical properties of polarity and volatility, which are often orthogonal to mass-to-charge ratio, ion mobility correlates to ion gas-phase packing density, which is related to mass. This correlation serves as both a challenge and a unique advantage. The challenge lies in the fact that at low masses (<500 Da) most of the data occupy a narrow region of two-dimensional space. However, for biological samples at larger masses, the data separate into distinct lines of correlation according to molecular class that are the result of differences in intermolecular folding forces that affect gas-phase packing density (19–21). This packing density separation becomes especially advantageous when considering complex biomolecular samples in which the prevailing intermolecular forces present in biomolecules lead to the partitioning of lipids, peptides, carbohydrates, and oligonucleotides into separate regions of conformational space (Figure 2). Lipids are the least dense, followed by peptides and then carbohydrates, with nucleotides occupying the highest degree of gas-phase packing density. Historically, these have been termed trendlines or mass-mobility correlations and have been used for the rapid classification of unknown biomolecules.

Figure 2: (a) Correlation based on gas-phase packing density and mass gives rise to correlation lines dictated by the particular chemical class (singly charged species in this example). Theoretical representations of correlation lines are displayed. (b) Data illustrating these correlation lines. (Figure 2a is adapted with kind permission from Springer Science+Business Media: L.S. Fenn and J.A. McLean, Anal. Bioanal. Chem. 391, 906 [2008], Fig. 2(a). Figure 2b is adapted with kind permission from Springer Science+Business Media: L.S. Fenn, M. Kliman, A. Mahsutt, S.R. Zhao, and J.A. McLean, Anal. Bioanal. Chem. 394, 235 [2009], Fig 1(a).)
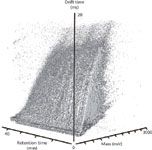
Ion mobility, being that it is a post-ionization separation technique, is easily integrated with traditional pre-ionization separations such as LC or GC. This added data dimensionality has several key benefits. For example, Clemmer and colleagues (22) have recently described LC–ESI-IM-MS studies of the human plasma proteome whereby three-dimensional separations provided an enhanced dynamic range in concentration that was estimated to be 105 –106 . Data from LC-IM-MS multiplexed arrangements illustrate the data density of such experiments from complex biological samples. An example spectrum of plasma from whole rat blood is shown in Figure 3 as a three-dimensional scatterplot. Each ellipsoid in the spectrum represents a uniquely identified peak with the relative shapes of the ellipsoids in each dimension being governed by the associated resolution of each measurement axis. The relative size of each ellipsoid represents the relative intensity of the ion signal. Note that there are over 100,000 uniquely defined features contained within this dataset, compared with approximately 10,000 when performing IM-MS in the absence of LC. This represents only ~10–5 of the possible molecules that could be uniquely specified in this scatterplot — another testimony of the peak capacity afforded by the three-dimensional separation.

Figure 3: Three-dimensional scatter plot of an LCâESI-IM-MS spectrum displaying individual features of plasma from whole rat blood.
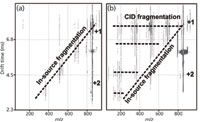
Additionally, mobility separations can be used to aid in the interpretation of fragmentation spectra. If ion activation, by means of collision induced dissociation (CID), is performed following mobility separation, product ions that result from fragmentation can be correlated to precursor ions based upon their elution time from the IM dimension (Figure 4). This differs from in-source fragmentation, which is not mobility aligned, because this fragmentation occurs before the mobility cell. In contemporary LC–MS approaches, ions of a particular m/z are selected and subsequently activated for fragmentation. In untargeted approaches, such as Waters's MSE , there is no m/z selection; rather, each LC increment is subjected to activation of all masses. If the LC separation produces coeluted peaks, fragment ion spectra can be difficult to assign because they contain fragment ions arising from multiple precursor species. However, with the added IM dimension these fragmentation spectra are correlated to the precursor based on mobility, and thus enable assignment of the fragment ions to respective precursors.

Figure 4: Ion mobility mass spectra of the small carbohydrate, lacto-N-fucopentaose 1, illustrating two IM-MS modes. (a) Spectra from fragmentation before IM-MS analysis resulting in dispersion of fragment ion signal across both dimensions of data analysis. (b) Spectra resulting from two stages of fragmentation, one before the IM analysis and one immediately following the IM analysis. In this latter case, fragment ion signal is dispersed across the mobility dimension and secondary fragment ion signals align in the mobility dimension, resulting in simultaneous fragmentation of all ions resulting from the first stage of activation.
Multidimensional Data Handling
Because of the large amounts of data generated in an IM-MS analysis, translating the data to meaningful information can be challenging. Data acquired from IM-MS separations used in conjunction with any pre-ionization separation must first be discretized to finite retention time, drift time, and mass-to-charge values. Data must be aligned in all dimensions for cross-sample comparison. Open-source and commercial software is available that addresses several of these issues (23–25). The use of internal calibrants and spectral feature alignment algorithms compensate for minor separation incongruencies. Additionally, isotopic envelopes must be collapsed into monoisotopic peaks and intensities normalized, commonly using total ion count. This ensures relevant and relatively quantitative sample-to-sample comparability. To date, software that defines peaks using mobility in conjunction with m/z and retention time is not widely available, as the processing and alignment of raw data in three dimensions are computationally expensive. However, developments in this area are forthcoming. The availability of open-source or commercially available software for peak identification will be necessary to fully utilize the potential of three or higher dimensions of separation.
Presently, these data are often discriminated using multivariate statistical analyses such as principal component analysis (PCA) and partial least squares-discriminate analysis (PLS-DA). In essence, these methods seek to distill data to two or three principal components that best describe the variability of the data. It is important that this approach allows the analytes that contribute most significantly to differences in sample sets to be identified from tens of thousands of molecular signals — the PCA components each represent a particular spectrum of analytes that is representative of a specific difference between the two samples. In this manner, needles may be drawn from the haystacks of data present in very complex biological systems. This method has been employed extensively in metabolomic analyses and is considered a reliable method for untargeted analyses, allowing for the prioritization of peaks of interest for database searching using publicly available databases (26–28).
Future Directions
The advancement of systems biology research lies in the integration of multi-omic measurement strategies (for example, genomics, proteomics, lipidomics, glycomics, and metabolomics) with high temporal bandwidth; in other words, the ability to analyze many aspects of a biological system and track the products of the various biomolecular machinery with up to the second (or greater) time resolution. This ensures a more complete representation of the biological system and is essential to assembling a systems-level understanding. A single instrument platform, such as ESI-IM-MS or other multidimensional analyses, represents the best case scenario for temporal resolution because of the limited amount of sample manipulation that is required, thus preserving the biology in an unperturbed state. This approach also facilitates the ability to analyze samples with a multi-omic approach.
When analyzing a complex system it is common to collect static samples or fractions to assess biomolecular changes. This offline method of sample collection becomes increasingly daunting as greater temporal resolution is desired, prompting excessive amounts of time to collect, process, collate, and then analyze the samples. The development of an online analysis platform could circumvent this issue by negating the need to handle the samples at all. In fact, when working with a continuous measurement system such as ESI-IM-MS, a continuously perfused sample is ideal.
Aside from the vast analytical complexity of sample material and timing, there is still one major issue: How does one collect frequent multisystem samples without perturbing or destroying the biological system being studied? One solution is to run numerous duplicate systems in parallel, sacrificing one population for every sample collected; this assumes that all the populations are exact biological replicates of one another, which is highly unlikely. Another attractive option, which has recently gained momentum, is the use of the exometabolome to infer the phenotypic state (29,30). The exometabolome, or metabolic footprint, comprises any and all material that is secreted from the cell. This means the exometabolome has the potential to include proteins, lipids, glycans, metabolites, and in some bacterial and viral cases, nucleic acid material.
Work is currently underway to integrate poly(dimethylsiloxane) (PDMS) cell-trapping microfluidic devices (31–33) online with ESI-IM-MS to sample the exometabolome of cellular populations in real time (Figure 5) (34). In this method, media is typically perfused using syringe pumps. Cell trapping microfluidic devices are fabricated from PDMS. These devices (not drawn to scale in Figure 5) are roughly 2 cm in total length and are composed of 7000 cell traps that measure 18 µm wide and 18 µm deep. The interior space has a typical height of approximately 20 µm. Following perfusion of cell culture media across the cells, the sample effluent is desalted and subsequently analyzed by IM-MS. This method could serve as an option for the integrated and comprehensive online systems biology measurement of biological systems, thus overcoming the difficulties related to daunting sample collection and system preservation. One of the key remaining challenges facing this endeavor is the susceptibility of electrospray ionization to the presence of salt in cell culture media. It has long been known that nonvolatile salts, even at moderately low levels, can cause substantial signal suppression, and at the levels usually found in cellular media it is difficult to observe any analyte signal against the salt cluster-filled background noise (35–37). Online sample processing to remove these salts can take on various forms; however, online solid-phase extraction (34) and microdialysis-based (38–40) methods seem to hold the most promise. Additionally, other online sample processing steps can be added, such as online protein digestion (41–43) or filtration, to give emphasis to the desired biomolecular class. The challenge is to optimize the desalting process without compromising the temporal resolution of dynamic biological processes that can be provided by both the microfluidic devices and IM-MS analysis.

Figure 5: Schematic diagram of a system used for the online ESI-IM-MS analyses of the cellular exometabolome.
The future of systems biology research will lie not in the division of divergent and highly specified analyses of individual components of biological systems, but rather in the holistic and convergent simultaneous measurement of all parts of a biological system. It is the optimization of combining these aspects into a single experimental platform, while also overcoming the inherent difficulties, that will result in the greatest insight into these systems. An integrated IM-MS platform coupled to real-time experiments on small populations of live cells with the possibility of feedback (44,45) will likely be useful for the present and future direction of systems biology–level experiments.
Acknowledgments
Financial support for this work was provided by the NIH (1RO1GM092218-01 and RC2DA028981), the U.S. Defense Threat Reduction Agency (HDTRA-09-1-0013), the Vanderbilt University College of Arts and Science, the Vanderbilt Institute of Chemical Biology (Pilot project grant), and the Vanderbilt Institute for Integrative Biosystems Research and Education. We thank Allison Price for her editorial assistance.
References
(1) M. Rizzi, M. Baltes, U. Theobald, and M. Reuss, Biotechnol. Bioeng. 55, 592–608 (1997).
(2) W.D. Koning and K.V. Dam, Anal. Biochem. 204, 118–123 (1992).
(3) J.F. Ross and M. Orlowski, J. Bacteriol. 149, 650–653 (1982).
(4) M.L. Vestal, J. Am. Soc. Mass Spectrom. 22, 953–959 (2011).
(5) B. Domon and R. Aebersold, Science 312, 212–217 (2006).
(6) S.J. Valentine, M. Kulchania, C.A.S. Barnes, and D.E. Clemmer, Int. J. Mass Spectrom. 212, 97–109 (2001).
(7) B.T. Ruotolo, K.J. Gillig, E. Stone, and D.H. Russell, J. Chromatogr., B 782, 385–392 (2002).
(8) R. Aebersold and M. Mann, Nature 422, 198–207 (2003).
(9) D. Katja, A.A. Pavel, and D. Bruce, Mass Spectrom. Rev. 26, 51–78 (2007).
(10) K. Tanaka et al., Rapid Commun. Mass Spectrom. 2, 151–153 (1988).
(11) M. Karas and F. Hillenkamp, Anal. Chem. 60, 2299–2301 (1988).
(12) J.B. Fenn et al., Science 246, 64–71 (1989).
(13) H.E. Revercomb and E.A. Mason, Anal. Chem. 47, 970–983 (1975).
(14) F.W. Karasek,H.H. Hill, and S.H. Kim, J. Chromatogr. 117, 327–336 (1976).
(15) F.W. Karasek, H.H. Hill, S. Kim, and S. Rokushika, J. Chromatogr. 135, 329–339 (1977).
(16) F.W. Karasek, Anal. Chem. 46, A710-& (1974).
(17) T.W. Carr, Plasma Chromatography (Springer-Verlag, New York, 1984), p. 274.
(18) J.C. Giddings, Anal. Chem. 56, 1258A (1984).
(19) L.S. Fenn and J.A. McLean, Anal. Bioanal. Chem. 391, 905–909 (2008).
(20) L.S. Fenn, M. Kliman, A. Mahsut, S.R. Zhao, and J.A. McLean, Anal. Bioanal. Chem. 394, 235–244 (2009).
(21) J.A. McLean, J. Am. Soc. Mass Spectrom. 20, 1775–1781 (2009).
(22) X.Y. Liu et al., J. Am. Soc. Mass Spectrom. 18, 1249–1264 (2007).
(23) C.A. Smith, E.J. Want, G. O'Maille, R. Abagyan, and G. Siuzdak, Anal. Chem. 78, 779–787 (2006).
(24) C.D. Broeckling et al., Anal. Chem. 78, 4334–4341 (2006).
(25) R. Baran et al., BMC Bioinformatics 7, 530 (2006).
(26) C.A. Smith et al., Ther. Drug Monit. 27, 747–751 (2005).
(27) D.S. Wishart et al., Nucl. Acids Res. 35, D521–526 (2007).
(28) M. Sud et al., Nucl. Acids Res. 35, D527–D532 (2007).
(29) D.B. Kell et al., Nat. Rev. Microbiol. 3, 557–565 (2005).
(30) S.G. Villas-Boas, S. Noel, G.A. Lane, G. Attwood, and A. Cookson, Anal. Biochem. 349, 297–305 (2006).
(31) S. Faley et al., Lab on a Chip 8, 1700–1712 (2008).
(32) S.L Faley et al., Lab on a Chip 9, 2659–2664 (2009).
(33) M.R. Warnement, S.L. Faley, J.P. Wikswo, and S.J. Rosenthal, IEEE Trans. Nanobioscience 5, 268–272 (2006).
(34) J.R. Enders et al., IET Syst. Biol. 4, 416–427 (2010).
(35) T.L. Constantopoulos, G.S. Jackson, and C.G. Enke, J. Am. Soc. Mass Spectrom. 10, 625–634 (1999).
(36) T.M. Annesley, Clin. Chem. 49, 1041–1044 (2003).
(37) L.L. Jessome, and D.A. Volmer, LCGC No. Am. 24, 498–510 (2006).
(38) C.L. Liu et al., Anal. Chem. 70, 1797–1801 (1998).
(39) C.L. Liu, Q.Y. Wu, A.C. Harms, and R.D. Smith, Anal. Chem. 68, 3295–3299 (1996).
(40) Q.Y. Wu, C.L. Liu, and R.D. Smith, Rapid Commun. Mass Spectrom. 10, 835–838 (1996).
(41) A. Le Nel et al., Electrophoresis 29, 4944–4947 (2008).
(42) C. Wang et al., Rapid Commun. Mass Spectrom. 14, 1377–1383 (2000).
(43) J. Lee, S.A. Soper, and K.K. Murray, Analyst 134, 2426–2433 (2009).
(44) J.P. Wikswo et al., IEEE Proc.-Nanobiotechnol. 153, 81–101 (2006).
(45) P.R. LeDuc, W.C. Messner, and J.P. Wikswo, Annu. Rev. Biomed. Eng. 13, in press (2011).
Jeffrey R. Enders, Cody R. Goodwin, and John A. McLean are with the Department of Chemistry, the Vanderbilt Institute of Chemical Biology, and the Vanderbilt Institute for Integrative Biosystems Research and Education, Vanderbilt University (Nashville, Tennessee). Christina C. Marasco and Kevin T. Seale are with the Vanderbilt Institute for Integrative Biosystems Research and Education and the Department of Biomedical Engineering, Vanderbilt University. John P. Wikswo is with the Vanderbilt Institute for Integrative Biosystems Research and Education, the Department of Biomedical Engineering, the Department of Physics and Astronomy, and the Department of Molecular Physiology and Biophysics, Vanderbilt University.

LIBS Illuminates the Hidden Health Risks of Indoor Welding and Soldering
April 23rd 2025A new dual-spectroscopy approach reveals real-time pollution threats in indoor workspaces. Chinese researchers have pioneered the use of laser-induced breakdown spectroscopy (LIBS) and aerosol mass spectrometry to uncover and monitor harmful heavy metal and dust emissions from soldering and welding in real-time. These complementary tools offer a fast, accurate means to evaluate air quality threats in industrial and indoor environments—where people spend most of their time.
NIR Spectroscopy Explored as Sustainable Approach to Detecting Bovine Mastitis
April 23rd 2025A new study published in Applied Food Research demonstrates that near-infrared spectroscopy (NIRS) can effectively detect subclinical bovine mastitis in milk, offering a fast, non-invasive method to guide targeted antibiotic treatment and support sustainable dairy practices.
Smarter Sensors, Cleaner Earth Using AI and IoT for Pollution Monitoring
April 22nd 2025A global research team has detailed how smart sensors, artificial intelligence (AI), machine learning, and Internet of Things (IoT) technologies are transforming the detection and management of environmental pollutants. Their comprehensive review highlights how spectroscopy and sensor networks are now key tools in real-time pollution tracking.