Automated Screening for Hazardous Components in Complex Mixtures Based on Functional Characteristics Identifiable in GCxGC–TOF-MS Data
The increased resolving power provided by comprehensive two-dimensional gas chromatography (GCxGC) extends the chromatographer's ability to rapidly detect and measure smaller components in complex mixtures beyond that which was possible previously, allowing for the identification of hazardous components in complex mixtures such as foodstuffs or emergency response samples. In target analysis, the increased numbers of peaks resulting from the sample matrix can be largely ignored during the review of data. However, when the nature of the analyte of interest is not entirely known, analysis of the samples might require screening through the entire peak table for compounds with specific chemical characteristics. For example, in the analysis of foodstuffs for pesticides (1,2), GCxGC coupled with a time-of-flight mass spectrometry (GCxGC–TOF-MS) can provide low detection limits for multiple analytes in these complex samples. Yet the question remains as to whether other toxic compounds, not included in the..
The increased resolving power provided by comprehensive two-dimensional gas chromatography (GCxGC) extends the chromatographer's ability to rapidly detect and measure smaller components in complex mixtures beyond that which was possible previously, allowing for the identification of hazardous components in complex mixtures such as foodstuffs or emergency response samples. In target analysis, the increased numbers of peaks resulting from the sample matrix can be largely ignored during the review of data. However, when the nature of the analyte of interest is not entirely known, analysis of the samples might require screening through the entire peak table for compounds with specific chemical characteristics. For example, in the analysis of foodstuffs for pesticides (1,2), GCxGC coupled with a time-of-flight mass spectrometry (GCxGC–TOF-MS) can provide low detection limits for multiple analytes in these complex samples. Yet the question remains as to whether other toxic compounds, not included in the target list, are present in the sample. The application of automated techniques for the identification of compounds based upon characteristics detectable in mass spectral data assists greatly in answering this question.
Methods for attempting to identify chemical compounds based upon the chromatographic properties and spectral characteristics are not new and have shown further development since the introduction of comprehensive two-dimensional gas chromatography (GCxGC). Welthagen and colleagues (3) were able to demonstrate a series of selection rules that provide discrimination between at least seven chemical classes in GCxGC chromatograms of airborne particulate matter. These rules identify compounds based upon ratios of abundances of specific masses in the spectra. Richenbach and colleagues (4) developed a computer language with its own syntax, allowing for the application of these compound class selection rules.
This work was expanded further by Vogt and colleagues (5) by applying rules based upon the knowledge-based classifiers developed by Welthagen as well as classifiers derived from chemometric analysis of spectra from the work of Varmuza and Werther (6) and the category-type classifiers of Lohninger and Varmuza (7). The work of Vogt was applied to deconvoluted spectra obtained from GCxGC–time-of-flight mass spectrometry (TOF-MS) chromatograms, and it employed the VBScript language, a dialect of BASIC language, available in the scripting option in later versions of the LECO ChromaTOF software (Leco, St. Joseph, Michigan).
In some types of analyses, ratios of abundances of specific masses might not be particularly helpful in identifying compound classes. The relevant masses arise as isotope abundances seen with a molecular ion or as neutral losses from a molecular ion. If one can identify the molecular ion, then one can use techniques applied routinely in the interpretation of mass spectra (8) to identify compounds or classes of compounds. In a search for toxic compounds in food or environmental samples, there are no unique mass spectral identifiers for the classification "toxic." Yet particular types of functionality are more likely to indicate a hazardous compound. For example, chlorinated and brominated compounds typically are accompanied by health risks. Frequently, these halogenated compounds can be identified by isotope ratios in molecular ions and neutral losses, indicating loss of the specific halogen atoms. In a screening method for toxic compounds, the general identification of chlorinated and brominated compounds can provide a selected list of compounds to be examined further. Similarly, sulfur-containing compounds are not as common in the environment as compounds containing carbon, hydrogen, oxygen, and nitrogen. Sulfur is found in many pesticides. Thus, a filter for sulfur-containing compounds might be useful as well.
In this work, scripts (functions written in VBScript language) are developed to locate a parent ion and test it to determine if it matches the abundance ratio expected for compounds containing specified numbers of chlorine, bromine, or sulfur atoms.
Experimental
Samples and Chromatographic Conditions
Performance of the scripts was evaluated using previously acquired data (9). In this work, undiluted samples of commercially available citrus oils were analyzed under the conditions shown in Table I.
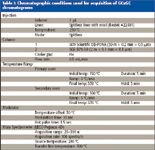
Table I: Chromatographic conditions used for acquisition of GCxGC chromatograms
Method of Identification of Compounds
Scripts were written to identify chlorine-, bromine-, and sulfur-containing compounds. These scripts were applied to the spectra in GCxGC chromatograms by the use of the "Classification" (with scripts) feature in the software used. This feature allows for chromatographic peaks matching a mass spectral pattern described in a script function to be labeled as belonging to a specific, user-defined class.
Chlorine- and bromine-containing compounds are identified by the chlorine or bromine isotope cluster seen for the molecular ion. This identification involves three steps. First, the spectrum is evaluated from high mass to low mass to detect the highest mass signal that is clearly not background noise. Second, the signal is tested to see if it is part of the isotope cluster expected for a specific number of chlorine and bromine atoms in a molecule. Third, signals for masses that would be irrational neutral losses from a molecular ion are identified, allowing for the elimination of clusters in the spectrum that are clearly fragments — and could show signals that are from a mixture of fragments, rather than the isotope cluster being sought. A typical VBScript function for detecting dichloro compounds is shown in Figure 1.
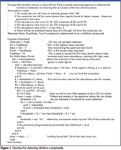
Figure 1
In this function, the high and low mass limits for the spectrum are extracted to allow for general application. Starting at the upper mass limit of the spectrum, the signal for each mass is examined. Extremely weak signals, based upon signal strength, are ignored. Even if such a signal were a part of a molecular ion isotope cluster, calculations of ratios would be unreliable. If the abundance for an ion is strong enough to use in calculations, it is tested to determine if it would be the most abundant ion in an ion cluster. Signals from the next several lower masses are examined because the first signal detected might have been for a higher mass in the cluster. Once the strongest mass in an apparent ion cluster is identified, the pattern of ions is tested to determine if it matches the ion cluster being sought.
If a series of mass abundances matching the desired isotope cluster pattern has been detected, it is tested further to see if there are other ions in the spectrum that would indicate the cluster is not, in fact, the molecular ion. If the series of mass abundances being examined is not the molecular ion, it might show abundances from a mixture of fragments. The match to the desired isotope cluster becomes less certain. In Figure 1, this test is made by using a call to the function No_Irrational_Fragments(). In the function, the masses from 2 mass units to 10 mass units lower than the low mass in the isotope cluster are examined to see if there is a signal stronger than expected for background noise. If such a signal is found, it is presumed to be a fragment, and what has been detected as a presumed isotope cluster must also be presumed to be a fragment. In this case, the spectrum cannot be considered to be an adequate match for the ion cluster being sought.
The function returns a true or false result, indicating whether the sought ion cluster was detected as the presumed molecular ion in the spectrum. In some cases, an ion cluster, that is, a fragment of the molecular ion, will be detected by one of these filters. For example, the mass spectrum of dicofol shows what might appear to be a parent ion for a dichloro compound at m/z 251. In this compound, the actual parent ion (m/z 368) is not seen. The trichloromethyl group in dicofol is easily lost from the molecular ion, leaving a relatively stable dichloro cation. While there are fragments with higher mass than the ion cluster at m/z 251, they are sufficiently weak that they are likely to be seen only as background noise. Dicofol will not be detected as a pentachloro compound, but rather as a dichloro compound — based upon the significance of the m/z 251 ion in the spectrum.
The isotope cluster for monochloro compounds includes only one abundance ratio to test. This test is easily confounded by noise. Therefore, indication of neutral loss of 35 has been included in the test used in this work.
The test for the presence of sulfur is less definitive because the strength of the M+1 and M+2 ions is considerably less than that of the M+2 ions seen for chlorine and bromine. The resulting ion cluster is less distinctive. Detection of sulfur-containing compounds also requires the ability to deal with significant neutral loss of one mass unit (H·), as is quite noticeable in compounds such as thiophenes.
Because the isotope cluster is less definitive, the search for the molecular ion cannot depend on simply finding a set of ions that appear in the right ratio. Small peaks, indistinguishable from background noise, can provide a fortuitous match with the ion ratios expected for sulfur-containing compounds. To avoid selecting noise for the molecular ion, the mean and standard deviation of ions showing a nonzero signal is determined as the spectrum is examined from high mass to low mass. A signal is determined to be significantly different from noise if it is greater than six times the measured standard deviation above the mean abundance determined for other detected background signals. This provides for a sufficiently strong signal that the calculation of the relative abundance of the M+1 and M+2 ions is meaningful. Once a significant signal is detected, the presence of an isotope cluster is determined in the same way it is determined for the chlorine- and bromine-containing compounds.

Table II: Abundance ratio limits used to identify isotope pattern
The constraints used for testing the various isotope clusters are shown in Table II. The ratios initially were determined from the spectra of halocarbons. The ratios for the chlorine- and bromine-containing compounds were then adjusted to allow for slight increases in abundance resulting from the presence of oxygen and sulfur in pesticides and to allow for variations resulting from background noise in weak spectra and differences in acquisition conditions. While the diagnostic ratios for chlorinated and brominated compounds are the sequence M, M+2, M+4, and so forth, the abundances of M-1 and M+1 were evaluated because strong abundances for these ions would rule out a match with the target isotope cluster. In the search for sulfur-containing compounds, the presence of a large M-1 ion requires the expected ion ratio for the M+1 abundance to be increased to account for the presence of the M+2 abundance in the fragment that is one mass unit lower than the molecular ion. As with the tests for chlorine- and bromine-containing compounds, the reason for examining the M+1 and M+3 abundances is primarily to rule out noise. With sulfur-containing compounds, this becomes particularly important because the M+2 abundance for sulfur is quite similar to that for silicon. Silicon gives a high M+1 abundance. Therefore, limiting the acceptable M+1 abundance in the filter for sulfur-containing compounds helps to reduce the number of silicon-containing compounds detected as sulfur-containing compounds. Even so, it is helpful to construct filters for specific silanes expected to be found in column bleed and to exclude compounds matching these filters from detection as sulfur-containing compounds.
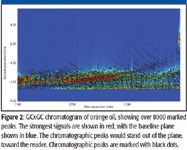
Figure 2
The scripts were applied to citrus oil samples that had not been spiked with pesticides to detect pesticides native to the citrus oils.
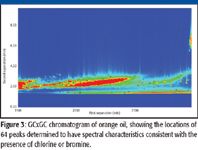
Figure 3
Results and Discussion
The chromatogram of Florida midseason orange oil (Figure 2) contains over 8000 marked peaks. Application of scripts designed to identify chlorinated and brominated compounds showed 64 peaks matching the criteria specified (Figure 3) and 185 peaks consistent with the presence of sulfur (Figure 4). Most of the peaks matching the criteria for peaks containing chlorine, bromine, or sulfur are coeluted with other compounds in the chromatographic plane and are detectable only with the use of the mass spectrometer. Low-level detection of many compounds requires the combination of GCxGC with mass spectral detection. A number of these peaks were readily confirmed by examining the mass spectra and obtaining the identity of the compound, as is demonstrated with the identification of methidathion (Figure 5). In other cases, peaks were identified as compounds potentially containing chlorine or bromine with the ion cluster identifiable, but without a good library match. Figure 6 shows the spectrum for such a chromatographic peak. The ion cluster at m/z 285 appears to be that of a dichloro compound. The chromatographic peak occurs at the expected location for ronnel, the library spectrum of which is shown with the unknown in the figure. Of the 249 peaks identified by the filters, nine were determined to be known pesticides or degradation products associated with pesticides. The pesticides identified included chloropyrifos, ronnel (fenclorphos), methidathion, dicofol, chlorobenzilate, and bromopropylate.
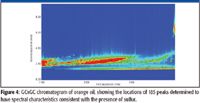
Figure 4
Analysis of an unspiked sample of a California lemon oil showed over 8000 identified peaks in the chromatogram. Of these, 44 were determined to be consistent with the presence of chlorine or bromine and 153 were determined to be consistent with the presence of sulfur. Of these, six compounds were determined to be known pesticides or degradation products. The pesticides identified included chloropyrifos, methidathion, dicofol, and bromopropylate.
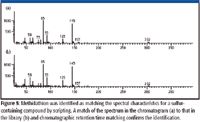
Figure 5
Concentrations of chloropyrifos, methidation, and bromopropylate were below 125 ppb in the lemon oil (concentrations of pesticides were higher in the orange oil). Tetradifon was known to be present in the lemon oil at approximately 44 ppb, but it was not detected by the filters shown here. Although chloropyrifos is detected by the filters at higher concentrations, at this low concentration, the ion ratios for the molecular ion did not match the filter for a tetrachloro compound.
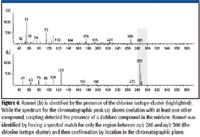
Figure 6
Conclusion
Automated screening of chromatographic data based upon the identification of mass spectral features offers significant assistance in the review of the GCxGC data and can identify chromatographic peaks showing spectral characteristics of compounds of interest. Although target analytical methods provide the highest degree of reliability in the identification of analytes and have the highest sensitivity, target analysis does not automatically locate compounds other than the target analytes. Peak identifications can be made, even when the spectrum is of sufficiently poor quality that the compound cannot be identified by spectral matching. This provides a complementary capability of being able to identify compounds of interest beyond those identified in a target list.
Donald C. Hilton is with LECO Corp., Fort Myers, Florida; e-mail: don_hilton@leco.com
References
(1) J. Dalluge, M. van Rijn, J. Beens, R.J.J. Vreuls, and U.A.Th. Brinkman, J. Chromatogr. A. 965, 207–217 (2002).
(2) J. Zrostl'ikova, J. Hajslova, and T. Cajka, J. Chromatogr. A. 1019, 173–186 (2003).
(3) W. Welthagen, J. Schnelle-Kreis, and R. Zimmerman, J. Chromatogr. A. 1019, 233–249 (2003).
(4) Stephen E. Richenback, Visweswara Kottapalli, Mingtian Ni, and Arvind Visvanathan, J. Chromatogr. A. 1071, 263 (2005).
(5) Leslie Vogt, Thomas Groger, and Ralf Zimmermann, J. Chromatogr. A. 1150, 2–12 (2007).
(6) K. Varmuza and W. Werther, J. Chem. Inf. Comput. Sci. 36, 323 (1996).
(7) H. Loninger and K. Varmuza, Anal. Chem. 59, 236 (1987).
(8) F.W. McLafferty and F. Tureck, Interpretation of Mass Spectra (University Science Books, Salsalito, California, 1993).
(9) D.C. Hilton, J. Cochran, and T. Veriotti, Analysis of Pesticide Residues in Citrus Oils by GCxGC-TOFMS with Minimal Sample Preparation; Pittcon 2006.

Trending on Spectroscopy: The Top Content of 2024
December 30th 2024In 2024, we launched multiple content series, covered major conferences, presented two awards, and continued our monthly Analytically Speaking episodes. Below, you'll find a selection of the most popular content from Spectroscopy over the past year.
Best of the Week: Hyperspectral Imaging, ICP-MS Analysis of Geological Samples, Product Roundup
October 18th 2024Top articles published this week include an article about hyperspectral imaging in human skin research, a peer-reviewed article about analyzing geological samples using atomic spectroscopy techniques, and an equipment roundup piece about the latest products in the industry.