Chemometrics in Spectroscopy - Linearity in Calibration: Other Tests for Non-Linearity
This third part in a series on non-linearity looks at other tests and how they can be applied in laboratories that must meet FDA regulations.
This third part in a series on non-linearity looks at other tests and how they can be applied in laboratories that must meet FDA regulations.
We continue here what our last column started (1): discussions of other ways to test data for non-linearity. We'll begin by reviewing what we want to test. FDA/ICH guidelines, starting from a univariate perspective, considers the relationship between the actual analyte concentration and what they generically call the "test result," a term that is independent of the technology used to ascertain the analyte concentration. This term therefore holds good for every analytical methodology from manual wet chemistry to the latest high-tech instrument. In the end, even the latest instrumental methods have to produce a number, representing the final answer for that instrument's quantitative assessment of the concentration, which is the test result from that instrument. This is a univariate concept to be sure, but the same concept that applies to all other analytical methods. Things might change in the future, but currently this is the way analytical results are reported and evaluated.

The question to be answered, then, is that for any given method of analysis, is the relationship between instrument readings (test results) and the actual concentration linear?
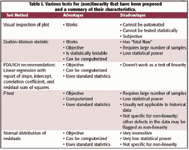
Three tests of this characteristic were discussed in previous columns on this topic — the FDA/ICH recommendation of linear regression with a report of various regression statistics, visual inspection of a plot of test results versus the actual concentrations, and use of the Durbin-Watson statistic. Because we analyzed these tests previously we will not discuss them further here, but a summary is provided in Table I, along with other tests for non-linearity that we explain and discuss in this column.
We now proceed to present various linearity tests that can be found in the statistical literature.
F-Test
Figure 1 shows a schematic representation of the
F
-test for linearity. Note that there are some similarities to the Durbin-Watson test. The key difference between this test and the Durbin-Watson test is that in order to use the
F
-test as a test for (non)linearity, you must have measured many repeat samples at each value of the analyte. The variabilities of the readings for each sample are pooled, providing an estimate of the within-sample variance. This is indicated by the label "Operative difference for denominator." By analysis of variance, we know that the total variation of residuals around the calibration line is the sum of the within-sample variance (
S
2
within
) plus the variance of the means around the calibration line. Now, if the residuals truly are random, unbiased, and in particular if the model is linear, then we know that the means for each sample will cluster randomly around the calibration line, and that their variance will equal
S
2
within
/
n
1/2
(indicated by the label "Operative difference for numerator"). The ratio of these two variances will be distributed as the F-distribution, with an expected value of unity. If there is non-linearity, such as is shown in Figure 1, then the variance corresponding to the means will be inflated by the systematic offset of each sample, and the computed F-ratio will be statistically significantly larger than unity.

Table I. Various tests for (non)linearity that have been proposed and a summary of their characteristics.
This test thus shares several characteristics with the Durbin-Watson test. It is based on well-known and rigorously sound statistics. It is amenable to automated computerized calculation and suitable for automatic operation in an automated process situation. It does not have the "fatal flaw" of the Durbin-Watson statistic.
On the other hand, it shares some of the disadvantages of the Durbin-Watson statistic. It also is based upon a comparison of variances, so that it is of low statistical power. It requires many more samples and readings than the Durbin-Watson statistic, because each sample must be measured many times. In general it is not applicable to historical data, because the data must have been collected using the proper protocols, and rarely are so many readings taken for each sample as this test requires. It also is not specific for non-linearity. Outliers, poorly fitting models, bias, or error in the reference values, or other defects of the data can appear to be non-linearity.

Figure 1. Schematic representation of the residuals of the F-test.
Normality of Residuals
In a well-behaved calibration model, residuals will have a normal (that is, Gaussian) distribution. In fact, as we have previously discussed, least-squares regression analysis also is a maximum likelihood method, but only when the errors are normally distributed. If the data does not follow the straight line model then there will be an excessive number of residuals with too-large values, and the residuals then will not follow the normal distribution. It follows, then, that a test for normality of residuals also will detect non-linearity.
Over time, statisticians have devised many tests for the distributions of data, including one that relies on visual inspection of a particular type of graph. Of course, this is no more than the direct visual inspection of the data or of the calibration residuals themselves. However, a statistical test also is available — the χ2 test for distributions, which we have described previously. This test could be applied to the question, but shares many of the disadvantages of the F-test and other tests. The main difficulty is the practical one: this test is very insensitive and therefore requires a large number of samples and a large departure from linearity in order for this test to be able to detect it. Also, like the F-test it is not specific for non-linearity, false positive indication can be triggered by other types of defects in the data.
We continue in our next column with an explanation of a new test that has been devised, which overcomes the limitations of the various tests we already have described.
Reference
1. H. Mark and J. Workman,
Spectroscopy
20
(3), 34-39 (2005).
Jerome Workman Jr. serves on the Editorial Advisory Board of Spectroscopy and is director of research, technology, and applications development for the Molecular Spectroscopy & Microanalysis division of Thermo Electron Corp. He can be reached by e-mail at: jerry.workman@thermo.com.

Jerome Workman Jr.
Howard Mark serves on the Editorial Advisory Board of Spectroscopy and runs a consulting service, Mark Electronics (Suffern, NY). He can be reached via e-mail at: hlmark@prodigy.net.

Howard Mark

Best of the Week: AI and IoT for Pollution Monitoring, High Speed Laser MS
April 25th 2025Top articles published this week include a preview of our upcoming content series for National Space Day, a news story about air quality monitoring, and an announcement from Metrohm about their new Midwest office.
LIBS Illuminates the Hidden Health Risks of Indoor Welding and Soldering
April 23rd 2025A new dual-spectroscopy approach reveals real-time pollution threats in indoor workspaces. Chinese researchers have pioneered the use of laser-induced breakdown spectroscopy (LIBS) and aerosol mass spectrometry to uncover and monitor harmful heavy metal and dust emissions from soldering and welding in real-time. These complementary tools offer a fast, accurate means to evaluate air quality threats in industrial and indoor environments—where people spend most of their time.
Smarter Sensors, Cleaner Earth Using AI and IoT for Pollution Monitoring
April 22nd 2025A global research team has detailed how smart sensors, artificial intelligence (AI), machine learning, and Internet of Things (IoT) technologies are transforming the detection and management of environmental pollutants. Their comprehensive review highlights how spectroscopy and sensor networks are now key tools in real-time pollution tracking.
New AI Strategy for Mycotoxin Detection in Cereal Grains
April 21st 2025Researchers from Jiangsu University and Zhejiang University of Water Resources and Electric Power have developed a transfer learning approach that significantly enhances the accuracy and adaptability of NIR spectroscopy models for detecting mycotoxins in cereals.