A Common Sense Laboratory Guide to Reducing Errors and Contamination in ICP and ICP-MS Analysis
Technology in the manufacture of instruments has evolved by leaps and bounds in the past few decades. The capability of these instruments to measure and quantify concentration at picogram levels has made the analyst more aware of trace contaminants unintentionally introduced during analysis. By raising awareness of contamination issues and sources, it is hoped that analysts can take an active role in reducing error in their ICP and ICP-MS analyses.
Chemical reference standards have been an important component in accurate analysis for decades. Over the years, the challenges facing chemical laboratories have changed. As a manufacturer of certified reference materials (CRMs), many questions have arisen during our daily interaction with customers on how to best use CRMs.
Questions regarding contamination come from our customers in many forms and on a regular basis. Sometimes the customer is not even aware the issue is about contamination at all. Often a customer will call and express a concern that their standard is too high in particular elements and during the conversation our scientists discover that the customer is inadvertently allowing contamination into their analysis.
In the spirit of communication and education we asked our chemists what they would like CRM customers to know about using reference materials. The chemist responses fell into two categories: cleanliness and contamination, and sample and standard preparation and analysis.
Cleanliness and Contamination
Modern instrumentation has raised the bar or in this case lowered the limits of detection to the parts-per-billion or even parts-per-trillion levels. The concept of such small measurements would have been almost inconceivable during the emergence of modern laboratory analysis. If we express 1 ppb in terms of units of time, it would be 1 s in 32 years! And 1 ppt would be 1 s in 320 centuries! In the past, issues of laboratory contamination were problematic but now contaminants — even in trace amounts — can severely alter analytical results. It is hard to imagine that such small of amounts of contamination can dramatically change laboratory values.
Most questions about contamination come to us as an inquiry of a particularly high result for some common contaminant. In most cases the root of that contamination can be traced to a common source. The most common sources of standard and sample contamination are water, acids, labware, sample preparation, laboratory environment, and storage.
Water
In the laboratory, water is one of the most basic yet most essential components. Most scientists are aware that the common perception that all water is the same is untrue. There are many types, grades, and intended uses for water. The confusion starts when laboratories are unsure about which type of water they get from their water filtration system.
ASTM has guidelines that designate different grades of water. Table I shows parameters for the four ASTM types of water.

Table I: Parameters of ASTM water types
The actual type of water produced by a commercial laboratory water filtration system can vary in pH, solutes, and soluble silica. High quality standards should always be made with the water that contains the least amount of total matter possible.
Analysts who use CRMs and perform quantitative analysis should use the highest purity of water for the dilution of their standards and samples. The highest quality standard can be contaminated by poor quality water.
Acids
Often we are asked if high purity acids are necessary in sample preparation if the laboratory is using a high quality inductively coupled plasma–mass spectrometry (ICP-MS)-grade CRM. Clean acids used in sample preparation, digestion, and preservation can be very costly. But, the difference between the amounts of contamination in a low purity acid and a high purity acid can be dramatic. High quality standards for use in parts-per-billion and parts-per-trillion analyses use the highest purity acids available to reduce all possible contamination from the acid source. An example of potential contamination is an aliquot of 5 mL of acid containing 100 ppb of Ni as contaminant, used for diluting a sample to 100 mL can introduce 5 ppb of Ni into the sample.
Our advice has always been to use the high purity acids to dilute and prepare standards and samples when possible. In addition to using pure acid it is important that the chemist check the acid's certificate of analysis to identify the elemental contamination levels present in the acid. Some laboratories prefer to use blank subtractions to negate the background contamination, but blank subtraction for acids can only work in a range well over the instrumental level of detection. If blank subtraction causes an analytical result to fall below the instrument's level of detection, it should not be used.
Labware
Inorganic analysts know that glassware is a source of contamination. Even clean glassware can contaminate samples with elements such as boron, silicon, and sodium. If glassware, such as pipettes and beakers, are reused, the potential for contamination escalates.
A study was made of residual contamination from our pipettes after being manually and automatically cleaned using a pipette washer.
An aliquot of 5% nitric acid was drawn through a 5-mL pipette after the pipette was manually cleaned according to standard procedures. The aliquots were analyzed by ICP-MS. The results showed significant residual contamination still persisted in the pipettes despite a thorough manual cleaning procedure.
The experiment was repeated using a pipette washer especially made for use in parts-per-trillion analysis. The pipette washer repeated forced deionized water through the pipettes for a set time period. The pipettes were cleaned in the pipette washer then the same aliquot of 5% nitric acid was drawn through the 5-mL pipettes. The aliquot was analyzed by ICP-MS. The automated washer reduced the contamination significantly over manual cleaning of the pipettes (Table II).

Table II: Comparison of contamination levels in pipettes cleaned in a manual procedure versus a pipette washer
The reduction of contamination by moving from manual cleaning to an automated cleaning process of our laboratory pipettes was clear. High levels of contamination of sodium and calcium (almost 20 ppb) dropped to <0.01 ppb.
We suggest the following tips to help monitor or reduce contamination of samples and standards due to labware:
- Use fluorinated ethylene propylene (FEP) or quartz containers and minimize contact with borosilicate glass.
- Separate labware into high and low level use.
1. High level use is for standards or samples above 1 ppm concentrations.
2. Low level use is for standards or samples with less than 1 ppm concentrations.
- Segregate labware for specific metals that may create a memory effect in the glassware or labware.
1. Metals such as Pb and Cr are highly absorbed by glass but not by plastics.
2. For B and Si, avoid borosilicate glass.
3. Samples containing low levels of Hg (parts-per-billion levels) must be stored in glass or fluoropolymer because Hg vapors diffuse through polyethylene bottles.
- Rinse and store volumetric vessels with deionized water.
Sample Preparation and Handling
After a laboratory starts to prepare samples or CRMs for testing a whole new set of contamination worries can develop from the various sample preparation techniques (open vessel digestion, microwave digestion) and the materials and apparatus the samples come into contact with during preparation.
Microwave vessels can leach contaminants from previous samples or from the containers themselves. Open digestions have potential for environmental contamination. The more steps a sample or CRM has to go through in the testing and analysis process, the more potential there is for error and contamination.
Some laboratories may use tubing during routine analysis or sample preparations. The materials of these various tubings have different contaminants and levels of contamination.
We looked at potential contamination arising from the various types of tubing used in the laboratory using both water and dilute nitric acid as solvents. The different types of common tubing each had different levels of elemental contamination. Silicon tubing had obviously higher levels of silicon contamination, especially in the presence of nitric acid. Silicon tubing also had high amounts of aluminum, iron, and magnesium. Neoprene tubing on the other hand showed contamination from zinc in samples with and without acid (Table III).
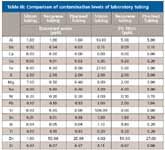
Table III: Comparison of contamination levels of laboratory tubing
To help reduce contamination due to sample preparation techniques, we have the following tips:
- Open standards under a hood or in a clean room environment.
- Rinse the outside of the CRM container with deionized water before opening to remove any surface contamination.
- Recap CRMs quickly to reduce contamination.
- Only use CRMs with current expiration dates.
- Matrix-match your CRMs to your samples.
- Use standard addition to compensate for matrix differences.
- Do not expect lower quality standards to replace the need for higher quality (lower contamination) standards.
- Prepare dilutions in plastic or FEP.
- Perform dissolution in metal-free clean hoods.
- Use high pure reagents and acids.
1. Ammonium hydroxide and nitric acid are relatively clean.
2. Hydrochloric acid can have high impurities.
- Rinse pump tubing with high purity acids matched with the matrices of the instrument.
Laboratory Environment and Personnel
All laboratories believe they observe a level of laboratory cleanliness. Most chemists recognize that there are inherent levels of contamination present in all laboratories. A common belief is that the small amounts of environmental and laboratory contamination cannot truly change the analytical results. To test the background level of contamination in a typical laboratory we distilled nitric acid in both a regular laboratory and in a clean-room laboratory with special air handling systems (HEPA filters). The nitric acid distilled in the regular laboratory had high amounts of aluminum, calcium, iron, sodium, and magnesium contamination. The acid distilled in the clean room showed significantly lower amounts of most contaminants (Table IV).
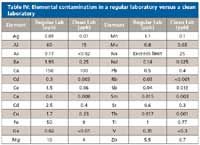
Table IV: Elemental contamination in a regular laboratory versus a clean laboratory
Laboratory air also can contribute to contamination of samples and standards. In looking at some common air contaminants in the laboratory we analyzed the air particulates from three laboratory environments including an "ordinary" laboratory, a clean hood, and a clean room. The "ordinary" laboratory had high amounts of iron and lead contamination. The samples taken from the clean hood showed significantly less contamination but there still was enough contamination to potentially affect analytical results. The lowest levels of contamination were found in the HEPA-filtered clean room.
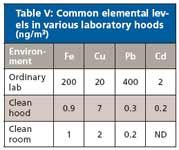
Table V: Common elemental levels in various laboratory hoods (ng/m3)
Common sources of air and particulate matter contamination are from surfaces and building materials such as ceiling tiles, paints, cements, and dry wall. Surface contaminants can be found in dust and rust on shelves, equipment, and furniture. The heating and cooling systems can move the contaminants into the air and into the samples. Office products can produce elemental contamination in the lint from paper products, office toners, and solvents.
Laboratory personnel can add their own contamination from lab coats, makeup, perfume, and jewelry. Aluminum contamination can come from lab glassware, cosmetics, and jewelry. Many other common elements can be brought in as contamination from lotions, dyes, and cosmetics. Even sweat and hair can cause elevated levels of sodium, calcium, potassium, lead, magnesium, and many ions. If a laboratory is seeing a usually high level of cadmium in the samples it could be from cigarettes, pigments or batteries. If the levels of lead are out of range, contamination can be from paint, cosmetics, and hair dyes. Table VI shows potential sources of common elemental contamination from outside products.

Table VI: Common sources of elemental contamination
To deal with laboratory-based contamination we suggest the following tips:
Laboratory Personnel
- Wear powder-free gloves. Powder in the powdered gloves contains high concentrations of zinc.
- No jewelry, cosmetics, or lotions.
1. Cosmetics and lotions can introduce the contaminants Al, Be, Ca, Cu, Cr, K, Fe, Mn, Ti, and Zn.
2. Some hair dyes contain lead acetate and eye makeup may contain Hg as a preservative.
3. Calamine lotion used for skin irritations contains ZnO.
Laboratory Conditions
- Clean work surfaces. Use deionizedwater to wipe down all work surfaces.
- Keep laboratory humidity to 50% or more to reduce electrostatic charge. Allowing an ethanol-soaked laboratory wipe to evaporate in the laboratory will reduce static charge.
- Eliminate surface charges when possible.
- Check hoods and clean-rooms for particulate matter.
- Observe clean laboratory procedures and techniques.
Storage
After the testing and analysis is done, the CRMs and samples are often stored until needed again. It is always important to know the best conditions for storage for the standard. The expiration dates on most CRMs reflect the manufacturer's confidence level of continued accuracy at proper storage conditions for the shelf life listed on the product. If a CRM is not stored properly, its quality and accuracy can be affected. Elements within the packaging can slowly be leached over time and change the value of the samples or standards. Some of the common packaging elements were examined in samples at the time of manufacturing and bottling and again after one year to determine if the packaging contributed to the contamination of the samples over time. After one year, the amounts of common elements such as aluminum, calcium, iron, magnesium, sodium, and silicon more than doubled in the solutions. Table VII shows the changes of elemental concentrations in six common elements after a year's storage.
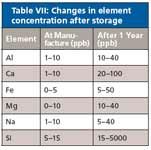
Table VII: Changes in element concentration after storage
As demonstrated by our study of solutions after a year's storage, the storage container of standards and samples can cause ongoing deterioration or contamination. Contaminants in the bottle materials can leach from the container into the sample or standard. Table VIII lists the summary of average element content from technical data from a study by Nalge. The highest total contamination was found in high density polyethylene (HDPE) and the lowest total contamination levels were found from polystyrene and FEP containers. However, we found lot-to-lot variation in the resin polymer used by the manufacturers of FEP bottles making it unsuitable for storing parts-per-trillion and parts-per-billion solutions. A further acid leaching or cleaning of bottles should be employed to counter the effect of impurities leaching from the container.
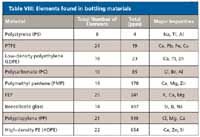
Table VIII: Elements found in bottling materials
Sample/Standard Preparation and Analysis
The process of preparing and analyzing samples is another potential point for introduction of contaminants or errors. Our analysts had the following tips about how to monitor and reduce contamination and errors during analysis:
- Determine your laboratory contamination level by running blanks.
- Carry blanks through all steps of an analytical procedure.
- Make up calibration standards at the time of sample preparation.
- Spike appropriate QC samples with expected levels of analytes or use standard additions.
Even with clean laboratory practices in place, erroneous results can often find their way into sample analysis. To eliminate some of these spurious results, replication of blanks and sample dilutions can be employed. The blank results should be averaged and the sample run values can either be minimally selected or averaged. The difference between the two values can then be plotted against a curve established against two more standards. A minimum of two standard points can be used if the chance of contamination is minimal, such as in the case of rare or uncommon elements. Additional standard points should be considered if the potential for contamination is high with common elements such as aluminum, sodium, and magnesium. Multiple aliquots of blanks and dilutions can also be employed to further minimize analytical uncertainty.
General Principles and Practices
Laboratories should follow a general regime of three runs each of wash/rinse runs, blank runs, and sample runs, as well as single runs of sample plus spike, and standard or spike runs without sample to use as a control solution to evaluate recovery.
One of the largest sources of problems and errors in analysis is the sample introduction system. When erroneous results occur it is always the first step to examine the sample introduction system for errors or contamination.
The second biggest problem in accurate measurement is matrix. The matrix is everything that is present in the sample excluding the elements of interest. The matrix includes the acid concentration adjustments, the residue of the sample preparation process, and other elements in the sample excluding target elements. The CRMs should be adjusted to match the matrix of the sample.
The third problem that occurs to produce erroneous results are the spectral interferences. The correct line and background selection is needed and sometime mathematical corrections can be used to reduce interferences.
Analysts must realize that the cleanliness and accuracy of their procedures, equipment, and dilutions affect the quality of the standards and samples. Many laboratories will dilute CRMs to use across an array of procedures and techniques. This in-house dilution of CRMs can be a savings to the laboratory but in the final analysis can be a source of error and contamination.
CRM manufacturers design standards for particular instruments to obtain the highest level of accuracy and performance for that technique. They also use calibrated balances, glassware, and instruments to ensure the most accurate standards are delivered to customers. Certifications such as ISO 9000, ISO 17025, and Guide 34 assure customers that procedures are being followed to ensure quality and accuracy in those standards. After those CRMs are in chemists' hands, it is then their responsibility to employ all possible practices to keep their analysis process free from contamination and error.
Patricia Atkins, Laszlo Ernyei, Vanaja Sivakumar, and Ralph Obenauf are with SPEX CertiPrep, Metuchen, New Jersey.

High-Speed Laser MS for Precise, Prep-Free Environmental Particle Tracking
April 21st 2025Scientists at Oak Ridge National Laboratory have demonstrated that a fast, laser-based mass spectrometry method—LA-ICP-TOF-MS—can accurately detect and identify airborne environmental particles, including toxic metal particles like ruthenium, without the need for complex sample preparation. The work offers a breakthrough in rapid, high-resolution analysis of environmental pollutants.
Trending on Spectroscopy: The Top Content of 2024
December 30th 2024In 2024, we launched multiple content series, covered major conferences, presented two awards, and continued our monthly Analytically Speaking episodes. Below, you'll find a selection of the most popular content from Spectroscopy over the past year.