Considerations of Grating Selection in Optimizing a Raman Spectrograph
The physics that determine how gratings and spectrographs work are summarized in simple terms for new users of Raman equipment.

The performance of a Raman spectrograph for a particular application will depend, among other things, on its sensitivity and spectral resolution. The sensitivity will determine how long it will take to record a spectrum with a given signal-to-noise ratio. In turn, the grating reflectivity will determine the optical throughput of the instrument. The spectral resolution will determine how easy it will be to extract subtle information from a spectrum. The spectral resolution is determined by the focal length of the spectrograph and the groove density of the grating used to disperse the light, and will also affect the apparent sensitivity. Note that in many cases, spectral resolution may be improved at the expense of sensitivity. Because many new users of Raman equipment are not familiar with these grating–spectrograph properties, we thought it would be useful to summarize the physics, in simplistic terms, that determine how the instruments work.
Over the past 20 years Raman spectroscopy has gained popularity because instrumental innovations have made it easier to use them for problem-solving, providing spectra in 1% of the time that it took prior to the Raman revolution following the introduction of the holographic notch filters. In addition, new graduates of chemistry and materials science are taking jobs in industry without any graduate education in spectroscopy or the operation of spectroscopic instrumentation. Consequently, the new user is faced with myriad choices in configuring a new instrument or in optimizing an existing instrument for a given experiment. Understanding how the spectrograph core of a Raman instrument works will aid the novice in producing quality, defensible results for solving industrial problems or characterizing new materials.
Spectrograph Design
A spectrograph is designed to accept light with many wavelengths, separate the wavelengths in space, and then "detect" each wavelength on a multichannel detector, which today is synonymous with a charge-coupled device (CCD). Figure 1 is a schematic of a spectrograph.
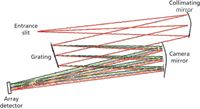
Figure 1: Schematic of a dispersive Raman spectrograph.
Figure 1 shows a typical Raman spectrograph. The collected Raman light is focused onto an entrance slit. After passing the slit, it diverges until it reaches a concave mirror whose focal length corresponds to the distance between the mirror and slit; after being reflected by the mirror, the light is "collimated." When the light hits the grating, which is an array of finely spaced lines on a reflective surface, there is constructive and destructive interference, which is wavelength and angle dependent. Consequently, each wavelength is reflected at a different angle (1). As each wavelength is then reflected from the camera mirror onto the array detector (CCD), it is focused at a different position on the array. The wavelength of the light on each array pixel can then be calculated from the known equations of grating physics, as shown in Figure 2 (2).
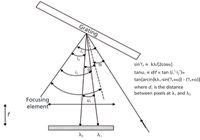
Figure 2: Schematic showing how a pixel position is converted to a wavelength.
It is not the purpose of this article to derive the equations that determine the conversion, but only to indicate to the new user the origin of the "magic" inside the software that enables the spectral "image" on the camera to be converted to a spectrum, that is, a plot of intensity (counts or counts/s) versus Raman shift (cm-1). The physical quantities determining the separation on the camera of two wavelengths will be the incident angle of the light on the grating, the diffracted angles, as determined by these equations, and the focal length of the focusing element (2). When a Raman instrument is designed, the spectral dispersion at a given wavelength is selected, and then the angles and focal length are calculated to produce the desired result. In addition, there is optical software that enables asymmetrizing the geometry so that the images are kept as tight as possible on the surface of the detector, which, of course, is flat.
Of course, the Raman spectrum is only meaningful when the wavelength values are converted to Raman shift units, also in the software, according to equation 1:

where ν is derived from λ according to equation 2:

Typical widths of lines in a Raman spectrum are between 1 and 10 cm-1 full width at half maximum (FWHM). If parameters are selected that produce 1 cm-1/pixel, then about 1000 cm-1 can be covered on a CCD that has 1024 pixels in the long direction, which is the spectral dispersion direction. In principle, the selection of the grating would be straightforward, but as we will see, there are important characteristics that have to be acknowledged in the choice.
Just to get oriented to these effects, examine the behavior shown in Figure 3 of the 155 cm-1 line of sulfur that was recorded with the 633-nm line of a HeNe laser on instruments whose focal length varied between 150 mm and 1920 mm. Depending on the goal of the measurement, it may or may not be important to resolve the components in the spectrum; how much will be necessary to resolve will determine the selection of gratings as will be discussed in the following sections.
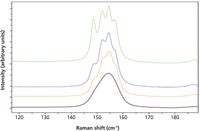
Figure 3: 155 cm-1 line of crystalline sulfur recorded with instruments whose focal length varied between 1920, 640, 460, and 250 mm (from top to bottom). (Courtesy of Sergey Mamedov of Horiba Scientific.)
Grating Characteristics
The important grating characteristics that have to be matched with the desired instrument characteristics are
- the dispersion, which is a result of the groove density (g/mm) and focal length, and
- the reflectivity, which is a complicated function of the groove density, the groove profile (including the blaze angle), the angle at which the grating is used, and the metallic coating (3,4).
Dispersion
It is important to recognize that because the relevant x-axis units in a Raman spectrum are cm-1, the dispersion is wavelength dependent, which will be illustrated in Figures 4a and 4b. Figures 4a and 4b, respectively, show dispersion curves for the same gratings in a 300-mm focal length spectrograph, in terms of nm and cm-1.
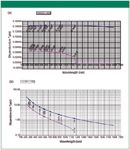
Figure 4: Dispersion in (a) nm/pixel and (b) cm-1/pixel for an 1800- and 600-g/mm grating in a 300-mm focal length spectrograph.
We first examine the dispersion in wavelength units (nm/pixel). The dispersion curve for the 600-g/mm grating over the entire range shown (200–1775 nm) is almost flat, varying between 0.144 and 0.138 nm/pixel. On the other hand the behavior of the other grating is quite different. For all values of λ > 1080 nm, the dispersion is pinned to 0 nm/pixel. At these long wavelengths, a grating with this value for the groove density will not diffract. To put it another way, at about 1080 nm the light exits the grating at a grazing angle and the diffraction angle for any longer wavelengths will be imaginary. In addition, over the usable range of the grating the dispersion is more or less flat between 200 and 600 nm, after which the dispersion decreases at an accelerating rate. But all of these dispersion values are in nm/pixel, and what we really want is cm-1/pixel, which is shown in Figure 4b. To understand why these curves are so different, we need to calculate cm-1/Å which has a conversion factor of -1/λ2. Table I illustrates how rapidly this factor is changing with wavelength.

Table I: Dispersion in cm-1/Ã as a function of wavelength
Inspection of Figure 4b indicates that the dispersion in cm-1/pixel is changing rapidly for both gratings. If one is configuring a system for ~3 cm-1/pixel in the red (λ~ 600 nm), a 600-g/mm grating will work quite fine, but if there will be a laser emitting near 400 nm, the 1800-g/mm grating would provide better dispersion.
Note that these curves are specific for a particular focal length mono. In Figures 5a and 5b we compare a 300-mm focal spectrograph to an 800-mm focal spectrograph. An important point to note is that the long wavelength termination is the same in both systems because it is determined by the angle for grazing exit diffraction, an inherent property of each grating, not the focal length of the spectrograph in which the grating is being used.
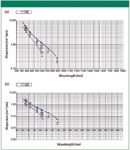
Figure 5: Dispersion in cm-1/pixel of 2400- and 3600-g/mm gratings mounted in (a) a 300-mm focal length spectrograph and (b) an 800-mm focal length spectrograph.
Aside from the fact that the long wavelength cut-offs are the same in the two systems, it is also important to note that the range of use for these gratings is somewhat limited in the visible part of the spectrum. The 2400-g/mm grating will diffract out to almost 800 nm, but the 3600-g/mm grating will not diffract much beyond 500 nm. These gratings are, in fact, usually used in the blue and UV part of the spectrum where their dispersion is so much better than that of lower groove density gratings. Table II enables an easy comparison of the dispersion per pixel at 300 nm for the two gratings in the two systems.
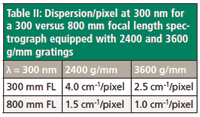
Table II: Dispersion/pixel at 300 nm for a 300 versus 800 mm focal length spectrograph equipped with 2400 and 3600 g/mm gratings
Keeping in mind that the sharpest feature that can be observed has a half width of 2 pixels, one can see how a short focal length instrument can begin to limit what can be differentiated when exciting in the UV. If we go to an even shorter wavelength, the limiting resolution on a short focal length system will probably not be adequate for many studies, as shown in Table III.
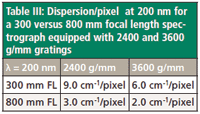
Table III: Dispersion/pixel at 200 nm for a 300 versus 800 mm focal length spectrograph equipped with 2400 and 3600 g/mm gratings
For the reader interested in a more detailed, but practical explanation of how a spectrograph functions, it can be found in The Optics of Spectroscopy (2).
Reflectivity
The grating reflectivity is a complicated function of the groove shape and spacing, and the polarization of the light hitting the grating. The article cited earlier (3) describes in detail the physics determining the grating behavior. Until the middle of the last century, at about the time when lasers became available, gratings were produced by cutting a metal surface with a diamond-tipped ruling engine. Such equipment produced flat facets on the grating. Within a few years of the introduction of the laser it was recognized that it is possible to produce gratings by exposing surfaces coated with photoresist to interfering laser beams. Major advantages of gratings produced with this technology included a virtual elimination of grating ghosts arising from defects in the ruling engine, and much higher groove densities. What was perhaps not recognized with the earliest gratings was that the quasi-sinusoidal groove profile produced by the holographic process exaggerated the ripples in the reflectivity curves called Wood's anomalies. However, the subsequent use of ion etching provided a means to engineer the profile to produce high reflectivity in the region of interest (4).
Figure 6 shows the reflectivity curve for an 1800-g/mm holographic grating that has been optimized for use between 450 and 850 nm. There are three curves on this figure. The green curve is labeled TM and shows the reflectivity for light polarized perpendicular to the grooves of the grating. The red curve is labeled TE and has been measured with light polarized parallel to the grooves. The blue curve is the average of the two and represents unpolarized light. Note that equipment manufacturers often select a grating where the TM curve is higher in the region of interest. But, if the user is aware of the grating properties and what kind of polarization the sampling is presenting, a grating can be used on the short wavelength side of the cross-over between TE and TM. For this grating the ripples that were mentioned above appear between 300 and 425 nm. In most cases they will not present a problem to the spectroscopist, but an instrument response correction will eliminate all wavelength-dependent sensitivities.

Figure 6: Efficiency curve for an 1800-g/mm grating.
The holographic 1200-g/mm grating presented a surprise when it first appeared. The groove density was convenient for the desired dispersion, but it was implemented before severe problems in the Wood's anomalies were observed. The original non-optimized holographic grating had an extremely sharp anomaly where the reflectivity dropped to essentially 0% near 650 nm. Apparently, the groove profile and diffraction angle were such that all the diffracted light grazed off the grating at a particular wavelength. But this was subsequently corrected by optimizing the groove profile for wavelengths of interest; the optimization had the effect of softening the anomaly and moving it to other wavelength regions. Figure 7 shows the efficiency profiles for several 1200-g/mm gratings that have been optimized for different wavelengths. Visual inspection illustrates how effectively the ion-etching has optimized the reflectivity for different wavelength regions. But it should be noted that all three of these gratings still have the anomaly near 650 nm, which represents about a 10% drop in intensity.
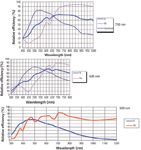
Figure 7: Reflectivity curves for three 1200-g/mm gratings optimized for different regions of the spectrum. The top grating has been optimized for 750 nm, the middle grating for 630 nm, and the bottom for 500 nm.
Comparison of Spectra Recorded with Different Gratings
After all this somewhat theoretical discussion it would probably be appropriate to illustrate the effects of selecting different gratings for a measurement. Figure 8 shows the spectrum of a slightly fluorescent paper recorded with 300-, 600-, 1200-, and 1800-g/mm gratings on the Aramis (460-mm focal length) using the 532-nm laser. The top of Figure 8 shows the spectrum, as recorded with the different gratings. The middle of the figure shows the same spectrum after the removal of the baseline. The bottom of the figure shows a smaller region of the middle figure to better estimate the relative intensities and to visualize the noise. First, I want to point out that I recorded the spectra with acquisition times meant to compensate for the differences in photon flux per pixel that follows from the differences in dispersion with the various gratings. Because there are other factors effecting the intensities (such as grating reflectivity and aperture at which the grating is being used), this adjustment in acquisition time does not totally compensate for the differences in dispersion. But what is potentially more interesting is the change in relative intensity with dispersion. For instance, Table IV shows the changes in intensities of the lines at ~1080 and ~1600 cm-1 as a function of groove density. The fact that the band intensities are increasing at different rates is a result of the different bandwidths, and the fact that one band actually is composed of overlapping components; as the dispersion decreases each pixel is integrating a greater number of wavenumbers.

Table IV: Approximate change in intensities of a sharp (~1080 cm-1) and somewhat broad band (~1600 cm-1) as a function of grating groove density
This can have some rather interesting implications for the fluorescence background. Inspection of the top of Figure 8 indicates that the background increases by more than a factor of 10-fold when comparing the 1800-g/mm spectrum to that of the 300-g/mm spectrum! In addition, when there is such a high background it becomes difficult to differentiate between weaker Raman features and artifacts in the background. The background-subtracted spectra in Figure 8 illustrate this point because a simple background subtraction cannot eliminate the random and pattern noise in the background.

Figure 8: Raman spectra of slightly fluorescent paper recorded with 532-nm laser on the Aramis (460 mm focal length), using 300-, 600-, 1200-, and 1800-g/mm gratings, adjusting the integration times to scale with the groove density (1, 2, 4, and 6 s). Top, as recorded; middle, after baseline subtraction, with vertical displacement for clarity; bottom, after baseline subtraction, expanded region.
Comments
I should point out that Figure 8 shows that complete spectra were recorded for all gratings. That means that even though a particular grating–laser combination will provide X cm-1 in a single shot, the full spectra were recorded by scanning the entire range of interest — in this case, 100–4000 cm-1. That means that there is no loss in capability when using a high groove density grating for higher spectral resolution. This figure also shows that the broad background does not scale with the same factor as a sharp band when changing grating (that is, dispersion). We were previously aware that the ratio of a sharp to broad band would change when the dispersion of the recording instrument is changed, but were surprised to see the same effect on the ratio of sharp band to (very) broad background. What this means is that when recording spectra of not-so-clean samples, the expected sensitivity advantage from recording low resolution spectra may be cancelled by the rapid increase in background! While it is always possible to subtract the background levels, the noise does not subtract, as can be seen in the middle and bottom traces in Figure 8. It would be wise to keep this in mind when dealing with samples with interfering backgrounds — it is always best to use conditions that will enable collecting spectra without a background rather than try to deal with it after-the-fact. For those interested in this point, we expect to deal with this more fully sometime in the near future.
Summary
This column has been written to enable the analyst who is new to spectroscopy to understand what the considerations are in choosing a grating or focal length for a Raman spectrograph. Maybe you do not understand all of the grating physics that determines the grating functionality, but you should at least understand what parameters the choice of grating will optimize. Of course, the selection of laser wavelengths is independent of this, and actually has to happen before an intelligent choice of gratings can be made. I would love to hear from any of you about how useful this has been.
Acknowledgments
My thanks to Emmanuel Leroy of Horiba Scientific for the Excel program that provides the capability to plot instrumental dispersions for various grating–spectrograph focal length combinations. The ability to present these plots helps to clarify what is happening. The grating reflectivity plots come from Horiba Scientific grating catalog (4).
References
(1) M. Born and E. Wolf, Principles of Optics – Electromagnetic Theory of Propagation, Interference and Diffraction of Light, 5th Edition (Pergamon Press, Oxford 1975), Chapter VIII.
(2) J.M. Lerner and A. Thevenon, The Optics of Spectroscopy, A Tutorialhttp://www.horiba.com/us/en/scientific/products/optics-tutorial/.
(3) E.G. Loewen, M. Nivière, and D. Maystre, Appl. Opt. 16(10), 2711–2721 (1977).
(4) Scientific Diffraction Gratings/Custom Gratings – Product Catalog and Capabilities – available by contacting Horiba Scientific.
Fran Adar is the Principal Raman Applications Scientist for Horiba Scientific (Edison, New Jersey). She can be reached by e-mail at fran.adar@horiba.com

Fran Adar

AI-Powered SERS Spectroscopy Breakthrough Boosts Safety of Medicinal Food Products
April 16th 2025A new deep learning-enhanced spectroscopic platform—SERSome—developed by researchers in China and Finland, identifies medicinal and edible homologs (MEHs) with 98% accuracy. This innovation could revolutionize safety and quality control in the growing MEH market.
New Raman Spectroscopy Method Enhances Real-Time Monitoring Across Fermentation Processes
April 15th 2025Researchers at Delft University of Technology have developed a novel method using single compound spectra to enhance the transferability and accuracy of Raman spectroscopy models for real-time fermentation monitoring.
Nanometer-Scale Studies Using Tip Enhanced Raman Spectroscopy
February 8th 2013Volker Deckert, the winner of the 2013 Charles Mann Award, is advancing the use of tip enhanced Raman spectroscopy (TERS) to push the lateral resolution of vibrational spectroscopy well below the Abbe limit, to achieve single-molecule sensitivity. Because the tip can be moved with sub-nanometer precision, structural information with unmatched spatial resolution can be achieved without the need of specific labels.