Data-Driven Raman Spectroscopy in Oil and Gas: Rapid Online Analysis of Complex Gas Mixtures
Special Issues
This new data-driven Raman spectroscopy (DDRS) method is capable of simultaneously measuring 12 hydrocarbon and nonhydrocarbon gases in the presence of matrix interferences.
Gas analysis systems used for mud logging in the oil and gas industry provide information that is critical to optimize the drilling process and for ensuring safety on-site. As drilling speeds increase, measurement of hydrocarbons and nonhydrocarbons in real time becomes more challenging for traditional methods like gas chromatography (GC). Raman spectroscopy offers a promising alternative for multicomponent analysis of complex gas mixtures, particularly when high-sensitivity compact Raman instrumentation is combined with advanced data analysis. Here we share a new data-driven Raman spectroscopy (DDRS) method capable of simultaneously measuring 12 hydrocarbon and nonhydrocarbon gases in the presence of matrix interferences. Validation of its performance using both standard gas mixtures and two real mud-logging data sets compared favorably against the GC method, demonstrating the feasibility of this technique for online, high-throughput quantitative analysis of gases in oil and gas exploration and recovery, as well as many other industries.
A mud log details the composition and characteristics of the rock cuttings, mud, and gases brought to the surface by borehole drilling during oil and natural gas exploration. It provides valuable information about the quality and status of a drill site, logging the position and mix of hydrocarbons to facilitate efficient extraction and provide advance warning of dangerous gas levels (1). As rocks are crushed in the drilling process, a variety of gases indicative of the reservoir are released, including hydrocarbons such as methane, ethane, propane, isobutane, normal butane, isopentane, and normal pentane as well as a variety of nonhydrocarbons: CO2, CO, O2, N2, and H2. Rapid, continuous analysis of the composition of these complex mixtures is essential to help workers respond quickly to changes during drilling.
Gas Chromatography Versus Raman Spectroscopy
Although gas chromatography (GC) is the most widely used technique for the evaluation of multicomponent gases (2), it is limited both in speed (3) and its ability to distinguish between hydrocarbons and nonhydrocarbons simultaneously. GC also carries ongoing costs in the form of consumable columns, associated maintenance, and the need for trained operators.
Raman spectroscopy, in contrast, can be performed in just seconds, requires no sample preparation, and does not consume the sample. It has very little sensitivity to water vapor, and can probe all the relevant hydrocarbon and nonhydrocarbon gases concurrently. The challenge in making this technique widely deployable lies in achieving the sensitivity and specificity required to quantify each component within the complex, widely varying gas mixtures extracted from boreholes.
Since the first application of Raman spectroscopy to natural gas detection in 1980 (4), many variations have been proposed to enhance the signal, with successful deployment in some process analysis and onsite applications. Although specialized techniques can go so far as to achieve sub-parts per million detection limits, if Raman is to replace GC in the industry, the instrumentation must also be compact and portable enough for onsite deployment while still retaining sufficient sensitivity for meaningful quantitative analysis. Improvements in detection efficiency are part of the equation, but systems must also be able to quantify both hydrocarbon and nonhydrocarbon gases within the same matrix in a timely manner.
Analysis Challenges and Proposed Solution
The Raman spectra of complex gas mixtures of the type seen in mud logging are composed of many overlapping bands, and are also subject to considerable matrix interference. Those challenges demand the development of new chemometric analysis methods that are capable of deconvoluting superimposed spectra and neglecting background and matrix effects. The present body of work introduces a new approach called data driven Raman spectroscopy (DDRS) (5). DDRS is an application of partial least squares (PLS) analysis that combines higher-density discrete wavelet transform (HDWT) with variable selection influenced by the data itself, with the goal of isolating the most useful spectral features for target gas quantification in complex multicomponent mixtures. Instead of analyzing Raman spectra based on matching individual peaks at discrete wavelengths, DDRS uses an HDWT representation of the Raman spectrum to extract the most relevant spectral bands for the analysis of each given component.
Wavelet Transforms and Raman
A wavelet transform breaks down data into its frequency band components, allowing sharp changes in signal to be easily discriminated from noise. This concept has been applied to good effect in JPEG compression of images, which uses two-dimensional (2D) discrete wavelet transform (DWT) to find the local changes in brightness that truly define an image, filtering out noise and allowing the image to be compressed without loss of crucial details. Similarly, DWT has proven useful for background subtraction in Raman spectra (6).
DWT samples data in both the frequency and time domains. In the case of Raman spectra, the frequency domain correlates to peak width, while the time domain correlates to peak position. Raman spectra contain a rich amount of information in the form of both peak position and width, facilitating analysis in the frequency domain (peak width resolution) to mitigate the effects of background and noise, as well as in the time domain (peak wavelength position) to isolate analyte-specific spectral bands from the presence of other species and matrix interference.
Data-Driven Raman Spectroscopy
In developing the DDRS methodology, two key elements of a typical DWT approach were modified to overcome known weaknesses and improve its applicability to the analysis of multicomponent gases. The first improvement related to the transform itself. DWT down-samples data which, in the case of spectra, has the effect of degrading spatial resolution in the time (peak position) domain. To offset this effect, an oversampling technique called higher-density discrete wavelet transform (HDWT) was used. HDWT was developed to improve both the time and frequency resolution of DWT (7), and to mitigate a known vulnerability of traditional DWT to the alignment of the signal in time (or peak position, in the case of Raman). When applied to overlapping spectral bands in mixtures, the improved spectral resolution of HDWT allowed interfering components to be more easily distinguished. It also has the practical benefit of making the transform less sensitive to wavelength shifts, which is extremely important for Raman instrumentation operating in harsh environments and over a wide range of temperatures.
The second improvement defining DDRS lies in selection of the variables for PLS analysis-the unique spectral features that will allow each component to be identified and quantified with minimal overlap and greatest accuracy. A random frog algorithm is typically used for this purpose, but because this approach often results in the selection of unimportant variables, a template-oriented frog algorithm (TOFA) was proposed, in which variables are weighted by an estimate of their importance. For a detailed description of the HDWT and TOFA methodology and application, readers are referred to the literature (5).
Together, these two improvements to traditional DWT define a DDRS analysis method intended to isolate the optimal combination of spectral features for each component gas with minimum overlap, and then construct high-quality calibration models for gas analysis. To test its potential for extracting quantitative information, the method was put through its paces with a series of known multicomponent gas mixtures. It was also compared to GC analysis in continuous monitoring studies at two actual gas logging sites.
Experimental
To be viable for use in oil and gas exploration, a Raman spectroscopy system must be compact, robust, and capable of delivering repeatable data over a wide range of conditions, often harsh. The system built to test the DDRS method (Figure 1) was designed with onsite measurement in mind, integrating a 532-nm, 300-mW diode-pumped solid-state laser (WSLS-532-300 m, Wavespectrum Laser Group Limited) with a high numerical aperture Raman spectrometer for optimum throughput (Wasatch Photonics 532 Raman spectrometer, f/1.3). The spectrometer utilized a 1624-lines/mm volume phase holographic (VPH) grating in an aberration-corrected transmissive design with a thermoelectrically cooled Hamamatsu charge coupled device (CCD) detector (1024 × 64 pixels). Free-space coupling to the spectrometer's 25-µm slit was chosen to maximize use of the f/1.3 aperture for maximum sensitivity, thus enabling short integration times while maintaining spectral resolution of ~9 cm-1.
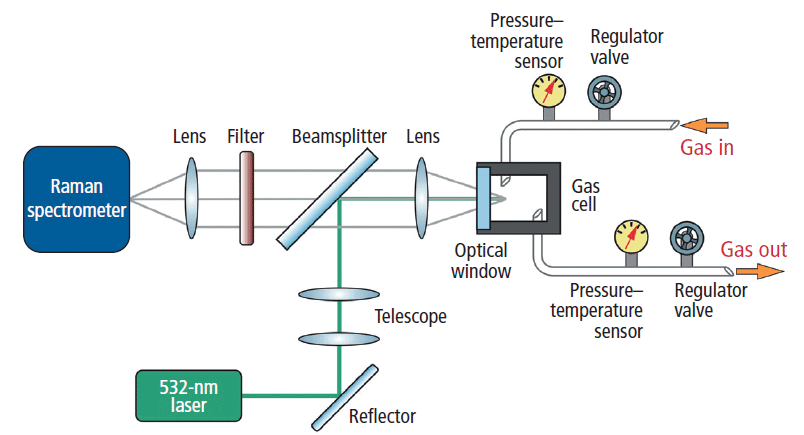
Figure 1: Design of the Raman gas analysis system. A 532-nm laser was coupled into the gas cell for excitation of Raman scattering, with longpass filtering of signal before detection by a high-sensitivity Raman spectrometer.
Laser light was delivered to the gas cell via a longpass dichroic beamsplitter designed to reflect the 532-nm laser and pass the Raman scattered light while excluding Rayleigh scattering (Figure 1). A 20-mm focal length lens focused laser light into the gas cell through a sapphire window, also collimating emitted Raman scattering for transmission through the longpass dichroic. The telescope in the laser path expanded the beam to enable a tighter focus of laser light into the gas cell. Rayleigh scattering in the signal path was further suppressed by a longpass filter, after which the Raman scattered light was focused onto the 25-µm entrance slit of the spectrometer by a 30-mm focal length achromatic lens. Throughout the measurements, the gas cell temperature and pressure were monitored, and pressure–flow was precisely controlled using regulator valves.
Using this gas analysis system, static measurements of 164 standard gas mixtures were performed, in addition to continuous measurements at two mud-logging sites. The standard gas mixtures were divided into three groups, all provided by Messer China Ltd. The first group of 74 samples was composed of hydrocarbons, and included seven alkanes: methane, ethane, and propane at 0.01–20%, isobutane and normal butane at 0.01–6%, and isopentane and normal pentane at 0.01–1.6%. The second group of 52 samples was composed of nonhydrocarbons and included CO2, CO, N2, and H2 in concentrations of 0.01–10.5%. In both cases, the distribution of concentrations in the samples were assigned following the principle of uniform design to simulate practical mug-logging gas samples. An additional 38 samples of O2 gas were tested separately because of the risk of explosion. Of the total 164 sample mixtures, 19 were chosen randomly for use as an independent validation set, and the remainder were used for training the models.
Individual spectra collected for each of the seven hydrocarbon gases exhibit unique signatures (Figure 2), but because of their similar bond structure, many of their Raman bands overlap closely. This overlap is problematic for detecting low concentrations of heavier hydrocarbons like butane and pentane, which are easily swamped by the more abundant, lighter gases. As a result, the spectra of the representative standard gas mixtures show Raman activity in similar bands, but with distinct spectral differences indicative of their differing compositions. The nonhydrocarbon gases, in contrast, were easily discriminated from one another in mixture, because of their well-separated peaks.
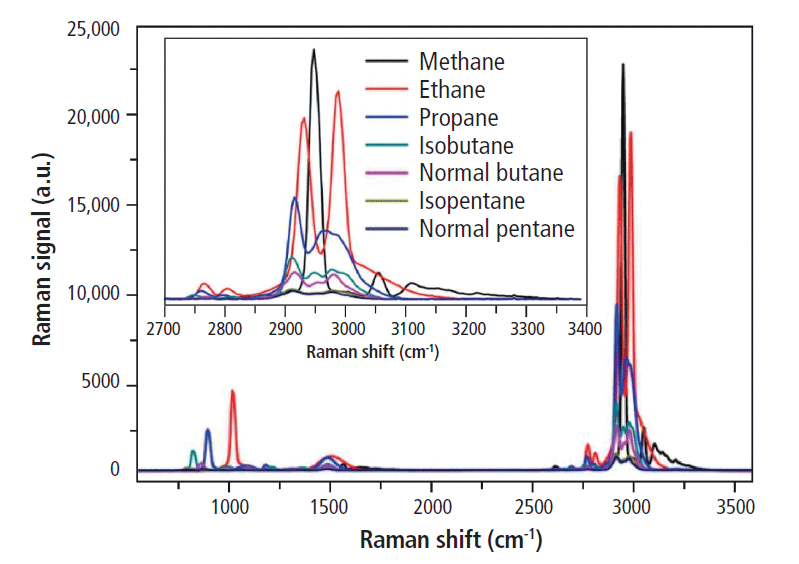
Figure 2: Raman spectra for the seven hydrocarbon gases under study, illustrating the high degree of overlap of the spectral bands key for identification and discrimination of each component. Adapted with permission from reference 5, copyright 2017 Elsevier.
Results and Discussion
PLS Versus DDRS: Analysis of Standard Mixtures
To properly assess the success of the newly developed DDRS analysis method, it was compared against plain PLS modeling for the standard gas mixtures. For each of the 12 target gases, PLS modeling was performed and evaluated. The number of PLS factors varied from 2 to 10, and yielded poor prediction precision in general, with root mean square error of prediction (RMSEP) values of up to 0.1113 and R values in the range 0.708–0.996 (Figure 3). Given the high number of PLS factors required and the overall poor quality of fit, PLS alone did not deliver the precision or robustness needed for accurate, reliable detection of multiple gas components in mud logging.
The same spectra were then reanalyzed using multivariate calibration models under the newly developed DDRS methodology. First, concentrations of the gases in each mixture type (hydrocarbon versus nonhydrocarbon) were assigned according to the principles of uniform design. Then HDWT was performed on each Raman spectrum, setting the decomposition scale to 6. After the sampling probability of each HDWT coefficient for the TOFA was calculated, the parameters of the TOFA were set. After 20 iterations, the TOFA results were collected in a matrix, and the frequency of each variable was calculated. This approach allowed a series of PLS models to be constructed with an increasing number of most frequent variable, from which the PLS model with minimum RMSEP was selected as the final model.
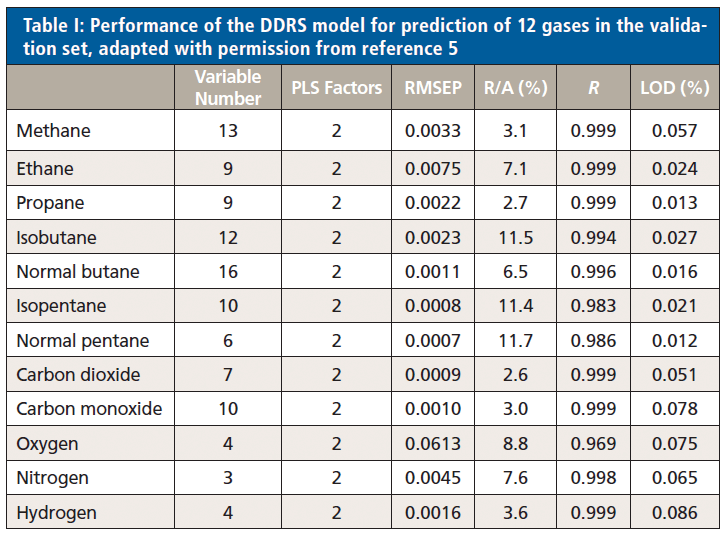
Looking at the results of modeling each target gas component (Table I), it can be seen that DDRS delivers high prediction precision with a relatively low number of required variables and only two PLS factors. RMSEP values are significantly lower across the board for DDRS versus plain PLS modeling (Figure 3), while R values were consistently >0.969, indicating a much better quality of fit. Additionally, an F-test to compare the two approaches confirmed that DDRS is a significantly better calibration model for component analysis in the gas mixtures.
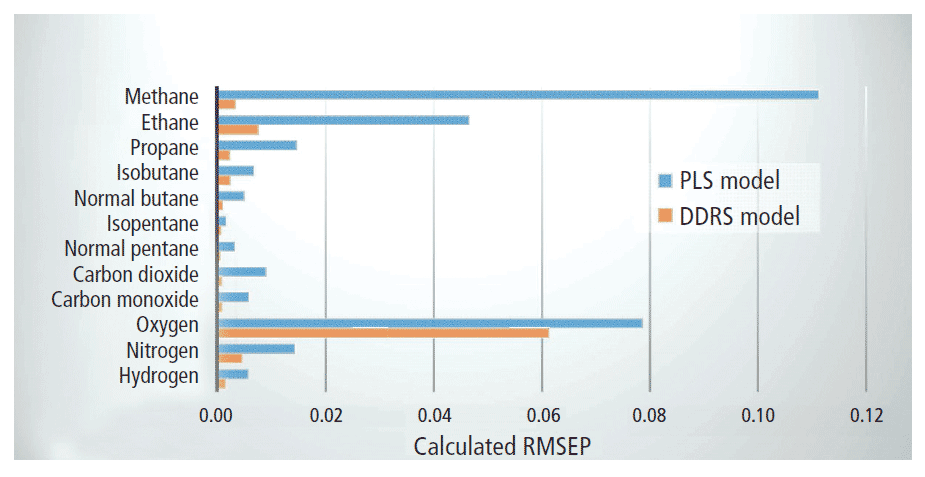
Figure 3: Comparison of root mean square error of prediction (RMSEP) values for each of the 12 component gases under study as calculated for plain PLS modeling versus DDRS modeling.
In terms of practical applicability, it is important that DDRS address the particular challenges of applying Raman spectroscopy to mud-logging gas analysis. Firstly, it must be able to successfully isolate a single gas target from within a highly overlapped and unpredictable matrix. This requirement is well evidenced by the results for methane, for which prediction results were improved tremendously by DDRS. Secondly, the model must be capable of quantifying low concentrations of heavier alkanes such as butane and pentane in mixtures dominated by lighter components. DDRS also performed extremely well in this respect, as can be seen by the excellent agreement between predicted and measured values for isobutane, normal butane, isopentane, and normal pentane (Figure 4).
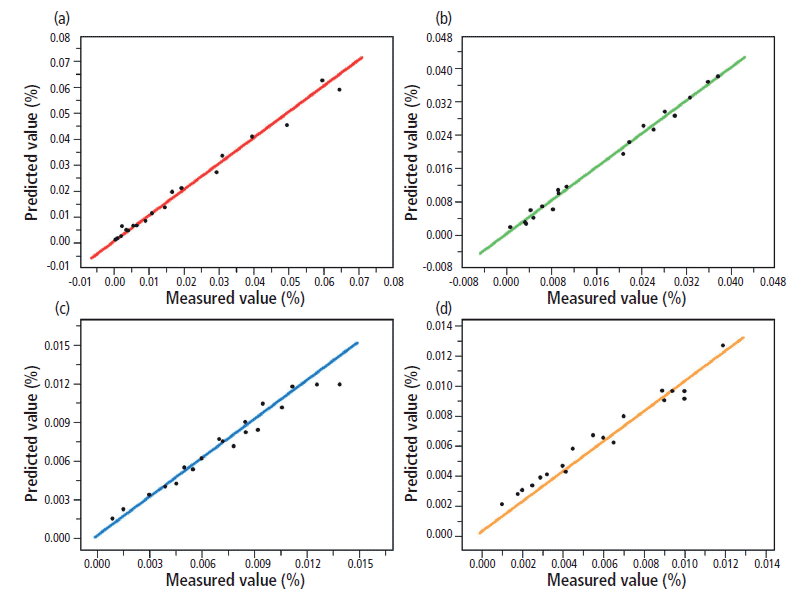
Figure 4: Measured versus predicted values for (a) isobutane, (b) normal butane, (c) isopentane, and (d) normal pentane as calculated by the DDRS model. Adapted with permission from reference 5, copyright 2017 Elsevier.
With confidence in DDRS established, the limit of detection (LOD) for each target gas component was calculated according to the International Union of Pure and Applied Chemistry (IUPAC) (8), using pure helium in the system as a measure of the baseline noise. This approach yielded LOD values for the target gases of 0.012–0.086% (Table I), which are sufficiently sensitive to be relevant in the mud-logging industry.
DDRS Versus GC: A Comparison in the Field
Having established the capability of DDRS to quantify the target gas components within simulated gas mixtures, the method was benchmarked against the industry standard method of GC at two actual mud-logging sites. For this purpose, the system was connected serially between the extractor and GC system (CPS-KQ-VI, Shanghai China Petroleum Instrument Co., Ltd.) at each site, using a small Raman gas cell volume to minimize gas sample delay between the measurements. The extracted gas was measured for methane, first by the DDRS system (every 6 s), then by the GC system (every 2 min). Measurements were taken for 13 h at the first site and for 6 h at the second (Figure 5). In both cases, DDRS measurements tracked very closely with GC results, providing much faster results and with better time resolution. This speed of analysis is particularly important for the detection of thin or hidden hydrocarbon reservoirs, and represents a significant tangible benefit for use in mud logging.
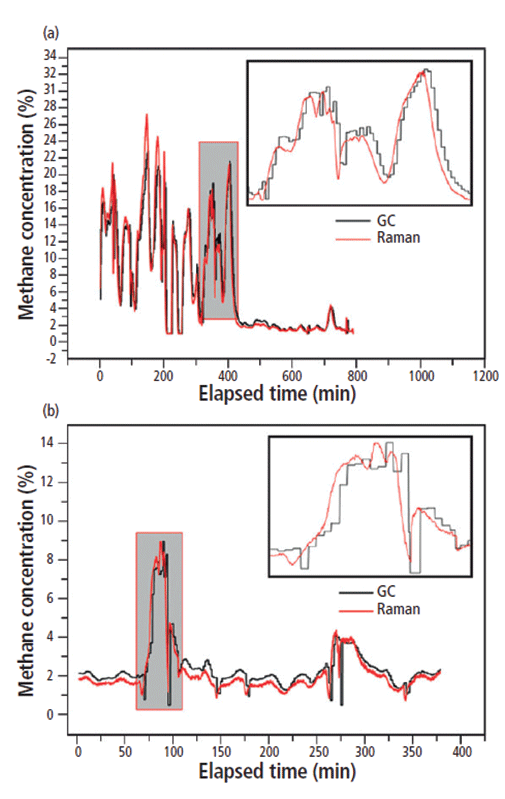
Figure 5: Comparison of GC (black curve) and Raman gas analysis system (red curve) results for methane, as measured at two mud-logging sites, (a) for 13 h, and (b) for 6 h. Adapted with permission from reference 5, copyright 2017 Elsevier.
Conclusion
The use of a high-sensitivity Raman system in combination with a newly developed analysis methodology termed DDRS shows multiple benefits for multicomponent gas analysis in the mud-logging industry. DDRS makes use of higher-density wavelet transform (HDWT) together with template oriented frog algorithm (TOFA) to find an optimal combination of spectral features with minimum overlap, and then constructs high-quality calibration models for gas analysis. Its ability to isolate both hydrocarbon and nonhydrocarbon target gas components within an uncontrolled and variable matrix with high prediction accuracy makes it a promising analysis method at mud-logging sites. When tested under the rigors of two real-world mud-logging sites, DDRS compared favorably with GC. In delivering much faster, better resolved measurements, the system shows excellent potential for high-throughput analysis of multiple gas components in real time, which could be extended to online multicomponent analysis in many other gas and fuel systems.
References
(1) D. Klaus and L. Bierenriede, Oil-Gas Eur. Mag. 41, 118–126 (2015).
(2) S.J. Maguireboyle and A.R. Barron, Environ. Sci.-Proc. Imp. 16, 2237 (2014).
(3) S.A. Barclay, R.H. Worden, J. Parnell, D.L. Hall, and S.M. Sterner, AAPG Bull. 84, 489–504 (2000).
(4) D.E. Diller and R.F. Chang, Appl. Spectrosc. 34, 411–414 (1980).
(5) X. Han, Z. Huang, X. Chen, Q. Li, K. Xu, and D. Chen, Fuel 207, 146–153 (2017).
(6) Y. Hu, T. Jiang, A. Shen, W. Li, X. Wang, and J. Hu, Chemometr.Intell. Lab. 85, 94–101 (2007).
(7) I.W. Selesnick, IEEE T. Signal Proces. 54, 3039–3048 (2006).
(8) M. Safaeian, D. Solomon, and P.E. Castle, Spectroscopy 18, 112–114 (2003).
Da Chen is a professor of Biomedical Engineering at the College of Precision Instrument & Opto-Electronics Engineering at Tianjin University in China. Cicely Rathmell is the vice president of marketing at Wasatch Photonics in Durham, North Carolina. Direct correspondence to: marketing@wasatchphotonics.com

New Study Reveals Insights into Phenol’s Behavior in Ice
April 16th 2025A new study published in Spectrochimica Acta Part A by Dominik Heger and colleagues at Masaryk University reveals that phenol's photophysical properties change significantly when frozen, potentially enabling its breakdown by sunlight in icy environments.