A Dedicated Spectra Database for Multiline Selection in ICP-AES
Special Issues
Acquisition and interpretation of a spectra database for ICP-AES analysis are described. The aim is the selection of nanometer-wide spectral windows containing several elements and several lines per element, so as to perform multiline analysis. An automatic line assignment procedure has been used. Information such as wavelength, sensitivity, line width, limit of detection, and level of detector saturation are stored. Filtering procedures are used for line selection, taking into account concentrations and possible spectral interferences.
Inductively coupled plasma-atomic emission spectrometry (ICP-AES) is a mature technique with well known advantages, including a large number of elements that can be determined, limits of detection (LODs) usually below 1 ng/mL, a low level of nonspectral matrix effects, and ease of operation. However, the technique is based upon atomic emission of the elements that are atomized and excited in the plasma. Because of the high excitation temperature and the excitation processes occurring in the plasma, not only analytical lines are enhanced, but also other, less sensitive lines. Consequently, line-rich spectra can be observed for a significant number of elements, such as U, W, Fe, Co, Ni, and most rare earth elements. The possibility of observing spectral interferences resulting from the presence of a major element, therefore, is high. This limitation is inherent to AES. Analytical line selection is, therefore, a crucial, complex, and time-consuming step in ICP-AES.

Table I. Examples of data that will be stored for Pb, ranging from sensitive to non-sensitive lines. B: background (e pixel-1 s-1) ; S: signal [e pixel-1 s-1 (mg/L)-1] ; csat: concentration (g/L) below detector saturation ; LOD expressed in µg/L ; FWHM expressed in pm.
Because currently available wavelength tables are not based upon ICP experiments, but on alternative radiation sources such as arc or spark, their reliability is not sufficient in terms of wavelength compilation and line intensity (1–5). Even if some tables have been dedicated to ICP-AES (6–7), they were initially based upon non-ICP sources. Some comprehensive compilations have been described, but are not readily available (8–10) (in particular, that based upon Fourier-transform spectrometry [10]) or were proprietary (11). Furthermore, a limited number of publications have been based upon ICP-AES, but they were devoted specifically to a given element (12–16) such as Fe, Cr, Mo, or U, and to some rare earth elements. This information certainly is useful, but unfortunately not comprehensive. It might be asked why such comprehensive databases are not available. The explanation simply is related to the fact that for some line-rich elements, which can emit several thousand lines, line assignment along with other information such as line width or sensitivity can be a heavy and endless task. Instead of interpreting the experimental spectra, an alternative is the storage of single-element spectra without line assignment and the display of the spectral windows containing the analytical line(s) under inspection (17).

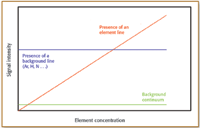
Figure 1. Principle of element line recognition using increasing concentrations of the element.
As a consequence of this lack of reliable wavelength tables, ICP users must perform tedious experiments for line selection by overlapping spectra of the different elements expected in the sample so as to find a sensitive line free from spectral interferences. Usually, a single line is sufficient for an element determination. However, the introduction of multichannel detectors in ICP-AES has allowed the use of several lines per element, leading to the possibility of performing multiline analysis. Potential benefits of multiline analysis are efficient use of the information emitted by the ICP, validation of line selection, verification of unexpected spectral and nonspectral interferences, and selection of an internal standard to improve accuracy. As a whole, reliability of the analytical results should be improved, but multiline analysis should lead to an even more complex line selection.

Table II. Number of lines that can be used as the function of the element concentration. The range was between 5 x LOD and saturation.
Experimental
HORIBA Jobin Yvon's ACTIVA CCD-based ICP-AES system makes use of several-nanometer wide jumping spectral windows, called wavelength analytical views (WAV). The concept of the system has been described in a previous issue (18). WAV selection is performed by trying to obtain the largest possible number of elements within the same WAV along with the possibility of having several lines per element. To facilitate WAV selection, there is, therefore, a need for a comprehensive database based upon ICP-AES experiments. Not only should the database contain a comprehensive list of wavelengths, but also other useful information such as sensitivity.

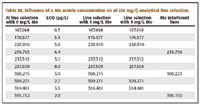
Table III. Influence of a Mo matrix concentration on Al (50 mg/l) analytical line selection.
The entire 120–800 nm single-element spectra were acquired by juxtaposition of about a hundred adjacent WAVs. Using an exposure time of 0.5 s/pixel, the total acquisition and data transfer time was circa 5 min/spectrum. Because the key point is not the acquisition but the interpretation of the data, a procedure has been developed for an automatic line recognition and assignment. Spectrum acquisitions of blank, 100 µg/L, 10 mg/L, and 1000 mg/L solutions for each element of the periodic table that can be determined in ICP-AES were conducted (excluding radioactive elements). A calibration graph was constructed for each pixel. The principle is to verify the response as a function of the concentration. A flat response corresponds, obviously, to a signal independent of the element, and therefore related to background emission (for example, Ar lines or continuum ; see Figure 1). The difference between the continuum and Ar lines is obtained not only by comparing intensities but also by assigning a line shape and width to Ar lines. In contrast, a positive straight slope with a correlation coefficient close to the unity revealed the presence of an element signal. Line assignment is based upon the NIST database (19), the database of the Korean Atomic Energy Research Institute (20), and a database developed previously within HORIBA Jobin Yvon (Edison, NJ). Because the experiments were performed over a period of several weeks, spectra of a 1-mg/L Fe solution were stored periodically.

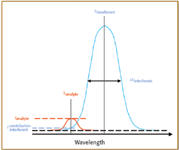
Figure 2. Criterion for spectral interferences by comparing the contribution of the line wing of the interferent line to the intensity of the analyte line.
It should be emphasized that the aim of this database was not to provide a list of highly accurate wavelengths with possible discrepancies between previously reported values and experimental ones (10,21,22), but to obtain data that allows the combination of single-element spectra to mimic real-life samples. Therefore, reproducibility all along the spectra acquisition experiments was the highest priority so as to avoid any shift between spectra. Reproducibility of the grating positioning was evaluated using Ar lines, whereas the reproducibility of the entire system (that is, including the sample introduction system and plasma excitation conditions), was estimated by using Fe lines. Reproducibility over several days was within a few percent. Actually, the machining facilities of both the gear and worm of the semi-direct grating drive allow a positioning better than 1 pm (that is, a significantly lower fraction of the pixel bandpass).
Because the physical line width of most elements usually is in the range of 1–6 pm, measurements of the full width at half maximum (FWHM) corresponds to the practical resolution of the dispersive system : 10 pm below 440 nm and 18 pm above. However, the FWHM was measured for each line, because of the possible presence of large Doppler effects on light elements (for example 25 pm for Li); multiplets; or hyperfine structures. FWHM was determined in most cases by using a spline function for the line profile, which allowed the determination of the peak intensity, and then of the line width.
The fluctuations of the blank expressed as a %RSD have been determined all along the wavelength range, and conservative values of 1% below 200 nm, and 0.6% above, were selected for the determination of the LODs. Sensitivities were stored and normalized to electron pixel-1 s-1 (mg/L)-1 . Knowing sensitivity and background emission, it then is easy to deduce either the signal-to-background ratio (SBR) or the background equivalent concentration. Another useful piece of information is the highest possible concentration, csat , that can be used below the level of saturation of the CCD detector. The dynamic range was defined as the ratio of the saturation concentration over the LOD, csat /LOD.
In Table I are given examples of information that is stored for some Pb lines, ranging from sensitive lines to nonsensitive lines.
Use of the Database
One of the potential benefits of such a database is the display of combined single-element spectra in a WAV through a filtering procedure, taking into account the expected concentrations of the elements of interest and possible spectral interferences. The first step considers the element concentrations. The selection criterion is that the signal should be between five times the LOD and the saturation level. Table II illustrates the number of lines that can be used according to the element concentration. It can be seen easily that whereas 74 lines can be used for Pb at 1 g/L, only four lines remain usable for a concentration of 50 µg/L.
The second step is related to possible spectral interferences. Line width was used for the selection of analytical lines that can be considered as free from spectral interferences. For that, the actual intensity of the analytical line was compared to the contribution of the intensity of the line wing of the interferent line at the analytical line wavelength location (Figure 2). It has been considered that a spectral interference is observed if the contribution of the interferent line is k times the analytical line intensity. Practically, several steps are used.
1) The contribution of the interferent line wing at the analyte line location is computed, using the intensity stored for 1 mg/L, and multiplying by the maximum concentration cmax expected for the interferent matrix element. For that, a Gaussian shape is used to describe the line profile, and the contribution is:

2) In contrast, the minimum concentration cmin is used for the analyte intensity, so as to be under the most pessimistic case.

3) Then the criterion for spectral interferences is applied, with the value of k being easily modified. A spectral interference is assumed if:

An example is given in Table III, using the interference of a Mo matrix on Al analytical lines.
Conclusions
HORIBA Jobin Yvon has developed a proprietary database containing wavelengths, sensitivities (including LODs and saturation levels), and line widths, which are based upon actual ICP experiments. Because of the high reproducibility of the dispersive system, it is possible to overlap various single-element spectra without any significant shift. With simple algorithms, this database allows, therefore, the prediction of usable lines as a function of the element concentrations and matrix elements. As a consequence, semiquantitative analysis or sample fingerprints are facilitated, and it is possible to take full advantage of the concept of the ACTIVA ICP-AES system, which is multiline quantitative analysis based upon the use of spectral windows combining several elements and several lines per elements.
References
1. A.R. Striganov and N.V. Sventitskii, Tables of Spectral Lines of Neutral and Ionized Atoms (IFI/Plenum, New York, 1968).
2. G.R. Harrison, MIT Wavelength Tables (The MIT Press, Cambridge, MA, 1969).
3. A.N. Zaidel, V.K. Prokofjev, S.M. Raiskli, V.A. Slavnyi, and E. Shreider, Tables of Spectral Lines (IFI/Plenum, New York, 1970).
4. MIT Wavelength Tables, Wavelengths by Element, vol. 2 (The MIT Press, Cambridge, MA, 1982).
5. R.L. Kelly and L.J. Palumbo, Atomic and Ionic Emission Lines below 2000 ú H through Kr, NRL Report 7599, NRL, Washington DC, 1973.
6. M.L. Parsons, A. Forster, and D. Anderson, An Atlas of Spectral Interferences in ICP Spectroscopy (Plenum, New York, 1980).
7. P.W.J.M. Boumans, Line Coincidence Tables for Inductively Coupled Plasma Atomic Emission Spectrometry (Pergamon Press, Oxford, UK, 1980).
8. C.C. Wohlers, ICP Inf. Newslett. 10, 593–688 (1985).
9. C.C. Wohlers, ICP Inf. Newslett. 14, 646 (1989).
10. G. Horlick, An Interactive Spectral Library for Inductively Coupled Plasma Atomic Emission Spectrometry, Pittcon 2004, Chicago, IL.
11. P.S. Doidge, C. Webb, and M.R. Anderson, ICP Inf. Newslett. 25, 503 (1999).
12. E. Michaud and J.M. Mermet, Spectrochim. Acta, B 37, 145 (1982).
13. G. Wünsch, J. Stummeyer, and H.M. Ortner, ICP Inf. Newslett. 15, 715 (1990).
14. G. Wünsch, S. Kittel, C. Genning, and H.M. Ortner, ICP Inf. Newslett. 17, 495 (1992).
15. D. Qiu, S. Xu, and W. Cheng, Fenxi Huaxue 22, 278–280 (1994).
16. A.A. Ghazi, S. Qamar, and M.A. Atta, Spectrochim. Acta 49B, 527–531 (1994).
17. E. Poussel and J.M. Mermet, J. Anal. Atom. Spectrom. 17, 1349–1353 (2002).
18. J.M. Mermet, A. Cosnier, Y. Danthez, C. Dubuisson, E. Fretel, O. Rogerieux, and S. Vélasquez, Spectroscopy 20(2), 60–68 (2005).
19. http://physics.nist.gov/physrefdata/ASD/index.html.
20. http://amods.kaeri.re.kr.
21. Z.A. Grosser and J.B. Collins, Appl. Spectrosc. 45, 367–369 (1991).
22. P.S. Doidge and T.T. Nham, Appl. Spectrosc. 46, 1301–1303 (1992).

Mass Spectrometry for Forensic Analysis: An Interview with Glen Jackson
November 27th 2024As part of “The Future of Forensic Analysis” content series, Spectroscopy sat down with Glen P. Jackson of West Virginia University to talk about the historical development of mass spectrometry in forensic analysis.
Detecting Cancer Biomarkers in Canines: An Interview with Landulfo Silveira Jr.
November 5th 2024Spectroscopy sat down with Landulfo Silveira Jr. of Universidade Anhembi Morumbi-UAM and Center for Innovation, Technology and Education-CITÉ (São Paulo, Brazil) to talk about his team’s latest research using Raman spectroscopy to detect biomarkers of cancer in canine sera.