Development of an Ultrasensitive LC–MS-MS Method for Determination of 5-Fluorouracil in Mouse Plasma
5-Fluorouracil (5-FU) is a low-molecular-weight anticancer drug in clinical use for several solid tumors in humans. Currently, the most widely used methodology for 5-FU quantitation is liquid chromatography–tandem mass spectrometry (LC–MS-MS) with either liquid–liquid extraction (LLE), protein precipitation, or a combination of both as sample cleanup procedures.
5-Fluorouracil (5-FU) is a low-molecular-weight anticancer drug in clinical use for several solid tumors in humans. Currently, the most widely used methodology for 5-FU quantitation is liquid chromatography–tandem mass spectrometry (LC–MS-MS) with either liquid–liquid extraction (LLE), protein precipitation, or a combination of both as sample cleanup procedures. Here, we report a new solid-phase extraction (SPE) method for 5-FU analysis by LC–MS-MS. This process is the first report utilizing strong anion-exchange SPE cartridges to separate 5-FU from the matrix.
The cytostatic chemotherapeutic agent 5-fluorouracil (5-FU) has been widely used for 50 years for the treatment of several solid tumors in humans including colorectal, breast, gastrointestinal, and head and neck cancers (1–6). It is still considered to be one of the most active anticancer drugs for advanced colorectal cancer (7,8) and is a component of FOLFIRINOX, a drug combination currently used for pancreatic cancer treatment (9). A large number of nonchromatographic and chromatographic methods for the quantitation of 5-FU have been reported to support preclinical and clinical studies (10). Cell culture–based assays for 5-FU were first developed in the 1960s (11,12) and were replaced by gas chromatography (GC) in the 1970s (13). Several years later, high performance liquid chromatography (HPLC) (14,15) and gas chromatography–mass spectrometry (GC–MS) methods (16–18) were developed and used in more extensive clinical studies. More recently, liquid chromatography–tandem mass spectrometry (LC–MS-MS) methods (19–24) have been developed. These newer methods are highly specific, sensitive, and rapid and are expected to replace HPLC–UV, HPLC–fluorescence, and GC–MS for 5-FU analysis. Most of the chromatographic methods developed use either liquid–liquid extraction (LLE), protein precipitation, or a combination of both as sample clean-up procedures (10,19,21,22), with only a few reported uses of solid-phase extraction (SPE) for sample preparation (15,25). Our goal was to develop a more sensitive method to extract 5-FU from plasma matrix and to quantify the amount of 5-FU in novel, nano-sized therapeutic vehicles that will be used in preclinical animal studies. To measure the smaller amounts of 5-FU in these vehicles, a more sensitive technique for measuring 5-FU was needed. In this study, we report a new SPE sample cleanup procedure that takes advantage of the anionic state of 5-FU under basic conditions, followed by LC–MS-MS analysis using a hydrophilic interaction chromatography (HILIC) column. The resulting method (with lower limit of quantitation [LLOQ] of 0.1 ng/mL) is 10-fold more sensitive than the most sensitive method reported previously (with LLOQ of 1 ng/mL) (24).
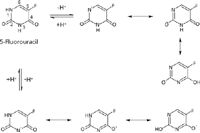
Figure 1: 5-FU deprotonation.
Experimental
The finalized experimental conditions for the SPE procedure and LC–MS-MS analysis are described below.
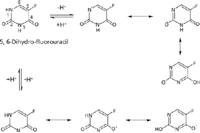
Figure 2: 5-FUH2 deprotonation.
SPE Conditions
Samples were extracted by adding 600 µL of 20% ammonium hydroxide aqueous solution to 200 µL of mouse plasma containing 10 µL of internal standard 5-chlorouracil (5-CU) at a concentration of 100.0 ng/mL. Samples were added to Oasis Max cartridges (3 cc, 60 mg, Waters Corporation) after preconditioning the cartridges with 2 × 2 mL of methanol and 2 mL of water. Samples were drawn through under vacuum and then washed with 3 mL of 5% ammonium hydroxide aqueous solution and 3 mL of methanol. The samples were eluted with 1 mL of 1% formic acid in 60:40 methanol–water, evaporated on a Speed Vac Concentrator (Savant SPD121P-115, Thermo Electron Corporation), and reconstituted in 100 µL of 15% ammonium hydroxide in acetonitrile. Then 10 µL of the sample solution was injected into the LC–MS-MS system. Calibration standards for 5-FU were prepared by spiking 5-FU into 200 µL of blank mouse plasma at the concentrations of 0.1, 0.5, 1.0, 5.0, 10.0, 30.0, and 50.0 ng/mL.
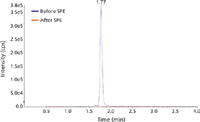
Figure 3: Chromatograms of 5-FUH2 before and after SPE. 5-FUH2 was not retained on the SPE cartridge - no peak was detected in the SPE eluent.
LC–MS-MS Conditions
The LC–MS-MS system consisted of an Agilent 1100 system coupled to a tandem quadrupole 4000 Qtrap system (AB Sciex). Chromatographic separations were performed on a Phenomenex Luna HILIC column (3 µm, 150 mm × 2.00 mm, 200 Å), which is a silica-based particle with an ethylene cross-linked diol phase. The column temperature was held at 40 °C. Mobile-phase A was 100 mM ammonium formate in water, and mobile-phase B was acetonitrile. The gradient was as follows: 90% B for 2.0 min, 90–50% B at 4.0 min, 50% B until 6.0 min, 50–90% B at 6.1 min, and 90% B until 11 min. The MS system was operated in negative electrospray ionization mode with an ion spray voltage of 4500 V. Nitrogen was used as collision gas. The optimized source conditions were as follows (arbitrary units if not specified): Gas 1, 70; Gas 2, 60; CUR, 40; CAD, 10; and TEM, 500. The optimized compound conditions were as follows: DP, 60; EP, 10; CXP, 5; dwell time, 100 ms for all analytes; and CE, 28 V for 5-FU and 31 V for 5-CU. The MRM transitions were m/z 129.0→42.0 for 5-FU and m/z 145.2→42.0 for 5-CU. Data were processed with Analyst software version 1.5.1 (AB Sciex).
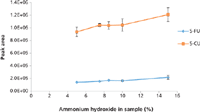
Figure 4: Optimizing the percentage of ammonium hydroxide in plasma samples containing 10.0 ng/mL 5-FU and 50.0 ng/mL 5-CU before SPE. Error bars represent standard deviations of two replicates.
Results and Discussion
Selection of SPE Cartridges
Because most published methods for the analysis of 5-FU use LLE, our work was focused on finding an efficient SPE method for 5-FU analysis to take full advantage of the easier use and higher extraction selectivity of SPE as compared to that of LLE. In addition, since 5-FU has a high aqueous solubility that results in poor extraction into organic solvents, there was an opportunity to improve the extraction efficiency as well. Initial surveys demonstrated that most SPE columns did not retain 5-FU with high efficiency. Further examination of the structure of 5-FU revealed two possible deprotonation sites on the two nitrogen atoms (N1 and N3) of the molecule (Figure 1). The deprotonated form can delocalize the negative charge across numerous positions, including some that are stable aromatic 2- and 4-pyrimidinolates. This change confers greater stability to the anions for 5-FU (and 5-CU), leading to an ability to extract 5-FU (and 5-CU) on an anion-exchange column under basic conditions. Our results supported this hypothesis. The charge delocalization theory was further verified by a negative example of 5,6-dihydro-5-fluorouracil (5-FUH2), which has a structure that is similar to 5-FU, but with two hydrogens added at positions 5 and 6. Although similar charge delocalization can occur in 5-FUH2 (Figure 2), stabilized aromatic forms which meet the Hückel aromaticity rule (= 4N+2 pi electrons involved, where N is an integer) do not form. For this reason it was not possible to extract 5-FUH2 on an anion-exchange SPE column as was accomplished for 5-FU because there were no stabilized anions formed even under basic conditions as indicated in Figure 3. Thus, the selection of SPE cartridges was narrowed down to the anion-exchange columns only. Initially, both weak and strong anion-exchange cartridges were evaluated. Only the strong anion-exchange columns were effective in both cases. This finding can be explained by the weak acid property of 5-FU. The known pKa values of 5-FU are 8 and 13 (10), respectively. To find the best strong anion-exchange column with highest extraction efficiency for 5-FU, three SPE cartridges were evaluated. Our selection of an SPE cartridge for 5-FU analysis was based on the analyte recovery, reproducibility, and availability at the time of the experiments.
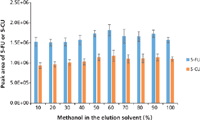
Figure 5: Optimizing the percentage of methanol in elution solvent for SPE of plasma samples containing 100.0 ng/mL of 5-FU and 5-CU. Error bars represent standard deviations of three replicates.
Optimization of SPE Conditions
To get maximum extraction efficiency, the SPE conditions were optimized for the amount of base (ammonium hydroxide) added to the sample to convert 5-FU to its anionic form before the SPE; the percentage of methanol in the elution solvent; the percentage of formic acid in the elution solvent; and the elution volume. Different volumes of the ammonium hydroxide aqueous solution (20%) were added to a pooled blank mouse plasma (200 µL) spiked with 5-FU (10 ng/mL) and 5-CU (50 ng/mL) to bring the percentages of ammonium hydroxide at 5.0, 7.5, 8.5, 10.0, or 15.0%. The aliquots of the samples were then loaded onto the SPE cartridges and extracted according to the procedure in the experimental section but eluted with 3 mL of 2% formic acid in methanol. The eluents were evaporated to dryness, reconstituted, and analyzed by LC–MS-MS. The optimization procedure was performed in duplicates. The results are shown in Figure 4. The optimal value for the base was determined to be 15% based on the highest peak area of 5-FU. Because the SPE cartridge we used is a mixed-mode device it provides dual mode retention through both reversed-phase and anion-exchange interaction with the compounds in the sample. For this reason, an extensive optimization of the elution conditions was conducted by varying the percentage of methanol and the percentage of formic acid in the elution solvent to eliminate matrix components (such as choline-containing phospholipids) to the greatest extent possible without loss of analytes. To do so, identical samples were prepared by adding 600 µL of 20% ammonium hydroxide aqueous solution to 200 µL of pooled blank mouse plasma spiked at 100.0 ng/mL of 5-FU and 5-CU. The samples were divided into two groups. For group 1, samples were eluted with 1 mL of 2% formic acid in 10–100% methanol to optimize the percentage of methanol in the elution solvent. A value of 60% methanol in water was determined to be optimum, as indicated in Figure 5. A precursor scan of 184 m/z over the mass range of 50–1200 m/z (target choline-containing phospholipids) showed that the sample eluted with 60% organic (methanol) had a lower background than the one eluted with 100% organic, and that the samples treated by SPE were cleaner than the one treated by protein precipitation (data are not shown here). Therefore, the percentage of organic solvent in the elution solvent was chosen to be 60%, which has the additional benefit of prolonging column life. For group 2, samples were eluted with 1 mL of 1–5% formic acid in 60% methanol aqueous solution. The results showed that 1% formic acid in 60% methanol gave the highest peak area of 5-FU and 5-CU (Figure 6). To make sure that 1 mL of 1% formic acid in 60% methanol was sufficient to elute all of the 5-FU off the SPE cartridges, samples were eluted with 5 × 1 mL of 1% formic acid in 60% methanol. Each 1-mL elution fraction was collected, dried down, reconstituted, and subjected to LC–MS-MS analysis. The results are shown in Figure 7. Our data show that 1 mL of 1% formic acid in 60% methanol was enough to elute up to 99% of the compounds of interest off the cartridges. Therefore, 1 mL of 1% formic acid in 60:40 (v/v) methanol–water was chosen as the final elution condition to obtain higher extraction efficiency for 5-FU and 5-CU (Figure 7).
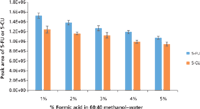
Figure 6: Optimizing the percentage of formic acid in elution solvent of 60:40 methanolâwater for SPE of plasma samples containing 100.0 ng/mL of 5-FU and 5-CU. Error bars represent standard deviations of three replicates.
Liquid Chromatography Separation
The next step in the method development process was to find the optimal chromatographic conditions that yield the highest signal-to-noise ratios and separate 5-FU from any coeluted interferences from the matrix. Several columns that would retain polar compounds were screened. The HILIC column gave the best sensitivity and peak shape. It was possible that the high volatility of the organic solvent in the mobile phase associated with using a HILIC column might have assisted the analyte desolvation at the electrospray ionization source and, in turn, contributed to the high signal intensity. At the early stage of method development, acetonitrile was used as sample solvent for the standards. But when these conditions were applied to 5-FU in plasma matrix, it was difficult to obtain a good standard curve. An interfering peak was observed in the plasma blank at the retention time of 5-FU. This problem was solved by adding base (ammonium hydroxide) to the sample solvent. The basic sample solvent shifted the retention time of both 5-FU and 5-CU and sharpened the peaks, leading to higher method sensitivity (Figure 8). No peak was detected at the retention time of 5-FU in the blank mouse plasma under these conditions (Figure 9). The final reconstitution solvent for the samples was chosen to be 15% ammonium hydroxide in acetonitrile. Calibration curve was linear over the range of 0.1–50.0 ng/mL (Table I).
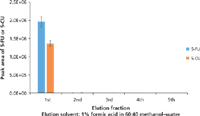
Figure 7: Optimization of elution volume for SPE of plasma samples containing 100.0 ng/mL of 5-FU and 5-CU. Error bars represent standard deviations of three replicates.
The Stability of 5-FU in the Reconstitution Solvent
Because of the high pH of the reconstitution solvent, the stability of 5-FU and 5-CU in the basic sample solvent (15% ammonium hydroxide in acetonitrile) was monitored by injecting 10 µL of 100.0 ng/mL of 5-FU and 5-CU standards stored at 4 °C in the autosampler. It was found that the compounds were stable for at least 18 days in the basic solvent (Figure 10). Because the injection volume was small (10 µL) and the buffer capacity of mobile-phase A (100 mM ammonium formate in water, pH ~6) was high, the basic sample solvent was not an issue for the HILIC column. The same column was used for method development, validation, and sample analysis, which lasted for more than six months.
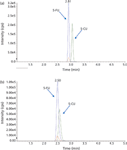
Figure 8: LCâMS-MS chromatograms of 5-FU and 5-CU in different sample solvents: (a) 15% ammonium hydroxide in acetonitrile and (b) acetonitrile. The peak in red is another MRM (129.0â59.0) of 5-FU monitored as a confirmation reference.
Method Validation
The last step in the method development was method validation to test for robustness and reproducibility. The method was validated for linearity, sensitivity, accuracy, precision, selectivity, recovery, and matrix effect. Excellent linearity was obtained for the seven-point calibration curve constructed by plotting the peak area ratio of 5-FU to its internal standard (5-CU) versus the corresponding concentration ratio and fitting the data using linear least-squares regression with a 1/x weighting factor. For three consecutive batches, the calibration curves showed an overall accuracy of 98.0–101.9% with RSD ≤5.3% over the concentration range of 0.1–50.0 ng/mL (Table I). The correlation coefficient (r2) of the linear regression was ≥0.9996. The LLOQ was taken as the lowest calibration concentration that passed acceptance criteria with a signal-to-noise ratio of at least 5:1. The LLOQ was found to be 0.1 ng/mL, a 10-fold improvement from the most sensitive method previously reported for 5-FU (with LLOQ of 1 ng/mL) (24). In addition to enhanced sensitivity, our technique differs from the prior method (24) by not requiring precolumn derivatization.
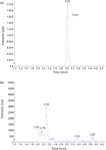
Figure 9: Example chromatograms of (a) 5-FU (50 ng/mL) in mouse plasma after SPE treatment and reconstituted in 15% ammonium hydroxide in acetonitrile and (b) a blank mouse plasma sample.
Method accuracy and precision were evaluated using quality control (QC) samples prepared by spiking 5-FU into the blank plasma at four concentration levels (0.1, 0.3, 20.0, and 40.0 ng/mL) to serve as QC-LLOQ, low QC, mid QC, and high QC. Three consecutive batches were prepared and each batch contained a freshly prepared calibration curve and six replicates of QC samples at the four levels. Intra-assay precision was calculated by obtaining the relative standard deviation (RSD) of the six replicates of each QC level, and intra-assay accuracy was calculated by averaging the accuracies of six replicates of each QC level against the fresh curve. Inter-assay precision was calculated by obtaining the RSD of all 18 replicates at each QC level from all three batches, and inter-assay accuracy was obtained by averaging the accuracies of all 18 replicates at each QC level from all three batches. The method was found to be highly accurate and precise. The intra-assay accuracy of 92.8–104.8% (of the theoretical value) and precision of 0.7–5.4% RSD, and inter-assay accuracy of 93.3–102.7% and precision of 1.6–5.1% RSD were obtained for all QC levels including LLOQ (Table II).
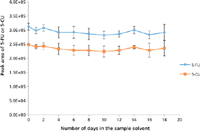
Figure 10: The stability of 5-FU and 5-CU in 15% ammonium hydroxide in acetonitrile measured over an 18-day period. Error bars represent standard deviations of three replicates.
The method selectivity was evaluated by assaying a blank plasma sample without internal standard. No interfering peaks were detected at the retention time of interest (Figure 9). To evaluate the recovery of SPE and matrix effect, three samples were prepared in triplicates. Sample 1 is a plasma sample spiked with 5-FU and 5-CU at 100.0 ng/mL. Sample 2 is a blank plasma sample without an internal standard. Sample 3 is water without an internal standard. All three samples were processed according to the procedures described in the experimental section above. But for samples 2 and 3, instead of adding reconstitution solutions, a solution containing 5-FU and 5-CU at concentrations that mimic the concentrations of sample 1 in the final extract were added. These samples are referred to as the post-extraction spike sample (for sample 2) and the pure solution sample (for sample 3), respectively. The 5-FU and 5-CU mean peak area counts from three replicates of sample 1 were compared with the corresponding mean peak area counts from three replicates of sample 2 to calculate the extraction recovery. Similarly, matrix effect is calculated as follows: mean peak area from the post-extraction spike samples minus the mean peak area from the pure solution samples, then divided by mean peak area from the pure solution samples and multiplied by 100. Positive values indicates percent enhancement, and negative values indicates percent suppression. As shown in Table III, a recovery of 69.6% for 5-FU and 112.1% for 5-CU were achieved. Although the recovery of 5-FU was lower than 100%, the percent recovery was very consistent for the three replicates performed. A matrix effect of -0.38% for 5-FU and 6.92% for 5-CU was observed, and all three matrix lots showed very similar matrix effects. All of these demonstrate the robustness and ruggedness of the method.
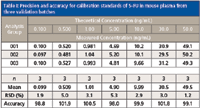
Table I: Precision and accuracy for calibration standards of 5-FU in mouse plasma from three validation batches
Conclusion
This work represents the first report utilizing strong anion-exchange SPE cartridges to extract 5-FU and 5-CU from plasma matrix. The innovative idea was derived by exploiting the weak acid properties of 5-FU and 5-CU. Furthermore, adding base (ammonium hydroxide) to the reconstitution solvent improved the peak shape of 5-FU and eliminated matrix interference by increasing the retention time of the analytes (5-FU and 5-CU), but not the interfering peaks. The combination of using a HILIC analytical column and a basic reconstitution solvent contributed to the significantly lower LLOQ of 0.1 ng/mL. The resulting method is 10 times more sensitive than the most sensitive method previously reported (with an LLOQ of 1 ng/mL) (24). The newly developed SPE sample cleanup procedure is also simpler and easier to use, when compared to the time-consuming LLE procedures. A more accurate and sensitive assay to analyze the concentration of chemotherapeutic drugs may improve dosing for future preclinical studies.
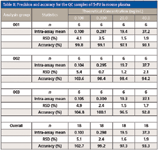
Table II: Precision and accuracy for the QC samples of 5-FU in mouse plasma
Acknowledgments
The authors would like to thank Dr. A. Daniel Jones of Michigan State University for his critical review and suggestions regarding the manuscript. We also thank Dr. Jason E. Schaff for his valuable comments on the manuscript and proof reading. The authors also wish to thank Penn State College of Medicine Mass Spectrometry Core Facility for the support of instrumentation.

Table III: Recovery and matrix effect of 5-FU and 5-CU in mouse plasma
References
(1) C. Heidelberger, N.K. Chaudhuri, P. Danneberg, D. Mooren, L. Griesbach, R. Duschinsky, R.J. Schnitzer, E. Pleven, and J. Scheiner, Nature 179, 663–666 (1957).
(2) M.P. Decatris, S. Sundar, and K.J. O'Byrne, Cancer Treat. Rev. 30, 53–81 (2004).
(3) D.H. Ilson, Cancer Treat. Rev. 29, 525–532 (2003).
(4) D.B. Longley, D.P. Harkin, and P.G. Johnston, Nat. Rev. Cancer 3, 330–338 (2003).
(5) J.A. Meyerhardt and R.J. Mayer, N. Engl. J. Med. 352, 476–487 (2005).
(6) T.A. Rich, R.C. Shepard, and S.T. Mosley, J. Clin. Oncol. 22, 2214–2232 (2004).
(7) P. Comella, Ther. Clin. Risk Manag. 3, 421–431 (2007).
(8) H.J. Wilke and E. Van Cutsem, Ann. Oncol. 14 (Suppl. 2), ii49–55 (2003).
(9) T. Conroy, F. Desseigne, M. Ychou, O. Bouché, R. Guimbaud, Y. Bécouarn, A. Adenis, J.L. Raoul, S. Gourgou-Bourgade, C. de la Fouchardière, J. Bennouna, J.B. Bachet, F. Khemissa-Akouz, D. Péré-Vergé, C. Delbaldo, E. Assenat, B. Chauffert, P. Michel, C. Montoto-Grillot, M. Ducreux, G.T.D.o. Unicancer, and P. Intergroup, N. Engl. J. Med. 364, 1817–1825 (2011).
(10) M. Breda and S. Barattè, Anal. Bioanal. Chem. 397, 1191–1201 (2010).
(11) M. Fikus, K.L. Wierzchowski, and D. Shugar, Biochem. Biophys. Res. Commun. 16, 478–483 (1964).
(12) D.E. Hunt and R.F. Pittillo, Cancer Res. 28, 1095–1109 (1968).
(13) O. Driessen, D. de Vos, and P.J. Timmermans, J. Chromatogr. 162, 451–456 (1979).
(14) J. Escoriaza, A. Aldaz, E. Calvo, and J. Giraldez, J. Chromatogr. B Biomed. Sci. Appl. 736, 97–102 (1999).
(15) J. Joulia, F. Pinguet, P. Grosse, C. Astre, and F. Bressolle, J. Chromatogr. B Biomed. Sci. Appl. 692, 427–435 (1997).
(16) L.W. Anderson, R.J. Parker, J.M. Collins, J.D. Ahlgren, D. Wilkinson, and J.M. Strong, J. Chromatogr 581, 195–201 (1992).
(17) C.D. Bates, D.G. Watson, N. Willmott, H. Logan, and J. Goldberg, J. Pharm. Biomed. Anal. 9, 19–21 (1991).
(18) M. Kubo, H. Sasabe, and T. Shimizu, J. Chromatogr. 564, 137–145 (1991).
(19) B. Buchel, P. Rhyn, S. Schürch, C. Buhr, U. Amstutz, and R.L. Carlo, Biomed. Chromatogr. 27, 7–16 (2013).
(20) D. Carli, M. Honorat, S. Cohen, M. Megherbi, B. Vignal, C. Dumontet, L. Payen, and J. Guitton, J. Chromatogr. B Analyt. Technol. Biomed. Life Sci. 877, 2937–2944 (2009).
(21) J.E. Kosovec, M.J. Egorin, S. Gjurich, and J.H. Beumer, Rapid Commun. Mass Spectrom. 22, 224–230 (2008).
(22) G. Remaud, M. Boisdron-Celle, A. Morel, and A. Gamelin, J. Chromatogr. B Analyt. Technol. Biomed. Life Sci. 824, 153–160 (2005).
(23) Y. Tsume, C.J. Provoda, and G.L. Amidon, J. Chromatogr. B Analyt. Technol. Biomed. Life Sci. 879, 915–920 (2011).
(24) K. Wang, M. Nano, T. Mulligan, E.D. Bush, and R.W. Edom, J. Am. Soc. Mass Spectrom. 9, 970–976 (1998).
(25) M.A. Nassim, F.H. Shirazi, C.M. Cripps, S. Veerasinghan, M.J. Molepo, M. Obrocea, D. Redmond, S. Bates, D. Fry, and D.J. Stewart, Int. J. Molec. Med. 10, 513–516 (2002).
Jenny P. Dai is with the Department of Pharmacology at Pennsylvania State University College of Medicine in Hershey, Pennsylvania. Amra Tabakovic is with the Department of Materials Science and Engineering at Pennsylvania State University in University Park, Pennsylvania. Welley Loc is with the Department of Materials Science and Engineering, Pennsylvania State University. Ana Butler is with the Department of Materials Science and Engineering, Pennsylvania State University. Christopher O. McGovern is with the Department of Biochemistry and Molecular Biology at Pennsylvania State University. James H. Adair, PhD, is a Professor of Materials Science and Engineering and Director of the Ceramic & Composite Materials Center, with the Department of Materials Science and Engineering at Pennsylvania State University. Peter J. Butler, PhD, is Associate Professor of Bioengineering, with the Department of Bioengineering, at Pennsylvania State University. Bruce A. Stanley, PhD, is Director, Section of Research Resources, at Pennsylvania State University College of Medicine. Jill P. Smith, MD, is Director of Clinical, and Translational Research in Digestive Diseases, with the National Institutes of Health, National Institute of Diabetes, Digestive and Kidney Diseases, in Bethesda, Maryland. Mark Kester, PhD, is G. Thomas Passananti Professor of Pharmacology and Director at the Penn State Center for NanoMedicine and Materials, with the Department of Pharmacology at Pennsylvania State University, College of Medicine. Gail L. Matters, PhD, is Associate Professor of Biochemistry and Molecular Biology with the Department of Biochemistry and Molecular Biology at Pennsylvania State University, College of Medicine. Direct correspondence to: pdai@hmc.psu.edu

LIBS Illuminates the Hidden Health Risks of Indoor Welding and Soldering
April 23rd 2025A new dual-spectroscopy approach reveals real-time pollution threats in indoor workspaces. Chinese researchers have pioneered the use of laser-induced breakdown spectroscopy (LIBS) and aerosol mass spectrometry to uncover and monitor harmful heavy metal and dust emissions from soldering and welding in real-time. These complementary tools offer a fast, accurate means to evaluate air quality threats in industrial and indoor environments—where people spend most of their time.
NIR Spectroscopy Explored as Sustainable Approach to Detecting Bovine Mastitis
April 23rd 2025A new study published in Applied Food Research demonstrates that near-infrared spectroscopy (NIRS) can effectively detect subclinical bovine mastitis in milk, offering a fast, non-invasive method to guide targeted antibiotic treatment and support sustainable dairy practices.