Direct Determination of Oil Content in Binary Mixtures of Peanut and Canola Oils Using Partial Least Squares and Attenuated Total Reflectance Fourier Transform Infrared Spectroscopy
Spectroscopy
This study presents a novel, time-efficient, and cost-effective procedure for determining the percentage of oil content in binary mixtures of peanut and canola oils.
An attenuated total reflectance Fourier transform infrared (ATR-FT-IR) spectrophotometric and partial least squares (PLS) chemometric method was developed for the direct determination of percent content by mass of peanut and canola oils in binary mixtures. A training set was generated using a full factorial design and was used to predict the concentrations in a testing data set, which was generated using a central composite design. We compared the performance of commonly used signal processing techniques (first derivative, binning, standard normal variate [SNV], and Savitzky-Golay smoothing) prior to PLS analysis. Savitzky-Golay smoothing outperformed the other aforementioned techniques with a root mean square error of calibration (RMSEC) for peanut oil of 2.81 × 10⁻² and 2.71 x 10⁻² for canola oil. The root mean square error of prediction (RMSEP) was 1.53 × 10⁻¹ for both peanut and canola oils. The relatively small root mean square error (RMSE) values indicated that the differences between the actual and predicted values of both the training and testing set were minimal. An R2 of 0.999 with a root mean square error of prediction (RMSEP) of 1.53 × 10⁻¹ was obtained for both edible oils, implying that the probe could potentially provide an avenue of method development for the direct determination of oil content in binary mixtures of peanut and canola oils.
The vegetable oil sector encompasses products of varying values and sales volume. In theory, fraud is attractive in this area, and thus international standards are required. Standards facilitate trade by establishing a baseline for product quality that is internationally agreed on, which is important to protect the rights of purchasers and consumers (1). Because peanut oil is more expensive than other oils, some peanut oils are adulterated with other inexpensive oils (2). Current methods for determining vegetable oils in blends are mostly qualitative (3). While quantitative methods exist, such techniques are based on the quasi-Monte Carlo (QMC) integral method, which requires significant computational time and produces results that are difficult to interpret (4). Further, the accuracy of QMC decreases in high dimensional settings (5). Historically, detecting fraud in oil blends has been a challenge because of the small database establishing appropriate purity criteria for authentic edible oils (1).
Spectrophotometry has become the method of choice not only in qualitative and quantitative analysis of chemical substances, but also in the identification of physical properties of various objects and their classification. Previous studies have used Fourier transform infrared (FT-IR) analysis to gather data on vegetable oils (6–8). However, these studies were concerned with a single source of vegetable oil per sample. The studies of Mueller and colleagues (7) and Rusak and coworkers (8) are more focused on the classification of individual vegetable oils through FT-IR analysis. The study conducted by Alexa and colleagues (6) does discuss the use of FT-IR to determine adulteration of vegetable oils; however, it was still done with nonmixed vegetable oil samples. The determination of vegetable oil identity in a mixture was not addressed in these studies.
Partial least squares (PLS) is a multivariate statistical technique that allows comparison between multiple response variables and multiple explanatory variables. PLS also has well-known advantages such as ease of interpretability, less numerical computation time, and robustness to noisy or missing data (9).
Since spectrophotometers may generate huge amounts of data that are highly correlated from one wavelength value to the next and from one sample to another, it is likely that these data may contain redundant information that could decrease the precision of inference based on those data. In this regard, digital signal processing techniques are implemented to extract that information or transform signals in useful ways (10).
The overall goal of this study was to develop a novel, time-efficient, and cost-effective procedure for determining the percentage of oil content in binary mixtures of peanut and canola oils. In this study, we also compared the performance of various signal processing techniques including first derivative, binning, standard normal variate (SNV), and Savitz-ky-Golay smoothing to improve the performance of our PLS models.
Experimental
A design of experiments (DoE) approach was used to generate vegetable oil blends consisting of binary mixtures of peanut and canola oils. These oils are widely used by consumers and have important nutritional values. The blends were kept in dark glass bottles and stored at 8 °C.
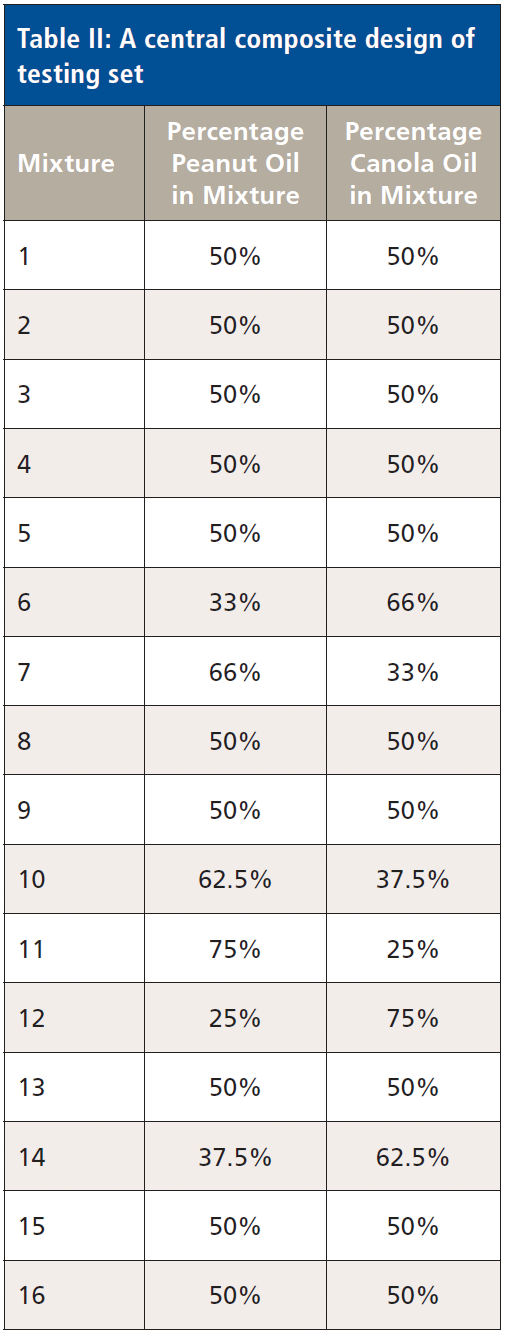
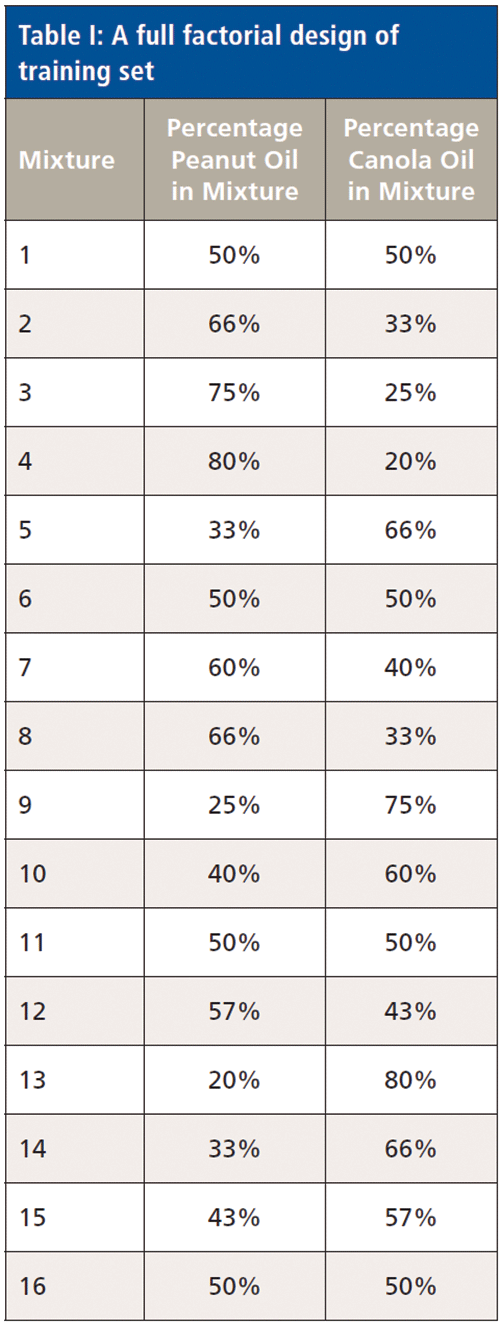
A full factorial design (n = 16 mixtures) was used to generate a training set (Table I). A central composite design (n = 16) was used to generate an independent test set on which to gauge the accuracy of the training model (Table II). All mixture designs were generated using the "DoE.base" and "rsm" packages under the R Program (11,12).
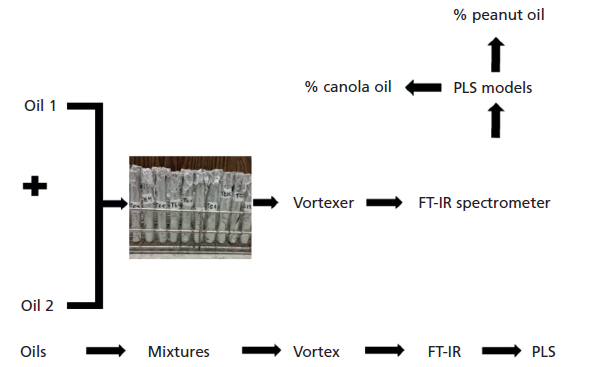
Figure 3: Root mean square error of prediction (RMSEP) as a function of the number of components for peanut and canola oils.
Each generated binary mixture was mixed using a vortex mixer, and each mixture was analyzed using a Bruker Tensor 27 FT-IR spectrometer using the attenuated total reflectance accessory mode (ATR-FT-IR) (Figure 1). FT-IR analysis was done with a resolution of 4 cm-1. Both the background and sample scan numbers were 40 scans. The data from the FT-IR analysis were used to construct PLS predictive models with the FT-IR spectra (649.99–3996.38 cm-1) as the independent variables and the binary mixture concentrations of edible oils as the dependent matrices. The training set was used as a calibration model to build the PLS predictive constructs, and its accuracy was tested in an independent test set. The ultimate goal was to use the FT-IR data to predict the percentage content of edible oils in binary mixtures of peanut and canola (Figure 2).
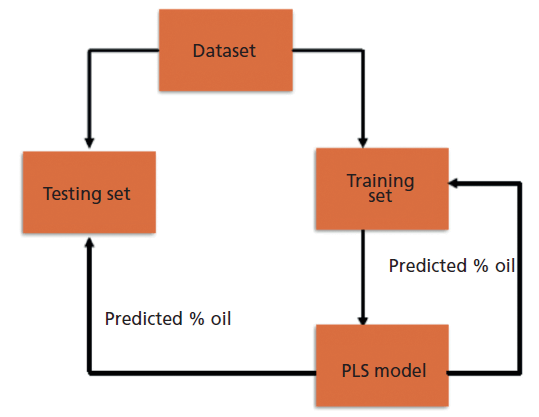
Figure 4: Predicted versus measured percent oil content for peanut and canola oils using two components.
Before performing PLS analyses, the FT-IR data were scaled and then subjected to various signal processing techniques, including first derivative, binning, SNV, and Savitzky-Golay smoothing.
The first derivative was computed with the finite difference method. That is, the difference between subsequent data points was calculated provided that the band width is constant:

Click here to view full-size graphic
where x'i is the new data point, xi and xi-1 are the subsequent data points (13).
Binning is a preprocessing technique that averages a signal in column bins (13). It is a top-down splitting technique based on a specified number of bins and is primarily used for data smoothing (14). Binning methods smooth a sorted data value by consulting its "neighborhood"-that is, the values around it. The sorted values are distributed into a number of "buckets" or "bins" (15).
SNV is another simple method for normalizing spectra that intends to correct for light scattering by operating row-wise:

where xi is the value of variable i, x withbari is the average of the variable i, and si is the standard deviation (13).
Savitzky-Golay filtering was also implemented in this study before PLS modeling to smooth the near-infrared (NIR) spectra. The algorithm fits a local polynomial regression on the signal. It requires evenly spaced points. Mathematically, it operates as a weighted sum over a given window:

where x*j is the new value, N is a normalizing coefficient, k is the gap size on each side of j, and ch is a precomputed coefficient that depends on the chosen polynomial order and degree (13,16,17).
All signal processing techniques were calculated using the ProspectR package in the R program (13).
PLS is a powerful multivariate statistical technique that has been successfully applied in many areas (18). It involves the decomposition of A (absorbance) and C (concentration) as follows:

where T and U are the n x d score matrices; P comprises the p x d loadings of the A matrix; E is the n x p error (residual) of A matrix; Q is the m x d loadings of the C matrix; and F is the n x m error (residual) of the C matrix. Computation of the B-coefficients is then given by

with W as a d x p matrix of PLS weights (25). In particular, the PLS2 algorithm was utilized in this study that involves modeling all dependent variables simultaneously. This leads to it being faster than performing several PLS1 calculations, with the latter requiring separate PLS1 models, which can be time consuming (19).
To assess prediction accuracy of the regression model, the root-mean-square error (RMSE) was calculated (20):

where y and y' are the predicted and actual concentrations, respectively, and N is the number of samples. All PLS analyses were performed using the PLS Package under the R Program (21,22).
Results and Discussion
Infrared (IR) analysis was reported to exhibit subtle differences in the spectra of various types of vegetable oils (6). Those differences enabled us to identify the presence of foreign oil in an oil sample using calibration curves established for certain characteristic frequencies in known mixed oils.
We first attempted to perform a direct PLS regression analysis using the entire (1736 wavenumber values) absorption region (649.99–3996.38 cm-1). Our cross validated (leave-one-out cross validation) results for the training set obtained root mean square errors of calibration (RMSEC) of 1.40 x 10⁻¹ and 1.37 x 10⁻¹ for the peanut and canola oils, respectively. The root-mean-square errors of prediction (RMSEP) were 1.98 x 10⁻¹ and 1.99 x 10⁻¹ for the peanut and canola oils, respectively. In an attempt to improve the results, we implemented several commonly used signal processing techniques including first derivative, binning, SNV, and Savitzky-Golay smoothing (Table III).
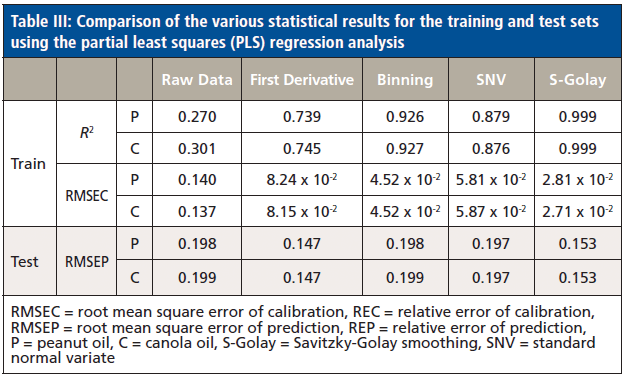
A first derivative analysis was then implemented in the entire absorption region (649.99–3996.38 cm-1). This method has been found to be a good way of accurately pinpointing the position of the broad peak. Specifically, this property is very useful when there are several closely overlapping peaks (23). After the first derivative analysis of the entire absorption region spectrum, PLS modeling was performed, obtaining slightly better results than the direct PLS analysis where no signal processing technique was performed. The training set garnered an RMSEC of 8.24 x 10⁻² and 8.15 x 10⁻² for the peanut and canola oils, respectively. The testing set obtained an RMSEP of 1.47 x 10⁻¹ for both the peanut and canola oils, respectively (Table III).
Although, derivatives have the advantage of reducing the effect of baseline offset, resolving absorption overlapping, compensating for instrumental drifts, enhancing small spectral absorptions, and often increasing predictive accuracy for complex datasets, they are also subjected to several drawbacks. Such draw-backs include risk of overfitting the calibration model, increasing uncertainty in model coefficients, complicating spectral interpretation, and increasing noise (13).
Binning and SNV were also performed and garnered comparable performance (Table III). Several bin sizes were tested to enhance the performance of the data binning technique. However, the best result was obtained at a bin size of 1. The possibility that the regions of FT-IR spectra may still contain irrelevant information and correlated variables may explain why both these techniques have higher RMSEC and RMSEP values relative to the other signal processing techniques.
We then implemented Savitzky-Golay smoothing before PLS modeling and the results improved compared to the first derivative (Table I). The advantage of the Savitzky-Golay filter for spectral smoothing is that it tends to preserve the original signals such as relative maxima, minima, and width by removing noise only to some degree, which is better than moving average with equal weights. However, as in any smooth filtering, aggressive smoothing by increasing window size lowers the peak values and broadens the shapes (24,26). As such, we optimized our window size to only 3. Our PLS trained model utilizing two factors (Figure 3) generated highly linear responses between measured and predicted percent vegetable oil content (R2 = 0.999 for peanut oil, R2 = 0.999 for canola oil). Two factors accounted for the two components used in the study. Three or more factors were not used to avoid possible overfitting, leading to biased results. The points follow the target line quite nicely, and there is no indication of a curvature or other anomalies (Figure 4). Our RMSEC also indicated that our model was good (RMSEC = 2.81 x 10⁻⁵ for peanut oil, RMSEC = 2.71 x 10⁻² for canola oil). We then tested our trained model in an independent test set and garnered an RMSEP of 1.53 x 10⁻¹ for both peanut and canola oils. The relatively small RMSE values indicated that the differences between the actual and predicted values of both the training and testing set were minimal (Table III). Accuracy can further be improved by using more robust experimental design and datasets, as well as including a wider concentration space matrix in the training set data.
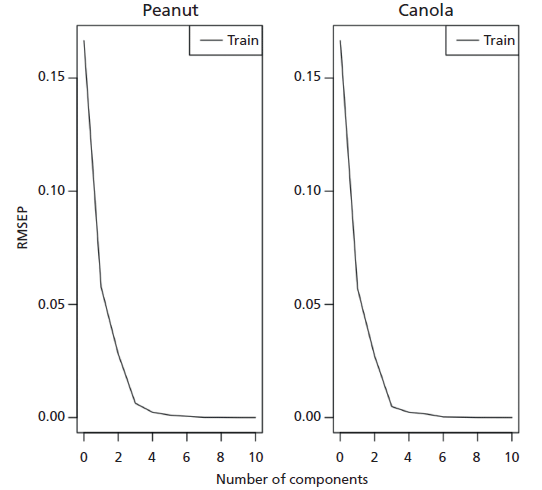
Figure 3: Root mean square error of prediction (RMSEP) as a function of the number of components for peanut and canola oils.
The Savitzky-Golay filters are generally used for smoothing and differentiation in many fields. The properties of their smoothing filters have also been well studied. The method has several advantages in addition to the one previously mentioned. Firstly, the intrinsic principle, that is, the running least-squares polynomial fitting, is quite clear and straightforward. Further, the filter coefficients are all convenient integers (27). In this study, the Savitzky-Golay filter outperformed the first derivative, binning, and SNV signal processing techniques.
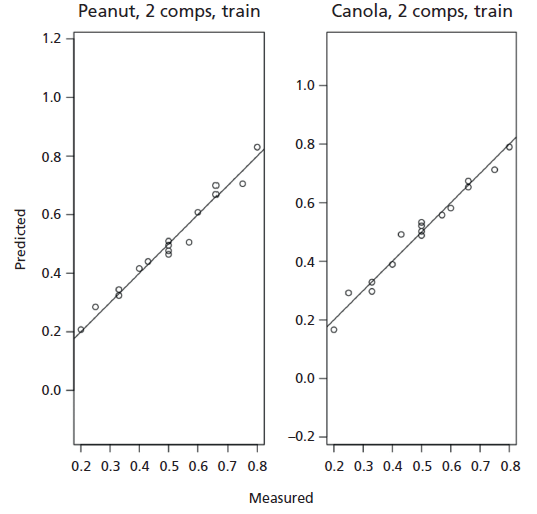
Figure 4: Predicted versus measured percent oil content for peanut and canola oils using two components.
This study offers a novel approach of simultaneously determining the percent oil content of canola and peanut oils in binary mixtures. This research can be extended to include ternary, quaternary, or even quinary mixtures of edible oil blends with the ultimate goal of developing a model to determine the percentage of oil content in such mixtures. To our knowledge, this study is the first to simultaneously determine percent edible oil content in binary mixtures. This is particularly useful in the food industry to determine the content of specific edible oils in samples. The methods described can even be extended to include animal and plant oil mixtures that show subtle differences in the FT-IR spectra.
Conclusion and Future Directions
This method can potentially be used by food and oil chemists as an alternative method to determine vegetable oil percent content in binary mixtures of peanut and canola oils. Results can further be improved by possibly optimizing wavenumber selection and implementing other signal processing techniques such as using wavelet transformation. While this method may offer a potentially promising approach of determining vegetable contents in binary blends of peanut and canola oils, the developed method could be strengthened by adding more samples in both the training and testing sets. We also plan to implement the analysis in unknown vegetable oil mixtures and validate the method with gas chromatographic techniques. Beyond the binary system involving the aforementioned oils, it is also possible to include ternary or even quaternary mixtures of other vegetable oils such as coconut or soybean oils. However, deconvolution of overlapping peaks may represent a challenge because of the complexity of the FT-IR spectra as the number of components increases.
Acknowledgment
This work was conducted while Dr. Gerard G. Dumancas was part of the 2018 Department of Science and Technology Philippine Council for Industry, Energy, and Emerging Technology Research and Development (DOST-PCIEERD) Balik Scientist Program. We would like to acknowledge the LSUA Huie Delmon Trust Endowed Professorship for the research support. The authors have declared no conflict of interest.
References
(1) J.R. Bill and P.N. Gillatt, "Standards to Ensure the Authenticity of Edible Oils and Fats," Food and Agriculture Orga-nization of the United Nations (Rome,1994).
(2) S.U. Rui, W. Xing-hua, Z. Tian-qi, Y. Wenzhi, F. Xu-dong, Z. Han-qi, and Y. Ai-min, Chem. Res. Chinese Universities 28(1), 14–18 (2012).
(3) J. Xu, X.-F. Liu, and Y.T. Wang, Food Chem.212, 72–77 (2016). https://doi.org/10.1016/j.foodchem.2016.05.158.
(4) R.E. Caflisch, Acta Numerica 7, 1–49 (1998).
(5) B.F. Vajargah and F. Mehrdoust, ANZIAM Journal 52, 41–58 (2011).
(6) E. Alexa, A. Dragomirescu, G. Pop, C. Jianu, and D. Dragos, J. Food, Agric. Environ. 7(2), 20–24 (2009).
(7) D. Mueller, M.F. Ferrão, L. Marder, A.B. da Costa, and R.C. Schneider, Sensors 13(4), 4258–4271 (2013). doi: 10.3390/s130404258.
(8) D.A. Rusak, L.M. Brown, and S.D. Martin, J. Chem. Educ. 80(5), 541 (2003). doi: 10.1021/ed080p541.
(9) D.M. Pirouz, Social Science Research Network (2006). Retrieved from https://papers.ssrn.com/abstract=1631359.
(10) R.Z. Morawski, Meas. Sci. Technol. 17(9), R117 (2006). Retrieved from https://iopscience.iop.org/article/10.1088/0957-0233/17/9/R01/meta.
(11) U. Groemping, B. Amarov, and H. Xu, DoE.base: Full Factorials, Orthogonal Arrays and Base Utilities for DoE Packages (version 0.29), 2016. Retrieved from https://cran.r-project.org/web/packages/DoE.base/index.html.
(12) R.V. Lenth, rsm: Response-Surface Analysis (version 2.8), 2016. Retrieved from https://cran.r-project.org/web/packages/rsm/index.html.
(13) A. Stevens and L. Ramirez-Lopez, prospectr: Miscellaneous functions for processing and sample selection of vis- NIR diffuse reflectance data (version 0.1.3), 2014. Retrieved from https://cran.r-project.org/web/packages/prospectr/index.html.
(14) J. Han, J. Pei, and M. Kamber, Data Mining, Southeast Asia edition (Morgan Kaufmann, 2006).
(15) S. Chakrabarti, E. Cox, E. Frank, R.H. Güting, J. Han, X. Jiang, and I.H. Witten, Data Mining: Know It All (Morgan Kaufmann, 2008).
(16) A. Savitzky and M.J. Golay, Anal. Chem. 36(8), 1627–1639 (1964).
(17) P.D. Wentzell and C.D. Brown, Encyclopedia of Analytical Chemistry (Wiley, 2000). Retrieved from http://onlinelibrary.wiley.com/ doi/10.1002/9780470027318.a5207/full.
(18) G.G. Dumancas, S. Ramasahayam, G. Bello, J. Hughes, and R. Kramer, TrAC, Trends Anal. Chem. 74, 79–88 (2015). https://doi.org/10.1016/j. trac.2015.05.007.
(19) R.G. Brereton, Applied Chemometrics for Scientists (John Wiley and Sons, Hoboken, New Jersey, 2007).
(20) N. Faber and M. Klaas, Chemom. Intell. Lab. Syst. 49(1), 79–89 (1999). https://doi.org/10.1016/S0169-7439(99)00027-1.
(21) B.-H. Mevik, R. Wehrens and K. Hovde Liland, pls: Partial Least Squares and Principal Component Regression (version 2.6-0), 2016. Retrieved from https://cran.r-project.org/web/packages/pls/index.html.
(22) R Core Team, R: A language and environment for statistical computing. R Foundation for Statistical Computing. 2017. Retrieved from https://cran.fi-ocruz.br/web/packages/dplR/vignettes/timeseries-dplR.pdf.
(23) R.G. Brereton, Chemometrics: Data Analysis for the Laboratory and Chemical Plant (John Wiley & Sons, Hoboken, New Jersey, 2003).
(24) B. Park and R. Lu, Hyperspectral Imaging Technology in Food and Agriculture (Springer, 2015).
(25) M. Otto, Chemometrics: Statistics and Computer Application in Analytical Chemistry (Wiley-VCH, Weinheim, Germany, 2007).
(26) T. Pham, Computational Biology: Issues and Applications in Oncology (Springer Science & Business Media, 2009).
(27) J. Luo, K. Ying, P. He, and J. Bai, Digital Signal Processing 15(2), 122–136 (2005). Retrieved from http://www.sciencedirect.com/science/article/pii/ S1051200404000727.
Chloe Lewis is with the Department of Mathematics and Physical Sciences at Louisiana State University, Alexandria, in Alexandria, Louisiana. Ghalib A. Bello is with the Institute of Clinical Sciences, at Imperial College in London, England. Gerard G. Dumancas is with the Department of Mathematics and Physical Sciences at Louisiana State University and the Department of Chemistry at the University of the Philippines, in Visayas, Miagao, Iloilo, Philippines. Direct correspondence to: gdumancas@lsua.edu
Geographical Traceability of Millet by Mid-Infrared Spectroscopy and Feature Extraction
February 13th 2025The study developed an effective mid-infrared spectroscopic identification model, combining principal component analysis (PCA) and support vector machine (SVM), to accurately determine the geographical origin of five types of millet with a recognition accuracy of up to 99.2% for the training set and 98.3% for the prediction set.
Authenticity Identification of Panax notoginseng by Terahertz Spectroscopy Combined with LS-SVM
In this article, it is explored whether THz-TDS combined with LS-SVM can be used to effectively identify the authenticity of Panax notoginseng, a traditional Chinese medicine.