The C=O Bond, Part VI: Esters and the Rule of Three
Spectroscopy
Esters are a common and economically important functional group made by reacting an alcohol and a carboxylic acid.
The sixth installment in our examination of the infrared spectroscopy of the carbonyl group is focused on esters. Like acid anhydrides and carboxylates, esters are made via a reaction involving carboxylic acids. Esters are very common and are economically and biologically important. All esters exhibit three intense peaks and hence follow what I like to call the Rule of Three. The spectra of saturated and aromatic esters will be examined over the next two columns.
So far in our investigation of the infrared (IR) spectroscopy of the carbonyl functional group we have looked at ketones, aldehydes, carboxylic acids, acid anhydrides, and carboxylates (1–5). Acid anhydrides and carboxylates are both made from carboxylic acids. If an alcohol and a carboxylic acid are reacted a functional group called an ester is synthesized. The reaction is called esterification. My high school chemistry teacher (who in large part was responsible for my career choice) helped us remember the name of this reaction by pronouncing it "ester vacation" and saying it was the time off we got from school around Easter. The molecular framework of the ester functional group is shown in Figure 1.
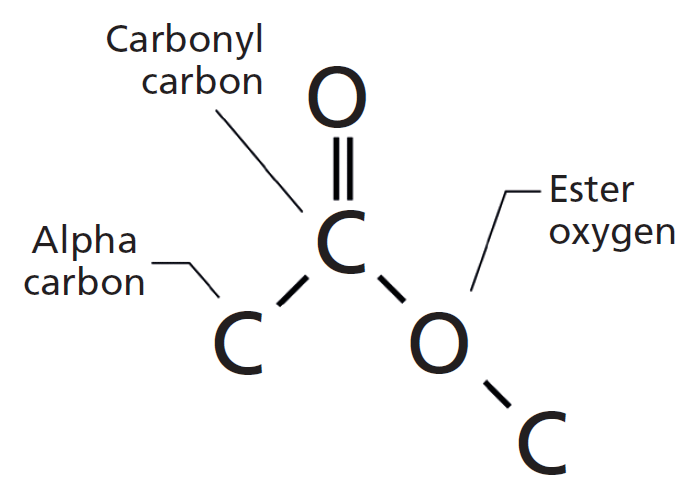
Figure 1: The molecular framework of the ester functional group.
The carbon in the C=O group in esters is called the carbonyl carbon, as has been the case in all the other carbonyl containing functional groups we have studied (1–5). The carbon to the left of the carbonyl carbon in Figure 1 is called the alpha carbon, and the oxygen to the right is called the ester oxygen. If the alpha carbon is saturated, it gives a saturated ester, whereas if the alpha carbon is aromatic we have an aromatic ester. As we will see in the next two columns, IR spectroscopy can easily distinguish saturated from aromatic esters.
A word on the pronunciation of this functional group is in order. I am not originally from New England, but I did live there for a number of years. I observed that the natives were fond of dropping the r's at the end of words, as exemplified in the hackneyed phrase, "Pahk the cah in Hahvahd Yahd." Not surprisingly, I heard native New Englanders consistently call this functional group an "estah."
Esters are industrially and biochemically important. Polyesters are important materials made into beverage bottles, fabric, and clothing. Fat molecules contain many ester linkages. Finally, esters are amongst the flavoring agents in foods and are used as solvents.
The IR Spectroscopy of Esters
Note that ester groups contain one C=O bond and two C-O bonds. We have already studied the IR spectroscopy of both these functional groups, so we can take a stab at predicting what their spectra might look like. Recall (1–5) that carbonyl stretching peaks are strong and generally occur between 1800 and 1600 cm-1 (assume all peak positions noted in this article will be in cm-1 units even if not explicitly stated). We also know (6) that C-O stretches are intense peaks typically seen between 1300 and 1000. Since one of the C-O bonds in the ester group is attached to the carbonyl carbon and the other is not, we might expect the two to be chemically distinct, have different force constants, and hence give rise to two separate peaks between 1300 and 1000.
As it turns out, our predictions are correct. Esters have a memorable pattern of three intense peaks at ~1700, ~1200, and ~1100 from the C=O and two C-O stretches, and hence follow what I call the Rule of Three (7). An example of the spectrum of a saturated ester, ethyl acetate, is shown in Figure 2.
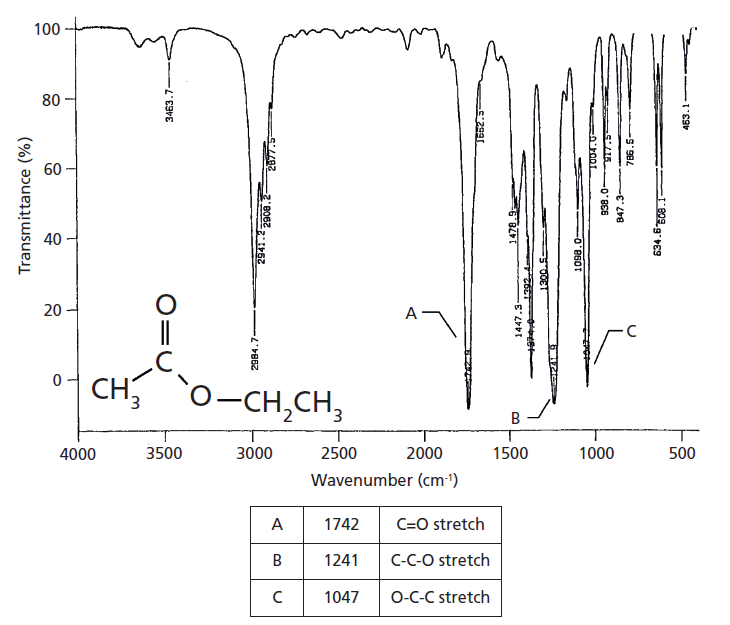
Figure 2: The IR spectrum of the saturated ester ethyl acetate. Note the Rule of Three peaks labeled A, B, and C.
Ethyl acetate is made from acetic acid and ethyl alcohol, one could in theory make it by reacting vinegar with vodka. Ethyl acetate is commonly found in foods and has a fruity flavor. It is a saturated ester because the alpha carbon is a methyl group.
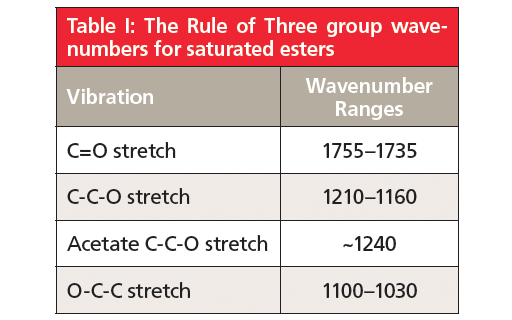
The Rule of Three peaks in Figure 2 are labeled A, B, and C and are easy to spot, sticking down like three long fingers in the middle of the spectrum. The peak at 1742 is of course the carbonyl stretch, and for saturated esters in general this peak falls from 1755 to 1735. The second peak labeled B at 1241 is from the stretching of the C-O bond to the left of the ester oxygen, which is attached to the carbonyl carbon, and also involves the stretching of the alpha carbon-carbonyl carbon C-C bond. I call this the asymmetric C-C-O stretch and this vibration is illustrated in Figure 3.
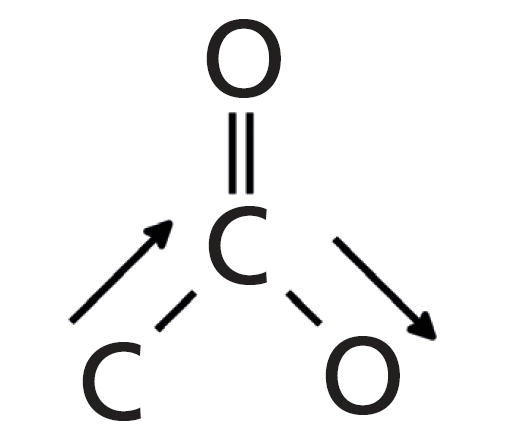
Figure 3: The C-C-O stretch of the ester functional group. This vibration is responsible for the second of the Rule of Three peaks.
In general, for saturated esters this peak falls from 1210 to 1160.
The third peak in Figure 2, labeled C at 1047, is from the stretching of the second C-O bond in the ester, which is the one to the right of the ester oxygen. This vibration will also involve any carbon attached to the right of this bond, forming an O-C-C moiety. I call this vibration the asymmetric O-C-C stretch, and it is illustrated in Figure 4.
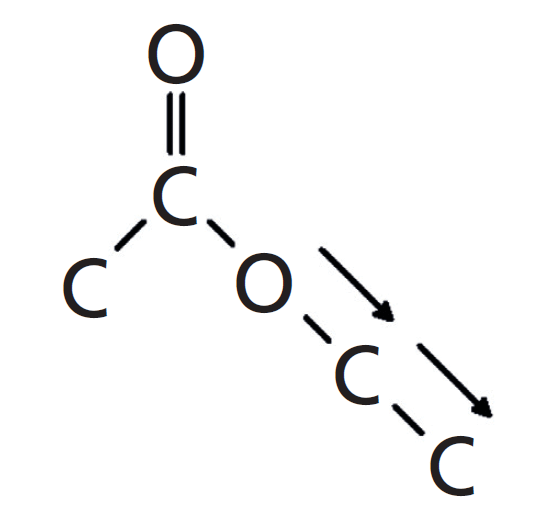
Figure 4: The O-C-C stretch of the ester functional group. This vibration is responsible for the third of the Rule of Three peaks.
For saturated esters in general the O-C-C stretch appears from 1100–1030. To be clear, a linkage such as C=O(O-CH3), which has an O-C bond rather than an O-C-C moiety, will still exhibit this peak.
If you reread this section closely you might note that I have lied to you. I stated above that for saturated esters that the C-C-O stretch falls in the 1210–1160 range, and yet clearly the C-C-O stretch of ethyl acetate falls at 1241. What is going on here? This peak is definitely a rule exception, but for once it is one we can understand and make use of. Acetate esters are unique in that the alpha carbon is simply a methyl group with nothing else attached. Recall from the first installment in this series (8) that one of the things that determines peak positions in IR spectroscopy is reduced mass, and that as the reduced mass of a functional group goes down its IR peak positions measured in wavenumber go up. A methyl group is about the lightest alpha carbon you can have in an ester, which is most likely why acetate esters have a unique high wavenumber C-C-O stretch that typically falls around 1240. Acetate esters are common because of the ubiquity of acetic acid. The fact that they have a unique asymmetric C-C-O stretching peak is helpful in discriminating them from the many other types of saturated ester.
Note in Figure 2 that as we go from left to right to peaks A, B, and C, that the third peak is a little less intense than the other two. This intensity pattern is typical of esters and can be useful in identifying them. A summary of the group wavenumbers for saturated esters is found in Table I.
Conclusions
Esters are a common and economically important functional group made by reacting an alcohol and a carboxylic acid. Their structural framework consists of a C=O group and two C-O bonds. This gives rise to three intense peaks called the Rule of Three with peak positions at approximately 1700, 1200, and 1100 wavenumbers. The three vibrations involved are the C=O stretch, a C-C-O stretch, and an O-C-C stretch. Saturated esters were studied here, aromatic esters will be covered in the next installment.
References
(1) B.C. Smith, Spectroscopy 32(9), 31–36 (2017).
(2) B.C. Smith, Spectroscopy 32(10), 28–34 (2017).
(3) B.C. Smith, Spectroscopy 33(1), 14–20 (2018).
(4) B.C. Smith, Spectroscopy 33(3), 16–20 (2018).
(5) B.C. Smith, Spectroscopy 33(5), 20–23 (2018).
(6) B.C. Smith, Spectroscopy 32(1), 14–21 (2017).
(7) B.C. Smith, Infrared Spectral Interpretation: A Systematic Approach (CRC Press, Boca Raton, Florida, 1999).
(8) B.C. Smith, Spectroscopy 30(1), 16–23 (2015).
(9) B.C. Smith, Spectroscopy 31(3), 34–37 (2016).
(10) B.C. Smith, Spectroscopy 31(5), 36–39 (2016).
(11) B.C. Smith, Spectroscopy 33(5), 20–23 (2018).
Brian C. Smith, PhD,

Brian C. Smith, PhD, has more than three decades of experience as an infrared spectroscopist. He has published numerous peer reviewed papers and has written three books on the subject: Fundamentals of FTIR and Infrared Spectral Interpretation, both published by CRC Press, and Quantitative Spectroscopy: Theory and Practice published by Elsevier. As a spectroscopic trainer, he has helped thousands of people around the world improve their infrared analyses. He earned his PhD in physical chemistry from Dartmouth College. He can be reached at: SpectroscopyEdit@UBM.com

AI Shakes Up Spectroscopy as New Tools Reveal the Secret Life of Molecules
April 14th 2025A leading-edge review led by researchers at Oak Ridge National Laboratory and MIT explores how artificial intelligence is revolutionizing the study of molecular vibrations and phonon dynamics. From infrared and Raman spectroscopy to neutron and X-ray scattering, AI is transforming how scientists interpret vibrational spectra and predict material behaviors.
Real-Time Battery Health Tracking Using Fiber-Optic Sensors
April 9th 2025A new study by researchers from Palo Alto Research Center (PARC, a Xerox Company) and LG Chem Power presents a novel method for real-time battery monitoring using embedded fiber-optic sensors. This approach enhances state-of-charge (SOC) and state-of-health (SOH) estimations, potentially improving the efficiency and lifespan of lithium-ion batteries in electric vehicles (xEVs).
New Study Provides Insights into Chiral Smectic Phases
March 31st 2025Researchers from the Institute of Nuclear Physics Polish Academy of Sciences have unveiled new insights into the molecular arrangement of the 7HH6 compound’s smectic phases using X-ray diffraction (XRD) and infrared (IR) spectroscopy.