Exploring the Applicability of Quantitative Models Based on NIR Reflectance Spectroscopy of Plant Samples
Spectroscopy
The establishment of quantitative models based on the near-infrared (NIR) spectroscopic analysis of plant samples plays an important role in improving both the scope of the models and the accuracy of prediction. This technique could provide a new method for tobacco quality management and provide a new discriminant method for other agricultural products.
The establishment of quantitative models based on the near-infrared (NIR) spectroscopic analysis of plant samples plays an important role in improving both the scope of the models and the accuracy of prediction. In this study, four types of tobacco samples and their mixed products were selected as research objects. Based on the modeling methods of the different types of tobacco, this technique could provide a new method for tobacco quality management as well as provide a new discriminant method for other agricultural products.
To improve the scope of models and the accuracy of their prediction, the establishment of quantitative models for different types of plants plays an important role. The quality characteristics of common food and cash crops, including wheat, rice, corn, tea, and tobacco, among others, differ because of genetic differences. Among these crops, tobacco exhibits typical characteristics of plants and can be divided into several types, including flue-cured tobacco, burley tobacco, dark sun-cured tobacco, and oriental and aromatic tobacco. Moreover, total nitrogen and total alkaloid contents are two important indicators of quality evaluation in tobacco and its products. The total nitrogen content is determined by the classical Kjeldahl method, and the total nicotine content is determined by continuous flow analysis (1,2). However, both methods are limited by the need for complex preprocessing, and the testing processes are time-consuming and can delay results; therefore, these methods do not meet the rapid detection and quality control needs of scientific research or the on-site quality acceptance of tobacco leaves. At present, local regression modeling and consensus modeling are used to analyze homogeneous plant samples that exhibit regional and temporal differences (3–7). Beyond ensuring the applicability of models, significantly improving their accuracy is difficult, so it is important to develop a fast and accurate quantitative analysis method for improving the applicability of the models.
As a nondestructive and rapid analytical method, near-infrared (NIR) spectroscopy has been widely used for the qualitative analysis of various organic feedstocks and for physical and chemical quantitative analyses across the food, pharmaceutical, and agricultural industries (8,9).
A variety of chemical composition tests using quantitative NIR analysis have recently been carried out on flue-cured tobacco, burley tobacco, oriental and aromatic tobacco, and other types of tobacco (10–17). Previously, Tonini reported an NIR model of the total sugar content in both flue-cured tobacco and oriental and aromatic tobacco (18). The results were as follows: For flue-cured tobacco, the standard error of calibration (SEC) was 0.802 and the standard error of prediction (SEP) was 1.208; whereas for oriental and aromatic tobacco the SEC was 0.883, and the SEP was 0.976. These results showed that the single models were more accurate than were the hybrid models. Then, new pattern recognition methods by Zhang (19) using a partial least squares support vector machine (PLS-SVM) approach and by Shao (20) using wavelet transform combined with an artificial neural network (WT-ANN) were used to establish the quantitative and discrimination models and showed an excellent prediction performance for rapid and accurate analysis of routine chemical compositions in tobacco. To date, however, most studies essentially report quantitative analysis methods of the main chemical constituents of flue-cured tobacco. The comparison of NIR single and hybrid models for total nitrogen and total alkaloid contents in other tobacco types has not been reported, which strongly limits the applicability of quantitative models.
In this study, different types of tobacco were used as research samples. The total nitrogen content was determined by the Kjeldahl method, and the total alkaloid content was determined by continuous flow analysis. The spectra were determined by Fourier transform NIR spectroscopy and were preprocessed by the first derivative and smoothing methods. Single and hybrid quantitative analysis models for total nitrogen and total alkaloid contents in flue-cured tobacco, burley tobacco, dark sun-cured tobacco, oriental and aromatic tobacco, and mixed tobacco were ultimately established successively through the use of PLS and PLS-discriminant analysis (PLS-DA).
Materials and Methods
Materials
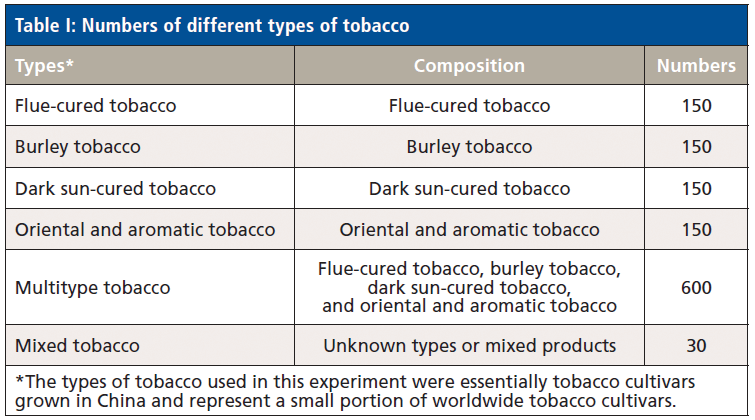
All the experimental samples of different tobacco types were collected at the Beijing Third Class Tobacco Supervision Station within a three-year period and are shown in Table I.
Spectral Measurements
A multipurpose analyzer with a near-infrared integrating sphere diffuse reflection accessory in reflectance mode (Bruker Optics Inc.) was used to measure spectra. In the experiments, wavenumbers ranging from 12,000 to 3500 cm-1 were measured at a digitization interval of approximately 8 cm-1. The scan rate was 64 within 30 s, and all measurements were performed at room temperature. OPUS 7.0 quantitative analysis software (Bruker Optics Inc.) was used. The average of three normal spectra per sample was used.
Methods of Chemical Analysis
The total nitrogen in the tobacco samples was determined using a B-339 nitrogen analyzer (Buchi Labortechnik AG) in accordance with the Chinese tobacco industry YC/T 33-1996 standard. The total alkaloid content in the tobacco samples was determined using an AA3 continuous flow analyzer (Bran + Luebbe) in accordance with the Chinese tobacco industry YC/T 160-2002 standard. These data were used for subsequent modeling.
Analytical Methods
PLS was used to establish quantitative models of total nitrogen and total alkaloids for flue-cured tobacco, burley tobacco, dark sun-cured tobacco, oriental and aromatic tobacco, and mixed tobacco (21). Internal cross validation was used to determine the statistical parameters of the predictive NIR spectroscopy models. The calibration models were validated by verification sets. The SEP and mean of the SEP between the measured values and the predicted values of total nitrogen and total alkaloids were used as the evaluation parameters (22,23).
PLS-DA is a supervised pattern recognition method based on PLS and a combination of PLS regression and the discrimination analysis for classification tasks (24,25). The method uses a priori classification knowledge to establish a classification model using PLS-DA and then uses that model to discriminate the attributions of the samples to be tested.
Results and Discussion
Establishment of Single and Hybrid Models
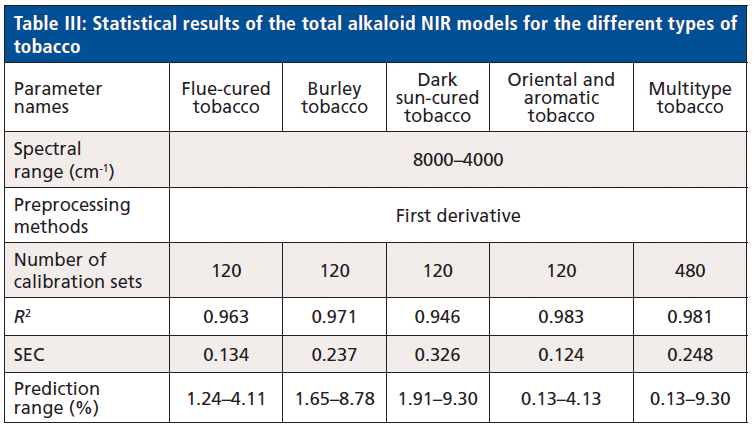
For each type of tobacco, 150 samples were collected. Based on the distribution of total nitrogen and total alkaloid concentrations, 120 samples were selected for the modeling set, and the remaining samples (comprising 30 samples of mixed tobacco) were used for the validation set. Summaries of the statistical analysis results of the partially optimized PLS of the models of the different tobacco types for the total nitrogen and total alkaloid contents are shown in Tables II and III.
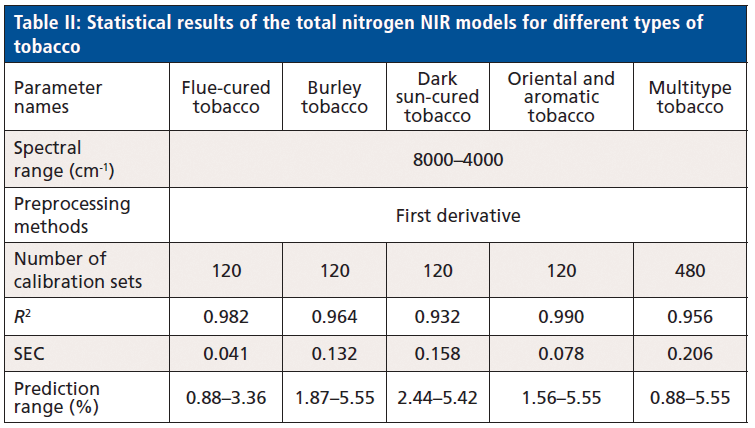
Both tables show that the R2 of the quantitative NIR models of total nitrogen and total alkaloids among flue-cured tobacco, burley tobacco, dark sun-cured tobacco, oriental and aromatic tobacco, and multitype tobacco were greater than 0.90; the SEC values of the calibration sets were lower than 1; and the calibration models had better predictive ability.
Contrastive Verification of Models
The external prediction of the single and hybrid quantitative calibration models for total nitrogen and total alkaloids was carried out by using the 30 validated samples. The predictive results of the different quantitative NIR analysis models for total nitrogen and total alkaloids are shown in Tables IV and V; the results are reported as SEP values. The prediction results of total nitrogen from the different models of tobacco are shown in Tables VI and VII; the results are reported as the means of the SEP. Among these models, S-K, S-Mu, H-S, S-Mi, and H-Mi represent single models predicting known samples, single models predicting multitype samples, hybrid models predicting known samples, single models predicting mixed samples, and hybrid models predicting mixed samples, respectively.

As shown in Tables IV and VI, in the forecast of the quantitative model of the total nitrogen content in the different types of tobacco (the data in the table are bold and italicized), the single models can predict known samples of total nitrogen. The SEP values of flue-cured tobacco, burley tobacco, dark sun-cured tobacco, and oriental and aromatic tobacco were lower than those of the single models predicting multitype samples, demonstrating that the S-K models are better than the S-Mu models. Further, the error rate for predicting total nitrogen was reduced by 42.5% and for total alkaloids by 63.8%, indicating that single models could predict only known samples but not mixed samples.

The comparison of the S-Mi and H-Mi models shows that the mean of the SEP was 0.210 for S-Mi, which was greater than that for H-Mi (0.185), so the accuracy of the single models predicting mixed samples was clearly weaker than that of the hybrid models. Compared with that of H-K, the error rate of H-Mi was reduced by 11.9% for total nitrogen and by 69.5% for total alkaloids. This finding indicates that the hybrid models are more suitable and broadly applicable; they can be used for the quantitative analysis of mixed products and are suitable for the quantitative analysis of other agricultural plants (for example, different varieties of corn and different modulation methods of tea). In particular, regarding the comparisons of H-K and S-K with S-Mu, for unknown types of tobacco, the H-K model can be applied, but its predictive effect is weaker than that of the S-K model but stronger than that the S-Mu model.
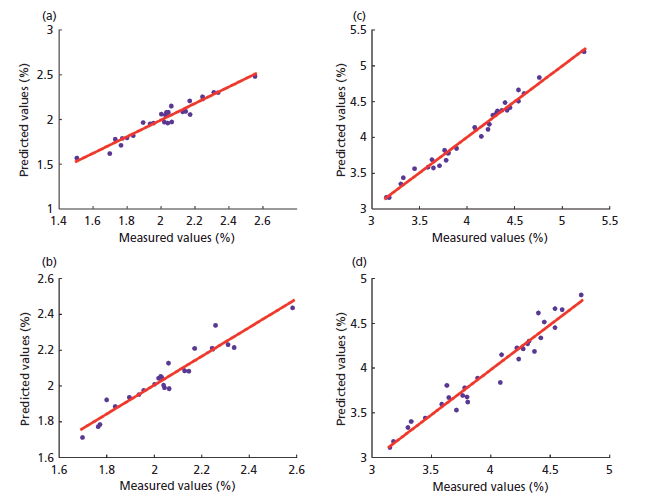
Figure 1: Comparison of single models predicting known samples and hybrid models predicting known samples of the total nitrogen of flue-cured tobacco and burley tobacco: (a) flue-cured tobacco and flue-cured tobacco, (b) burley tobacco and burley tobacco, (c) multitype tobacco and flue-cured tobacco, and (d) multitype tobacco and burley tobacco.
To verify the predictive effects, we further took flue-cured tobacco and burley tobacco as examples in this work and comparatively analyzed the total nitrogen and total alkaloids from the single model prediction of flue-cured tobacco (or burley tobacco) and hybrid model prediction of flue-cured tobacco (or burley tobacco) as well as from the single model prediction of mixed tobacco and hybrid model prediction of mixed tobacco. The correlations between the measured values and the predicted values of the verification sets are shown in Figures 1–4.
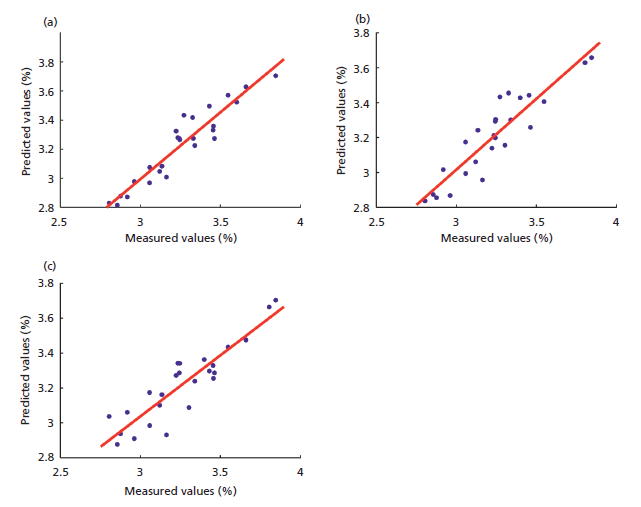
Figure 2: Comparison of single models predicting mixed samples and hybrid models predicting mixed samples of the total nitrogen of flue-cured tobacco and burley tobacco: (a) flue-cured tobacco and mixed tobacco, (b) burley tobacco and mixed tobacco, and (c) multitype tobacco and mixed tobacco.
As shown in Figures 1–4, the total nitrogen and total alkaloids of the different tobacco types were concentrated on both sides of the line, and a high degree of analysis accuracy occurred with respect to the relationship between the measured values and the predicted values of the verification sets. Figures 1 and 3 show that the predictive effect of the single models is clearly better than that of the hybrid models. By contrast, Figures 2 and 4 show that the hybrid models constructed in this study have a wider predictive range for predicting mixed samples.
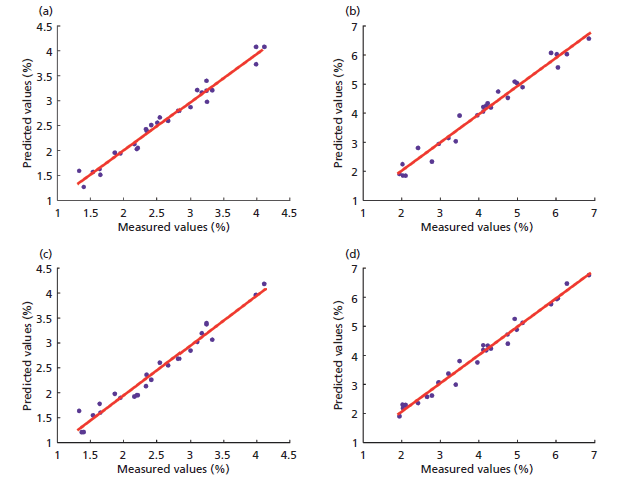
Figure 3: Comparison of single models predicting known samples and hybrid models predicting known samples of the total alkaloids of flue-cured tobacco and burley tobacco: (a) flue-cured tobacco and flue-cured tobacco, (b) burley tobacco and burley tobacco, (c) multitype tobacco and flue-cured tobacco, and (d) multitype tobacco and burley tobacco.
Model Discriminant Analysis of Qualitative and Quantitative Combinations of Different Types of Tobacco
In practical applications, unknown sample types are often present. In general, one way of estimating sample types involves the use of hybrid models, and then, based on the predicted results and the empirically determined total nitrogen and total nicotine contents of the tobacco, samples suitable for classification are selected. To improve the accuracy of quantitative NIR analysis, the use of qualitative discrimination followed by a single quantitative analysis model can be employed.
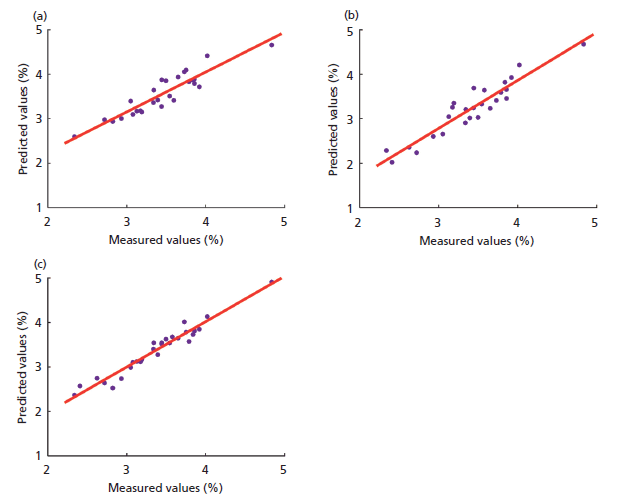
Figure 4: Comparison of single models predicting mixed samples and mixed models predicting mixed samples of the total alkaloids of flue-cured tobacco and burley tobacco: (a) flue-cured tobacco and mixed tobacco, (b) burley tobacco and mixed tobacco, and (c) multitype tobacco and mixed tobacco
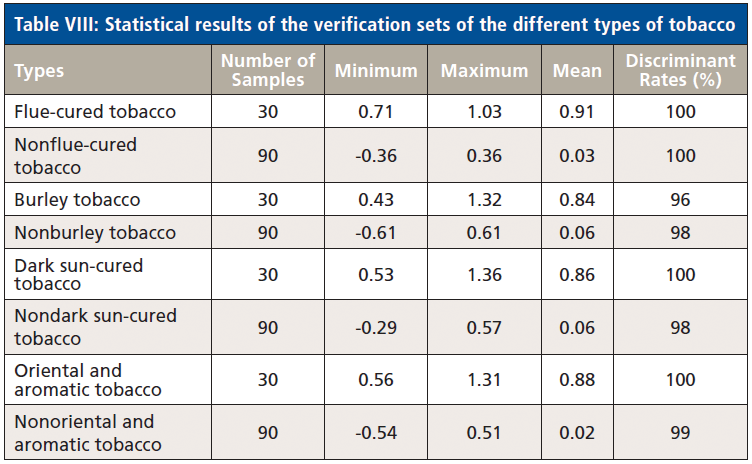
PLS-DA, which is based on both qualitative and quantitative algorithms, can be used to determine the chemical composition of unknown samples. The PLS-DA was performed before the second derivative and smoothing (17) transformations, and cross validation was used to determine that the value of the factor was 10. The qualitative discriminant analyses between the different types of tobacco are shown in Figure 5, and the discriminant rates are shown in Table VIII.
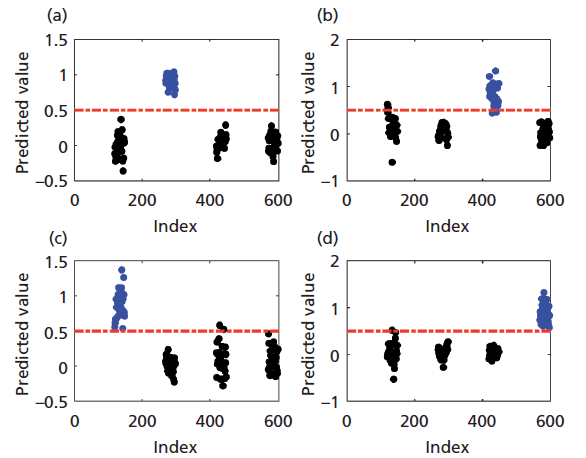
Figure 5: Prediction results based on PLS-DA of the various tobacco types: (a) flue-cured tobacco, (b) burley tobacco, (c) dark sun-cured tobacco, and (d) oriental tobacco.
Figure 5 shows that the qualitative identifications of the flue-cured tobacco were all correct, as were those of other sample types. Two of the burley tobacco types were incorrectly identified, but the others were correctly identified; two of the other sample types were mistaken as burley tobacco. The qualitative identifications for the dark sun-cured tobacco were all accurate, but the other sample types of two burley samples were mistaken as dark sun-cured tobacco. The qualitative identifications for the oriental tobacco were also all correct; among the other sample types, one dark sun-cured tobacco sample was mistaken as oriental and aromatic tobacco, but the rest were correctly identified.
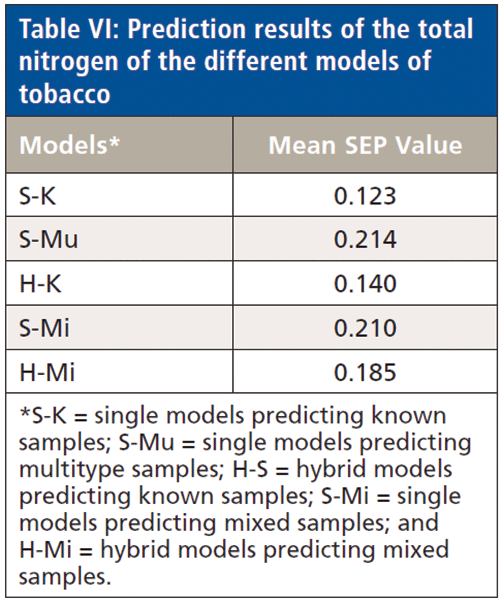
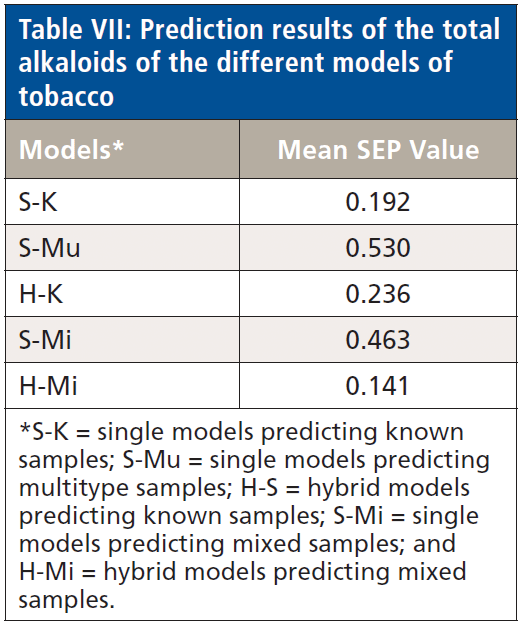
Table VIII shows that the discriminant rates of the different tobacco types were all above 95%, effectively improving the prediction accuracy of the quantitative NIR analysis. These results also confirm that significantly improving the accuracy of plant regression and quantitative NIR analysis methods is difficult.
Conclusions
This article describes the use of PLS and PLS-DA to establish quantitative single and hybrid NIR spectroscopy models for estimating total nitrogen and total alkaloid contents. The means of the SEP from the S-K, S-Mu, S-Mi, H-K, and H-Mi models were 0.123, 0.214, 0.140, 0.210, and 0.185 for total nitrogen and 0.192, 0.530, 0.236, 0.463, and 0.141 for total alkaloids; the error rates were clearly reduced. The single models were more accurate and exhibited stronger predictive ability; thus, these models can be used to predict known sample types. The hybrid models were applied to mixed tobacco. For unknown types of tobacco, the use of qualitative discrimination followed by the S-K model for unknown sample types effectively improved the prediction accuracy of the quantitative NIR models. This technique could constitute a new method for tobacco quality management. The quantitative models are also applicable to the NIR spectroscopic analysis of other plant samples and represent a new discriminant method for other agricultural products whose appearance is unclear or misleading for various reasons.
References
(1) W.B. Jin , and Y. Dai, Tobacco Chemistry (Tsinghua University Press, Beijing, China, 1994).
(2) G.D. Zhou, Dictionary of Chemistry (Chemical Industry Press, Beijing, China, 2004).
(3) T. Naes, T. Isaksson, and B. Kowalski, Anal. Chem. 62, 664–673(1990).
(4) Z. Wang, T. Isaksson, and B.R. Kowalski, Anal. Chem. 66, 249–260(1994).
(5) V. Centner, and D.L. Massart, Anal. Chem.70, 4206–4211(1998).
(6) Y.K. Li, X.G. Shao, and W. Cai, Chem. J. Chin. Univ. 28, 246–249(2007).
(7) Y.K. Li, X.G. Shao, and W. Cai, Talanta 72, 217–222 (2007).
(8) C.C. Fagan, C.D. Everard, and K. McDonnell, Bioresour. Technol. 102, 5200–5206 (2011).
(9) N. Zhao, Z.S. Wu, and Q. Zhang, Sci. Rep. 5, 11647 (2015).
(10) W. McClure, K. Norris, and W. Weeks, Beitr. Tabakforsch. 9, 13–18 (1977).
(11) Y. Ma, R. Bai, and G. Du, Anal. Methods 4, 1371–1376 (2012).
(12) J.T. Diffee, Pract. Spectrosc. 13, 433–473 (1992).
(13) T. Qiao, J. Ren, and C. Craigie, Appl. Spectrosc. 13, 782 (2015).
(14) M. Schmutzler, and A. Beganovic, Food Control. 57, 258–267 (2015).
(15) J.P. Wold, D. Airado-Rodriguez, and A.K. HoltekjØlen, J. Agric. Food Chem. 65, 1813–1821 (2017).
(16) H. Chen, C. Tan, and Z. Lin, Spectrochim. Acta A Mol. Biomol. Spectrosc. 189, 183–189 (2017).
(17) J.P. Zhang, W.Y. Xie, and R.X. Shu, Tob. Sci. Technol. 3, 37–38(1999).
(18) A. Tonini, S. Commella, and G. Mellone, Ann. Ist Spec. Tab. 99, 85365 (1981).
(19) Y. Zhang, Q. Cong, and Y. Xie, Spectrochim. Acta A. 71, 1408–1413 (2008).
(20) Y. Shao, Y. He, and Y. Wang, Eur. Food Res. Technol. 224, 591–596 (2007).
(21) S. Wold, M. Sjöström, and L. Eriksson, Chemometr. Intell. Lab. Syst. 58, 109–130 (2001).
(22) Y.L. Yan, Technology and Application of NIR Spectra Analysis (China Light Industry Press, Beijing, China, 2013).
(23) Y.L. Yan, B. Chen, and D.Z. Zhu. Qualitative Analysis Methods of Near Infrared Spectroscopy (Chinese Light Industry Press, Beijing, 2013).
(24) M. Bevilacqua, and F. Marini, Anal. Chim. Acta. 838, 20–30 (2014).
(25) W. Lu, Q. Jiang, and H.Shi, J. Agric. Food Chem. 62, 9073–9080 (2014).
Yuqing Yang and Junhui Li are with the College of Information and Electrical Engineering at China Agricultural University in Beijing. Li Ma, Guorong Du, and Yanjun Ma are with the Beijing Third Class Tobacco Supervision Station in China. Direct correspondence about this article to Yuqing Yang at 519215532@qq.com, to Junhui Li at caunir@cau.edu.cn, or to Yanjun Ma at 13366036175@189.cn
Geographical Traceability of Millet by Mid-Infrared Spectroscopy and Feature Extraction
February 13th 2025The study developed an effective mid-infrared spectroscopic identification model, combining principal component analysis (PCA) and support vector machine (SVM), to accurately determine the geographical origin of five types of millet with a recognition accuracy of up to 99.2% for the training set and 98.3% for the prediction set.
Authenticity Identification of Panax notoginseng by Terahertz Spectroscopy Combined with LS-SVM
In this article, it is explored whether THz-TDS combined with LS-SVM can be used to effectively identify the authenticity of Panax notoginseng, a traditional Chinese medicine.