Flower Classification Using LIBS Combined with PCA Chemometrics
Classification of flowers is required to promote their appreciation, value, and application. In this study, laser-induced breakdown spectroscopy (LIBS) was applied in conjunction with principal component analysis (PCA) to identify and classify flower species. Three flowers of similar color or shape were selected as the experimental samples. Laser pulses were directed at the sample surface to form plasma, from which light was collected, and the spectra were analyzed to identify the surface material. The spectral data of 240 groups of experimental samples were obtained using LIBS. Spectral data were pretreated, and the 28 characteristic spectral intensity ratios of six characteristic elements (Na, Mg, Al, K, Si, Ca) of flower species after normalization were chosen to constitute a matrix (240×28) of spectral data. The data were compressed, after which their dimensionality was reduced to reduce the number of output variables of the model for PCA from 28 to 3. Finally, cluster analysis of the flowers was performed, and a standard sample database of flowers was established. Subsequently, a template matching model (TMM) was used as a model for training. The accuracy of the entire TMM model was 97%.
Species identification and elemental detection of flowers are of great significance for exploring new plant varieties and developing the edible value of plants. In nature, numerous types of plants exist with various flowers. Moreover, the same kind of plant may have a variety of flowers with different colors and shapes. For a long time, people have relied on artificial measurements and qualitative descriptions to classify flower varieties directly from flower color or shape, which is highly subjective and random. To improve the classification accuracy of flower varieties, some traditional classification methods, such as the color difference method (1,2) and DNA molecular labeling (3,4) have been utilized. The disadvantage of these methods is that the requirements for the color measurement environment, background color, and light source of the flowers are strict. Since the development of computer and software technologies, digital image processing and pattern recognition are being increasingly used in flower classification (5–8). However, the classification results depend on the quality of the flower images and image processing algorithms. It is difficult to classify flowers of similar colors or shapes. In addition, these classification methods do not reflect the composition and content of elements in the flowers. For element detection in flowers, several methods, including gas chromatography–mass spectrometry (GC-MS) (9), atomic absorption spectrometry (10), and inductively coupled plasma atomic emission spectroscopy (ICP-AES) (11) have been applied. The accuracy of the results obtained from analysis depends on the effectiveness of sample pretreatment and chromatographic separation conditions. Although the results are accurate, sample pretreatment and analysis processing are complex, and it is difficult to realize real-time online classification and component detection of flowers.
Laser-induced breakdown spectroscopy (LIBS) has several advantages, including no need for sample preparation, high analysis speed, and simultaneous multi-element detection. Therefore, it has emerged as a ‘future superstar’ in the analytical atomic spectrometry field(12), as it can be used for sample identification and classification of gases, liquids, and solids based on the emission from laser-induced plasma. Recently, abundance of spectral data analysis methods have improved the ability of LIBS to detect and classify target samples in food security (13,14), soil monitor (15,16), industrial control (17,18), and deep-sea exploration (19,20). To date, numerous algorithms have been developed for the identification and classification of target samples. Sezer and associates (21) classified two cheese types using LIBS coupled with a principal component analysis model and a partial least squares discriminant analysis model. A prediction ability of 100% was obtained for classifying the Kashar samples. Yang and coauthors.(22) demonstrated that LIBS combined with a convolutional neural network (CNN) is a promising method for geochemical sample identification/classification in the Tianwen-1 mission and in future planetary exploration missions. Park and associates (23) proposed a two-step partial least squares-discriminant analysis (PLS-DA) modeling approach to improve the classification accuracy of edible se salt products. Yang and colleagues (24) showed that LIBS coupled with support vector machine (SVM) algorithms can be used to distinguish healthy navel oranges from HLB-asymptomatic navel oranges with a classification accuracy of 100%. Harefaand associates (25) improved the classification accuracy of five different types of aluminum alloys by utilizing the manifold dimensionality reduction technique and a support vector machine (SVM) classifier model integrated with LIBS. Alfarraj and coauthors (26) identified mineral elements in four milk samples and predicted milk fat levels in milk samples using the LIBS technique and principal component analysis (PCA). Bhatt and associates (27) compared and identified different parts of cauliflower by combining univariate analysis of the characteristic intensity ratio of LIBS with multivariate analysis using PCA.
Among these algorithms, PCA could simplify the analysis and processing of spectral datasets. PCA is a mathematical coordinate transformation method that emphasizes the variance of datasets and reduces redundancy, and is often employed for cluster analysis of various substances. In this study, LIBS was applied in combination with PCA to conduct clustering analysis of flower species with similar characteristics, such as color or shape.
Materials and Methods
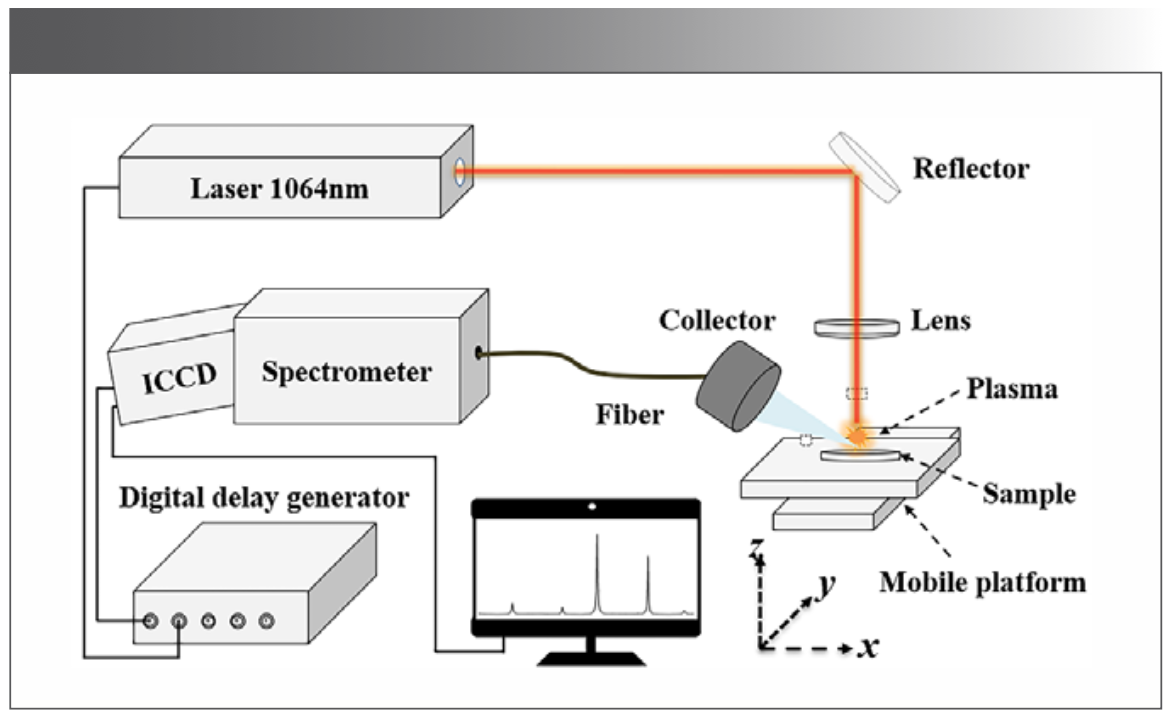
A schematic representation of the LIBS system used in this study is shown in Figure 1. The excitation light source applied for plasma generation was a 1064 nm beam of a Q-switched Nd:YAG laser with a repetition rate of 3 Hz and a pulse duration of 8 ns. The pulsed laser with an energy of 100 mJ was adjusted in its direction via a 45° reflector, and was perpendicularly focused onto the sample surface using a plano-convex lens with a focal length of 100 mm; the distance from the lens to the sample is 96 mm. To avoid sample damage, the flower sample was mounted on a 3D translation stage to provide a fresh surface after each laser shot. The sample materials were evaporated, melted, vaporized, and then ionized to form a highly energetic plasma with multi-element information in the flower samples. The plasma emission was coupled to the optical fiber by a collector, and the spectra were recorded using a spectrometer (Andor, Mechelle 5000, the resolution ability λ/∆λ is 5000) equipped with an intensified charge-coupled device (ICCD, Andor, iStar DH-334). The ensemble enabled the measurement of plasma emission spectra from 200 to 875 nm.
FIGURE 1: Schematic diagram of the LIBS system.
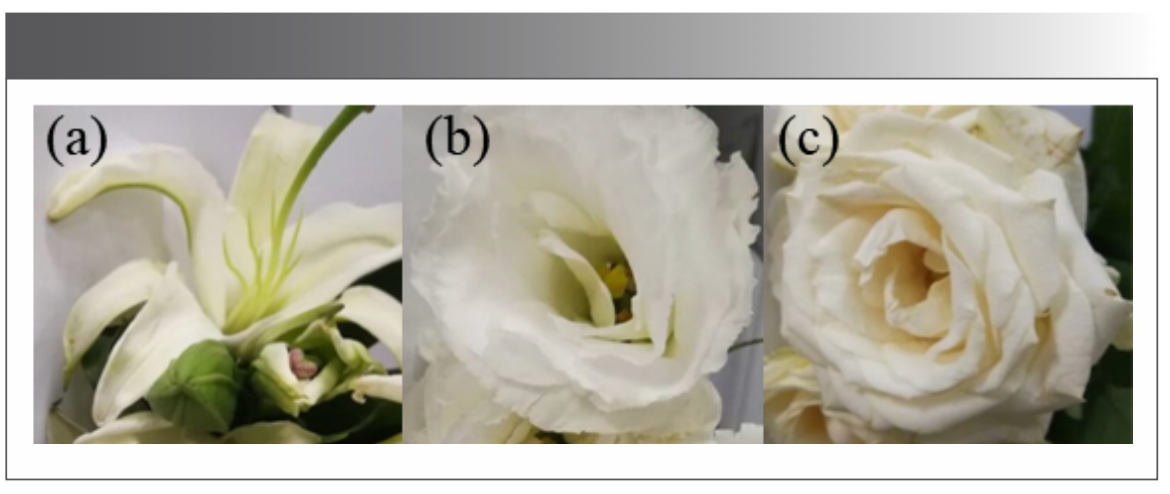
Three kinds of flowers, white lily, white platycodon, and white rose, all which have similar color or shape, were selected for analysis, as shown in Figure 2. The flower samples were simply pretreated. We took the same part of the petals of each flower. These petals were dried in a 50–60 °C drying oven, and then ground to powder, sieved through 100 mesh, ground again, and pressed for 20 min at 25 Mpa by mechanical tabletting machine. A tablet press was employed to obtain flower wafers of size Φ 20 mm × 3 mm. Each variety of flower has 80 samples.
FIGURE 2: Flower samples: (a) white lily; (b) white platycodon; and (c) white rose.
Each sample was randomly subjected to multi-point ablation to increase the stability and adaptability of the model. One spectrum was collected for each sample, and the spectrum was accumulated by twenty laser pulse. The delay time and gate width were fixed at 3 µs and 20 µs, respectively.
Results and Discussion
Analysis of Spectral Clustering Characteristics of Flower Samples
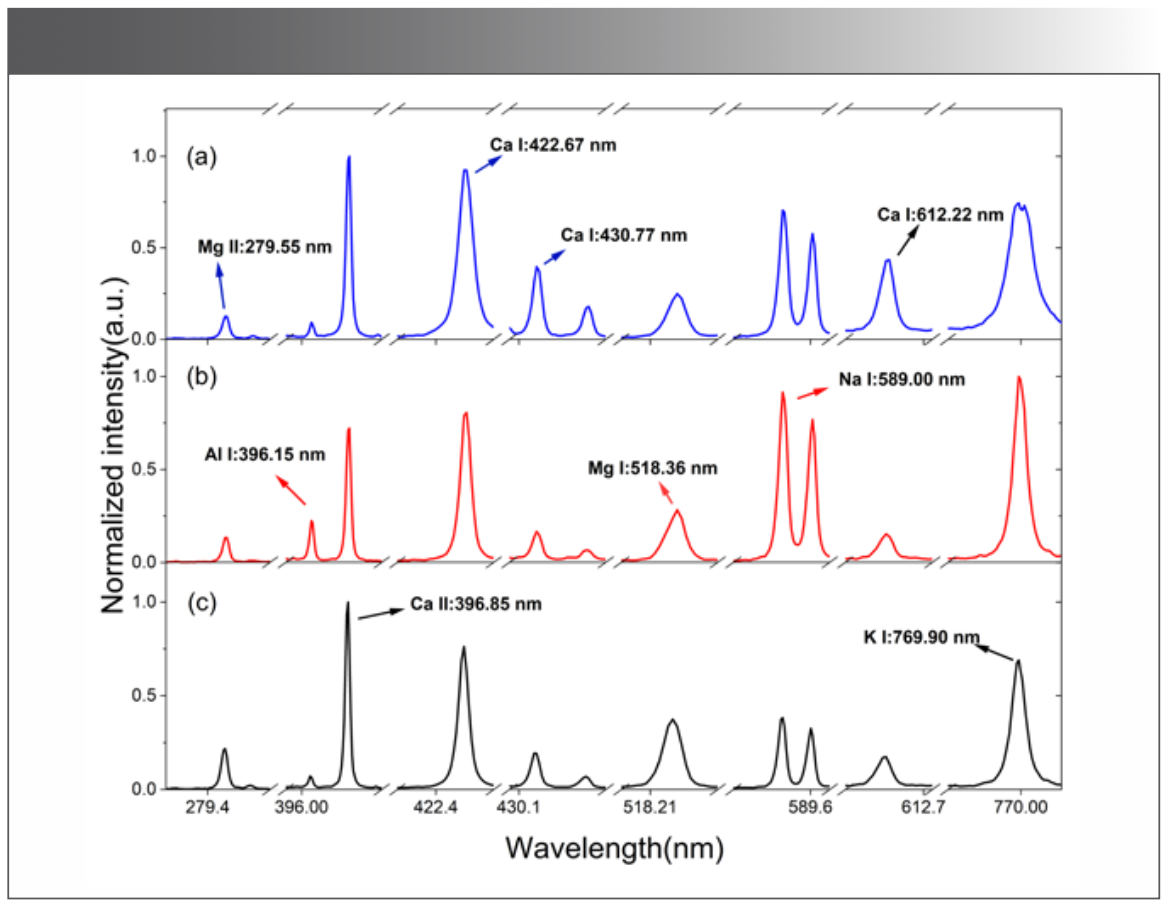
Flower LIBS spectra showed that emission spectral lines originated from some macronutrients (C, H, O, N, P, Ca, Mg, S, Na, K, etc.) as well as some micronutrients (Fe, B, Mn, Cu, Zn, Mo, Cl, Si, etc.). The spectra shown in Figure 3 were obtained after normalizing the global spectral intensity of the spectral data of the three flower samples to reduce the influence of the pulse-to-pulse fluctuation.
FIGURE 3: LIBS spectra of (a) white lily; (b) white platycodon; and (c) white rose.
Because LIBS spectra have abundant spectral lines and a wide field of wavelengths, selecting global spectral data for data processing would not only be redundant and time-consuming, but would also lead to invalid data. Moreover, it would interfere with the establishment of the PCA classification model, reduce the efficiency and accuracy of modeling, and fail to meet the needs of rapid and accurate flower classification. Therefore, it was necessary to extract the characteristic spectral lines of the flower samples. Because the elements of these three flowers were similar, macronutrients (Na, Mg, K) and micronutrients (Ca, Al, Si) were selected in flower samples, and the intensity ratios of characteristic spectral lines were adopted as the characteristic variables.
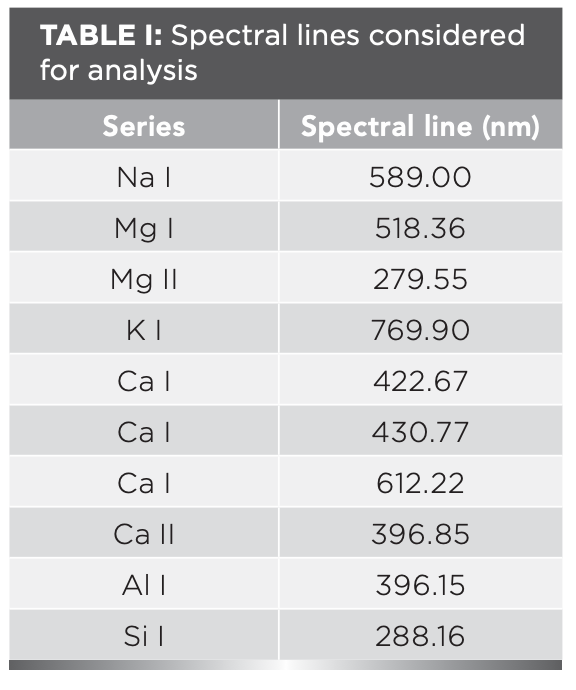
The following conditions should be met when selecting the spectral lines prior to data analysis: (1) there are seldom any interference spectral lines near the spectral lines; and (2) the spectral lines are sufficiently strong and sensitive. Based on the above requirements, after consulting the NIST standard database, ten characteristic spectral lines of the six elements of interest were determined, as shown in Table I.
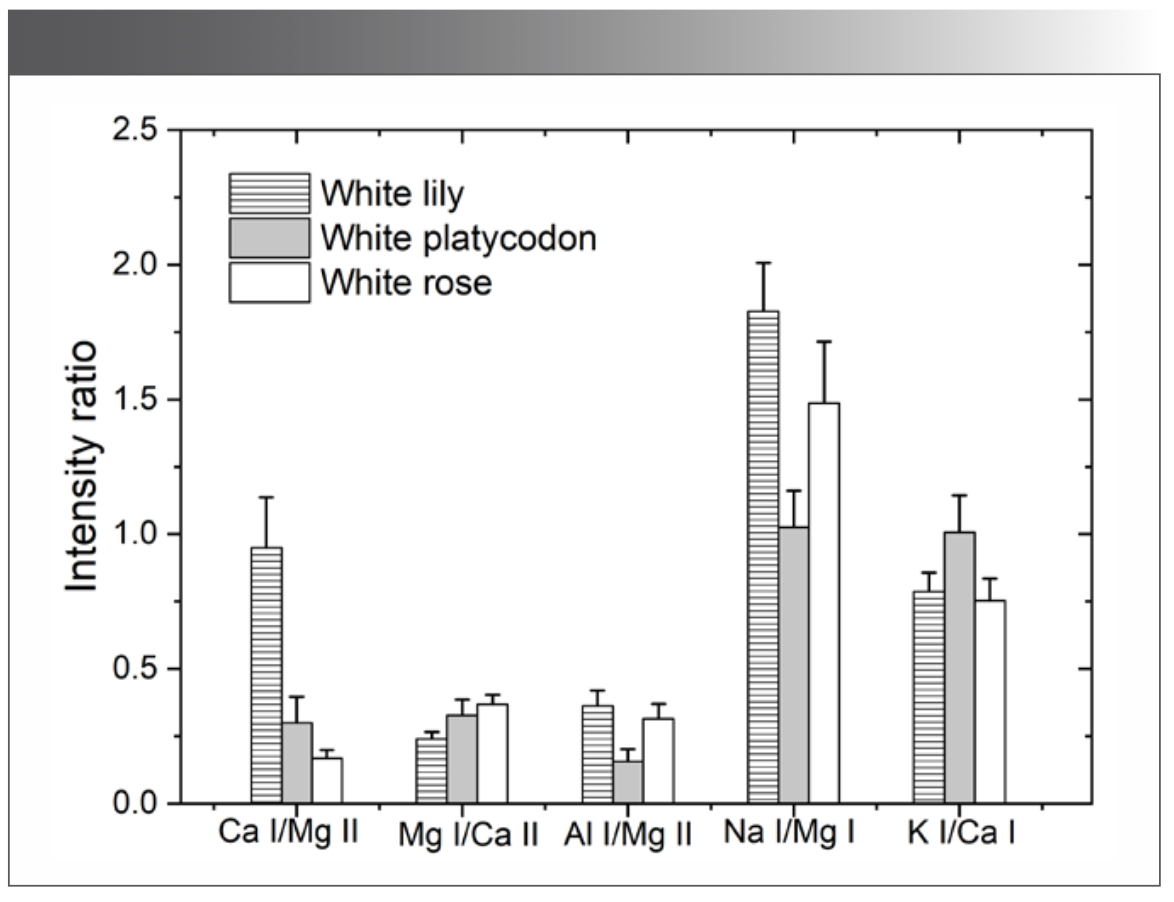
The 28 characteristic spectral intensity ratios of the 6 elements (Na, Mg, Al, K, Si, Ca) of interest after normalization were selected as the input. PCA was performed on 240 groups of spectral data of three flower standard samples, and the transfer matrix was obtained. The intensity ratios of some characteristic spectral lines (Ca I:430.77 nm/Mg II: 279.55 nm, Mg I:518.36 nm/Ca II: 396.85 nm, Al I:396.15 nm/Mg II: 279.55 nm, Na I:589.00 nm/Mg I:518.36 nm, K I:769.90 nm/Ca I:422.67 nm) of the three flower standard samples are plotted in Figure 4. In PCA, the clustering effect is reliable when there are obvious discrepancies between the components of the analyzed substances. As shown in Figure 4, certain differences exist in the intensity ratios of the characteristic spectral lines of the same or various flower standard samples, which can be employed as characteristic variables of the flower standard samples.
FIGURE 4: Comparison of some intensity ratios of the characteristic spectral lines.
The 80 samples of each kind flower were divided into two groups, 60 samples were taken for spectral clustering analysis and standard template establishment, and the other 20 samples were used as test samples to evaluate the accuracy of classification. The spectral line intensity ratios of 28 characteristics, composed of 6 elements (Na, Mg, Al, K, Si, Ca), were used as inputs for principal component analysis of 180 flower samples. The result of spectral clustering analysis are shown in Figure 5. The contribution rates of the principal components and cumulative contribution rates were calculated, as shown in Figure 5a. The first three principal components contribute to 80.3% of the total variance.
FIGURE 5: The result of spectral clustering (a) Principal component contribution rate and cumulative contribution rate; and (b) three-dimensional scatter plots of PCA for the three kinds of flower samples.
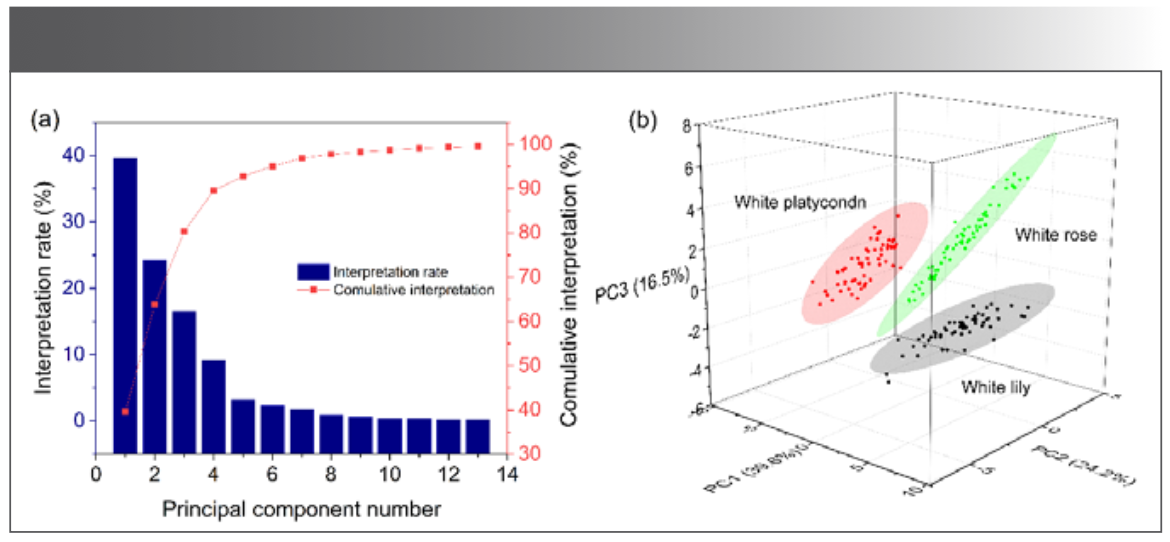
The three-dimensional scatter plots of PCA for the cluster analysis of the three flower samples are shown in Figure 5b. It can be seen from the figure that the three principal components can basically characterize all the spectral information of the flowers, thus realizing the effective clustering characteristics analysis of the three flower samples. Therefore, the standard templates of the three flowers were established by using the 28 characteristic spectral line intensity ratios of 60 samples of each kind of flower.
Recognition and Classification of the Flower Varieties
The flower standard sample database, Q (180×28), was established using PCA. Through PCA clustering analysis, standard templates of three flower samples were obtained, and the testing sets of flower samples were compared with a standard template using a template matching model (TMM). Their similarity was applied to the recognition of flower samples. Suppose three standard samples of the flowers are 1, 2, and 3, and the testing sets of flower samples are X and its characteristic vectors are n-dimensional features: X1= (x11, x12,…, x1n)T, X2= (x21, x22,…, x2n)T, and X3= (x31, x32,…, x3n)T. The testing sets of samples were compared with the standard sample template, and the TMM and the minimum distance discriminant method were adopted.
X1, X2, and X3 are the three known categories, and each category has 28 vectors, such as Xi:
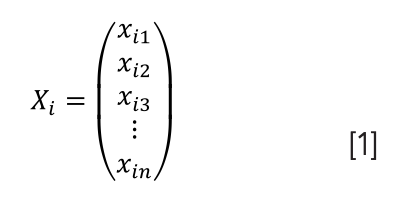
For the samples to be tested, its vector was described as follows:

The distance d (Xi, X) was calculated. If there was a certain i such that:

And the distance from X to Xi is the closest, then X ϵ ωi. The distance between X and Xi can be expressed as:

In the formula, XT Xi + XiT X -XiT Xi is a linear function with characteristics that can be applied as a discriminant function:

If d(X,Xi)=min{di(X)}, Xϵωi, then the flower sample to be tested was identified.
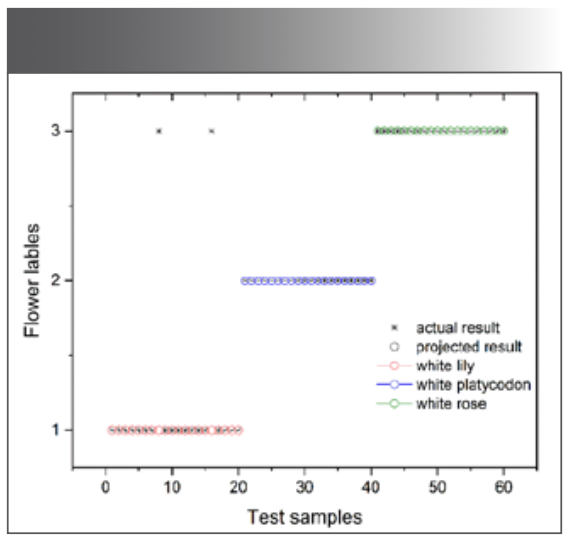
According to equation 4 and equation 5, these samples were compared for similarity with those in the database using the TMM, and the categories of the samples in the testing sets were identified. The accuracy of the classification results was evaluated using the application interface, as shown in Figure 6. Samples 1, 2, and 3 represented white lily, white platycodon, and white rose, respectively. Each sample category had 20 groups of spectral data, amounting to a total of 60 groups. The actual tested samples were classified as samples from the application interface, whereas the predicted tested samples were samples from the standard sample database. Compared with the 60 groups of tested samples, there were two errors in the classification of Sample 1, which should be divided into the position of Sample 3, and the accuracy rate reached 90%. For samples 2 and 3, the accuracy rate can reach 100%, and combined with all test samples, the final accuracy rate is 97%.
FIGURE 6: Recognition and classification results for the three kinds of flowers.
Conclusions
In conclusion, the results presented in this study demonstrate the feasibility of the LIBS technique for the rapid identification and classification of flower species by extracting the spectra of their petals. In this work, the LIBS technique in conjunction with PCA and TMM were applied to identify and classify flower species, and 28 intensity ratios of the 6 elements were selected as input variables to establish a standard template for flower samples. The spectral data underwent dimensionality reduction and cluster analysis through PCA. Eventually, the model for TMM was predicted between real tested sets and predicted tested sets, and the true classification rates were 90%, 100%, and 100% for white lily, white platycodon, and white rose, respectively. This paper examines the feasibility of using LIBS technology for flower species classification and proposes an effective method for achieving this. Future work will focus on researching classification algorithms and quantitatively analyzing elements in flower samples using LIBS technology to achieve accurate identification of flower samples and real-time detection of elemental content.
Declaration of Competing Interests
The authors declare that they have no known competing financial interests or personal relationships that could have influenced the work reported in this study.
Acknowledgments
This project was supported by Key Scientific Research Project of Colleges and Universities of Henan Province (Grant No. 22A140018).
References
- Huang, D. Y.; Qiu, Q. L.; Wang, Y. M. et al. Rapid Identification of Different Grades of Huangshan Maofeng Tea Using Ultraviolet Spectrum and Color Difference. Molecules 2020, 25 (20), 4665. DOI: 10.3390/molecules25204665
- Li, P. F.; Ning, Y. W.; Jing, J. F. Research on the Detection of Fabric Color Difference Based on T-S Fuzzy Neural Network. Color. Res. Appl. 2017, 42 (5), 609–618. DOI: 10.1002/col.22113
- Han, J.; Wang, W. Y.; Leng, X. P. et al. Efficient Identification of Ornamental Peach Cultivars Using RAPD Markers with a Manual Cultivar Identification Diagram Strategy. Genet. Mol. Res. 2014, 13 (1), 32–42. DOI: 10.4238/2014.January.8.2
- Ward, J.; Gilmore, S. R.; Robertson, J.; Peakall, R. A Grass Molecular Identification System for Forensic Botany: A Critical Evaluation of the Strengths and Limitations. J. Forensic. Sci. 2009, 54 (6), 1254–1260. DOI: 10.1111/j.1556-4029.2009.01196.x
- Apriyanti, D. H.; Spreeuwers, L. J.; Lucas, P. J. F.; Veldhuis, R. N. J. Automated Color Detection in Orchids Using Color Labels and Deep Learning. Plos One 2022, 16 (10), e0259036. DOI: 10.1371/journal.pone.0259036
- Zoric, M.; Cvejic, S.; Mladenovic, E. et al. Digital Image Analysis Using FloCIA Software for Ornamental Sunflower Ray Floret Color Evaluation. Front. Plant. Sci. 2020, 11, 584822. DOI: 10.3389/fpls.2020.584822
- Wei, P. L.; Jiang, T.; Peng, H. Y. et al., Coffee Flower Identification Using Binarization Algorithm Based on Convolutional Neural Network for Digital Images. Plant Phenomics 2020, 2020, 6323965. DOI: 10.34133/2020/6323965
- Cibuk, M.; Budak, U.; Guo, Y. H.; Ince, M. C.; Sengur, A. Efficient Deep Features Selections and Classification for Flower Species Recognition. Measurement 2019, 137, 7–13. DOI: 10.1016/j.measurement.2019.01.041
- Balieiro, O. C.; Pinheiro, M. S. D.; Silva, S. Y. S. et al. Analytical and Preparative Chromatographic Approaches for Extraction of Spilanthol from Acmella Oleracea Flowers. Microchem. J. 2020, 157, 105035. DOI: 10.1016/j.microc.2020.105035
- Gomez, M. R.; Soledad, C.; Olsina, R. A.; Silva, M. F.; Martinez, L. D. Metal Content Monitoring in Hypericum Perforatum Pharmaceutical Derivatives by Atomic Absorption and Emission Spectrometry. J. Pharmaceut. Biomed. 2004, 34 (3), 569–576. DOI: 10.1016/S0731-7085(03)00643-5
- Du, Q.; Cai, Y. G.; Chen, Z.; et al. Determination of Trace Elements in Corydalis Conspersa and Corydalis Linarioides by ICP-AES. J. Chem-ny 2020, 2020, 1–11. DOI: 10.1155/2020/6567015
- Winefordner, J. D.; Gornushkin, I. B.; Correll, T.; et al. Comparing Several Atomic Spectrometric Methods to the Super Stars: Special Emphasis on Laser Induced Breakdown Spectrometry, LIBS, a Future Super Star. J. Anal. Atom. Spectrom. 2004, 19 (9), 1061–1083. DOI: 10.1039/b400355c
- Lei, W.; Motto-Ros, V.; Boueri, M.; et al. Time-Resolved Characterization of Laser-Induced Plasma from Fresh Potatoes. Spectrochim. Acta B 2009, 64 (9), 891–898. DOI: 10.1016/j.sab.2009.07.015
- Multari, R. A.; Cremers, D. A.; Scott, T.; Kendrick, P. Detection of Pesticides and Dioxins in Tissue Fats and Rendering Oils Using Laser-Induced Breakdown Spectroscopy (LIBS). Food Chem. 2013, 61 (36), 8687–8694. DOI: 10.1021/jf304589s
- Gazeli, O.; Stefas, D.; Couris, S. Sulfur Detection in Soil by Laser Induced Breakdown Spectroscopy Assisted by Multivariate Analysis. Materials 2021, 14 (3), 541. DOI: 10.3390/ma14030541
- Zhang, G. Y.; Song, H.; Liu, Y.; et al. Optimization of Experimental Parameters About Laser Induced Breakdown and Measurement of Soil Elements. Optik 2018, 165, 87–93. DOI: 10.1016/j.ijleo.2018.03.125
- Choi, S.; Park, C. Convolution Neural Network with Laser-Induced Breakdown Spectroscopy as a Monitoring Tool for Laser Cleaning Process. Sensors 2023, 23 (1), 83. DOI: 10.3390/s23010083
- Wang, J. M.; Li, G.; Zheng, P. C.; et al. Highly Sensitive Detection of Heavy Metal Elements Using Laser-Induced Breakdown Spectroscopy Coupled with Chelating Resin Enrichment. Chemosensors 2023, 11 (4), 228. DOI: 10.3390/chemosensors11040228
- Takahashi, T.; Yosh ino, S.; Takaya, Y.; et al. Quantitative in Situ Mapping of Elements in Deep-Sea Hydrothermal Vents Using Laser-Induced Breakdown Spectroscopy and Multivariate Analysis. Deep-Sea. Res. Pt. I 2020, 158, 103232. DOI: 10.1016/j.dsr.2020.103232
- Sheng, P. P.; Jiang, L. L.; Sui, M. D.; Zhong, S. L. Micro-hole Array Sprayer-Assisted Laser-Induced Breakdown Spectroscopy Technology and its Application in the Field of Sea Water Analysis. Spectrochim. Acta B 2019, 154, 1–9. DOI: 10.1016/j.sab.2019.02.002
- Sezer, B.; Ozturk, M.; Ayvaz, H.; Apaydln, H.; Boyaci, I. H. Laser-Induced Breakdown Spectroscopy as a Reliable Analytical Method for Classifying Commercial Cheese Samples Based on their Cooking/Stretching Process. Food Chem. 2022, 390, 132946. DOI: 10.1016/j.foodchem.2022.132946
- Yang, F.; Li, L. N.; Xu, W. M.; et al, Laser-Induced Breakdown Spectroscopy Combined with a Convolutional Neural Network: A Promising Methodology for Geochemical Sample Identification in Tianwen-1 Mars Mission. Spectrochim. Acta B. 2022, 192, 106417. DOI: 10.1016/j.sab.2022.106417
- Park, J.; Kumar, S.; Han, S. H.; et al. Two-Step Partial Least Squares-Discriminant Analysis Modeling for Accurate Classification of Edible Sea Salt Products Using Laser-Induced Breakdown Spectroscopy. Appl. Spectrosc. 2022, 76 (9), 1042–1050. DOI: 10.1177/00037028221091581
- Yang, P.; Nie, Z. L.; Yao, M. Y. Diagnosis of HLB-Asymptomatic Citrus Fruits by Element Migration and Transformation Using Laser-Induced Breakdown Spectroscopy. Opt. Express. 2022, 30 (11), 18108–18118. DOI: 10.1364/OE.454646
- Harefa, E.; Zhou, W. D. Laser-Induced Breakdown Spectroscopy Combined with Nonlinear Manifold Learning for Improvement Aluminum Alloy Classification Accuracy. Sensors 2022, 22 (9), 3129. DOI: 10.3390/s22093129
- Alfarraj, B. A.; Sanghapi, H. K.; Bhatt, C. R.; Yueh F. Y.; Singh, J. P. Qualitative Analysis of Dairy and Powder Milk Using Laser-Induced Breakdown Spectroscopy (LIBS). Appl. Spectrosc. 2018, 72 (1), 89–101. DOI: 10.1177/0003702817733264
- Bhatt, C. R.; Alfarraj, B.; Ghany, C. T.; Yueh, F. Y.; Singh, J. P. Comparative Study of Elemental Nutrients in Organic and Conventional Vegetables Using Laser-Induced Breakdown Spectroscopy (LIBS). Appl. Spectrosc. 2017, 71 (4), 686–698. DOI: 10.1177/0003702817692810
Bo Dai, Fangyuan Liang, Xiaoqing Fu, Jingge Wang, and Hehe Li are with the School of Physics and Engineering at Henan University of Science and Technology, in Luoyang, People’s Republic of China. Direct correspondence to: wangjingge1987@126.com ●
Best of the Week: AI and IoT for Pollution Monitoring, High Speed Laser MS
April 25th 2025Top articles published this week include a preview of our upcoming content series for National Space Day, a news story about air quality monitoring, and an announcement from Metrohm about their new Midwest office.
Laser Ablation Molecular Isotopic Spectrometry: A New Dimension of LIBS
July 5th 2012Part of a new podcast series presented in collaboration with the Federation of Analytical Chemistry and Spectroscopy Societies (FACSS), in connection with SciX 2012 — the Great Scientific Exchange, the North American conference (39th Annual) of FACSS.
LIBS Illuminates the Hidden Health Risks of Indoor Welding and Soldering
April 23rd 2025A new dual-spectroscopy approach reveals real-time pollution threats in indoor workspaces. Chinese researchers have pioneered the use of laser-induced breakdown spectroscopy (LIBS) and aerosol mass spectrometry to uncover and monitor harmful heavy metal and dust emissions from soldering and welding in real-time. These complementary tools offer a fast, accurate means to evaluate air quality threats in industrial and indoor environments—where people spend most of their time.
Smarter Sensors, Cleaner Earth Using AI and IoT for Pollution Monitoring
April 22nd 2025A global research team has detailed how smart sensors, artificial intelligence (AI), machine learning, and Internet of Things (IoT) technologies are transforming the detection and management of environmental pollutants. Their comprehensive review highlights how spectroscopy and sensor networks are now key tools in real-time pollution tracking.
New AI Strategy for Mycotoxin Detection in Cereal Grains
April 21st 2025Researchers from Jiangsu University and Zhejiang University of Water Resources and Electric Power have developed a transfer learning approach that significantly enhances the accuracy and adaptability of NIR spectroscopy models for detecting mycotoxins in cereals.