Gold Nanoparticles for SERS in Fingermark Identification
Fingerprint pattern comparison is one of the most reliable methods of identification in forensic investigations. Fingermarks from a scene are enhanced, either physically or chemically, and compared to known fingerprints on a database.
Fingerprint pattern comparison is one of the most reliable methods of identification in forensic investigations. Fingermarks from a scene are enhanced, either physically or chemically, and compared to known fingerprints on a database. Recent studies have looked at the composition of fingermarks for three reasons. First, for enhancement to be most effective, it would be useful to have compositional information for a particular mark. Second, if the technique used to provide compositional information can determine if any contamination or exogenous substances are present, this could be useful intelligence (for example, contact with drugs). This is especially important if the mark, or pattern, is smudged or distorted, making comparison unfeasible. Third, some analytical techniques, as well as providing chemical information, can also provide an image, maximizing the information recovered with one analysis. In a forensic context, nondestructive analysis so that evidence is available for further examination by prosecution or defense is also important. The results presented here demonstrate how surface-enhanced Raman spectroscopy (SERS) can be used in a routine manner with Raman instruments to image fingermarks composed of endogenous secretions nondestructively.
Fingerprint examination is a well-established method of identification using the unique arrangement of ridges on the palms of the hands or soles of the feet. The pattern is transferred to a surface via a matrixcommonly composed of secretions from glands on the fingertips and from elsewhere in the body, as hands come into contact with other parts of the body and the hair. These endogenous compounds include water, lipids, fatty acids, amino acids, and vitamins (1), and leave a transparent or “latent” fingermark. Other exogenous–contaminant substances can contribute if the hand has also been in contact with them — for example, cosmetics and drugs — or if they have been metabolized and secreted, as with nicotine or medication. Latent fingermarks need to be enhanced either physically or chemically before the pattern can be usefully examined. Physical enhancers are commonly powders, such as carbon black, aluminum powder, and magnetic powder. Chemical enhancers include compounds such as ninhydrin, silver nitrate, and 1,8-diazafluoren-9-one (DFO). The choice of enhancement method is often based more upon the physical properties of the deposition surface rather than the chemical composition of the fingermark. An approach to fingermark development using analytical techniques potentially could be useful in three ways: knowing what is in a particular fingermark, therefore, improving the selection of the appropriate enhancement methods; gaining intelligence from knowledge of the exogenous–contaminant contribution to the mark; and providing imaging of the fingermark in addition to the acquisition of composition data. This has led several groups of researchers to use analytical techniques to probe the constituents of fingermarks, both endogenous and exogenous–contaminant (2–12).
Drugs and their metabolites are the most common type of analyte targeted in exogenous fingermark studies. Day and colleagues (2) used Raman spectroscopy to identify white powders in fingermarks from a range of dopants including drugs of abuse and over-the-counter drugs. Marks were created by touching the drug with a finger and then depositing a mark on a steel slide. The study was able to identify all of the dopants despite “interference” bands from endogenous fingermark components. Similarly, West and Went (3,4) were able to identify drugs of abuse and over-the-counter drugs with Raman spectroscopy but with the additional step of powdering and lifting onto adhesive tape before analysis. In this case, the powders blocked the endogenous component spectral contribution. From those studies, the great potential of Raman technology in this area was inferred but the technique used (confocal micro-Raman) and the scattering properties of the samples did not make this approach an easy and routine one. Surface-assisted laser desorption–ionization time-of-flight-mass spectrometry (SALDI–TOF-MS) also has been employed to identify drugs of abuse and their metabolites in fingermarks after they have been powdered with an enhancement providing powder (5). Additionally, marks were imaged so that the distribution of the analytes could be mapped. A different approach to detecting metabolites in fingermarks has been taken by Hazarika and colleagues (6), who used antibody–magnetic particle conjugates to bind to metabolites. The fingermark was then visualized using fluorescence microscopy. Here, the fingermark ridges were of sufficient quality to allow a fingerprint comparison.
Studies focusing on endogenous components are of particular interest, as a method analyzing fingermarks using drugs, for example, might only be useful if that drug is present in the fingermark, whereas methods targeting endogenous components should always be applicable. Furthermore, there has not yet been any research into what proportion of fingermarks contain exogenous–contaminant materials and, therefore, for what proportion of fingermarks exogenous–contaminant-detecting techniques would be effective.
Successful imaging of endogenous fingermark components has been carried out by several groups using different techniques (7–11). Attenuated total reflectance Fourier transform infrared (ATR-FT-IR) spectroscopy has been used to collect spectra from fingermark ridges that have been placed directly onto the ATR crystal (7). Absorption bands characteristic of constituents such as lipids, proteins, and amino acids were identified and, subsequently, images were produced of their distribution. Clearly, placing fingermarks directly onto a crystal poses problems for practical application; however, a further paper demonstrated that images could be produced from fingermarks after they had been lifted from the deposition surface with a gelatin lift (8). MS also has been applied to imaging of lipids and triacylglycerols (9,10). Ifa and colleagues (9) imaged both these constituent types by desorption electrospray ionization-mass spectrometry (DESI-MS). However, there are issues with low sensitivity for DESI analysis of fingermarks. Wolstenholme and colleagues (10) demonstrated that images of lipid distribution and changes over time could be achieved with matrix-assisted laser desorption ionization-mass spectrometry (MALDI-MS). Images showed clear ridge patterns suitable for identification. They further determined that, if the matrix is washed off the fingermark, material is still available for enhancement by more traditional methods.
The way in which fingermark constituents change over time is another area currently attracting attention. Archer and colleagues monitored the change in endogenous lipid composition of fingermarks over time using gas chromatography (GC)–MS (11). Five fingermark donors deposited prints at time intervals up to 33 days. The study found that the amounts of detected constituents varied between donors and within a single donor’s depositions and that over time, the amount of a particular component could increase or decrease. The variation in fingermark composition, even when from the same donor, is problematic for studies of this nature using any technique. The same group also looked at the oxidation products of squalene over time with a view to correlating the oxidation kinetics to age (12). It was acknowledged that there is more work to be done on the range of environmental factors that affect oxidation.
In forensic applications, there are often additional constraints on choice of examination or analytical method. One is that, ideally, methods should be nondestructive so that the evidence remains intact and further work can be done either to support the prosecution case or so that a defendant can employ an expert to re-examine the evidence on his behalf. Clearly, a number of the methods used by the aforementioned researchers do not fit into the nondestructive category, despite being able to provide important supporting information. A combined approach to fingermark research is necessary but this is not possible on casework samples. Therefore, there is a need for nondestructive methods to be developed that potentially can be employed at a scene of crime. Raman spectroscopy is a nondestructive technique and is portable, however, without using a method of signal enhancement, sensitivity to fingermark deposits, particularly those with endogenous components only, is a problem. Surface-enhanced Raman spectroscopy (SERS) can provide that enhancement and the use of commercially available gold nanoparticles helps to avoid the problems of reproducibility identified with other metals, such as silver. The results presented here use SERS to image fingermark ridges composed of endogenous compounds to provide clear patterns with identifiable features.
The aims of this study were fourfold: To determine the optimum particle size and concentration of gold nanoparticles; to determine whether the use of salt aggregates is beneficial; to determine whether deposition order affects the quality of the results; and to investigate a range of deposition surfaces.
Experimental
Materials and instrumentation: Gold colloids (50 nm, 100 nm, and 150 nm) were purchased from PerkinElmer (Shelton, Connecticut) and BritishBiocell International (Cardiff, UK). Klarite was obtained from D3 Technologies, Ltd (Glasgow, UK). Anhydrous sodium sulfate and acetone were purchased from Fisher Scientific (Loughborough, UK). ALUGRAM SIL G/UV254 precoated TLC aluminum plates were purchased from Sigma Aldrich (Poole, UK). MALDI inserts were obtained from Applied Biosystems (Foster City, California).
Raman spectra were acquired using a RamanStation 400 benchtop Raman spectrometer (PerkinElmer). The excitation source was a near-infrared 785-nm laser (100 mW at the sample), with a spot size of 100 µm. A spectral range of 220–3200 cm-1 was employed. The detector was a temperature controlled charged coupled device (CCD) detector (−50 °C) incorporating a 1024 × 256 pixel sensor. Spectra were acquired using Spectrum software and images were acquired using SpectrumIMAGE software, both supplied by PerkinElmer.
Methods
Fingerprint Deposition: Groomed latent fingermarks were prepared by rubbing the fingers on the chin, nose and forehead, five times, to yield a sebum-rich mark. Fingermarks were laid onto ALUGRAM SIL G/UV254 precoated TLC aluminum plates upon removal of the silica with acetone, stainless steel MALDI inserts and Klarite (preprepared gold SERS substrate).
Colloid Deposition: For spot deposition, 1 μL of each gold colloid (50 nm, 100 nm, and 150 nm) was pipetted onto the fingermarks. For layered deposition, 100-nm colloid was applied to fingermarks laid on aluminum plates and spotless MALDI inserts in successive layers, either by spotting or spraying with an aerosol spray bottle. Each spot or layer was allowed to dry before application of the next spot or layer.
Colloid Preconcentration: The 100-nm aqueous colloid was preconcentrated by centrifuging 10 mL at 2750 rpm for 30 min and then removing 9.5 mL of the supernatant, giving a 20-fold concentrated SERS suspension.
Salt Aggregates: 100-nm dilute gold colloid was mixed with a 0.1 M solution of sodium sulfate in a 1:1 ratio, to give a final concentration of 0.05 M sodium sulfate. The resulting solution was applied on top of groomed fingermarks.
Images: For images obtained on aluminum plates and MALDI inserts, 150-nm colloid was applied directly onto the surface before groomed fingermarks were laid on top. For images on Klarite, groomed fingermarks were laid directly onto the Klarite active area. Images were aquired at 0.05 mm resolution, with 2.00 s × 2 scans at each point.
Results and Discussion
Particle Size: Three concentrations of gold colloid were used for this study. The 150-nm colloid was specifically developed for SERS application, whereas the 50-nm and the 100-nm colloids were more dilute and intended for biological assay applications. Raman specification colloid is much more expensive than biological specification, therefore, work was carried out to investigate whether or not costs could be reduced by using a less expensive colloid. Figure 1 shows the results obtained for a fingerprint deposited on MALDI inserts. Figure 1a illustrates the difference between the Raman and dilute colloids, Figure 1b gives spectra for multiple layers of 100 nm colloid, and Figure 1c compares multiple layers of 100-nm colloid to preconcentration of 100-nm colloid. As would be expected, the 150-nm Raman specification colloid is the only one that provides the surface enhancement effect with a single layer (Figure 1a). Not only is the signal intensity higher but more peaks and, therefore, more chemical information, are present. On depositing multiple layers of 100-nm dilute colloid, there is a change in the features present (Figure 1b). The intensity is increased and peaks become more apparent. However, after spraying 25 successive layers, the improvement in quality was not sufficient to warrant the time involved. A similar effect and similar spectra were obtained for 100 nm colloid that had been preconcentrated by a factor of 20 (Figure 1c), therefore, preconcentration also was not viable.
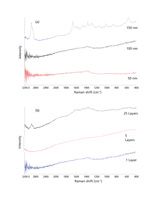
Figure 1 (a), (b): Effect of gold particle size and concentration on fingermark spectra: (a) 50-nm and 100-nm dilute colloids, and 150-nm Raman specification colloid, (b) single, five, and 25 layers of 100-nm colloid and (c) 20-fold preconcentrated 100-nm colloid compared to 20 successive layers of 100-nm colloid. Fingermarks were deposited on MALDI inserts and the colloid deposited on top.
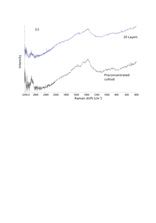
Figure 1 (c): Effect of gold particle size and concentration on fingermark spectra: (a) 50-nm and 100-nm dilute colloids, and 150-nm Raman specification colloid, (b) single, five, and 25 layers of 100-nm colloid and (c) 20-fold preconcentrated 100-nm colloid compared to 20 successive layers of 100-nm colloid. Fingermarks were deposited on MALDI inserts and the colloid deposited on top.
Salt Aggregates: Salt aggregates have been used with good results in other studies to improve the SERS enhancement effect (13). Electrolyte salts are recommended because they do not bind strongly to the colloidal metal surface. Here, sodium sulfate was used with the dilute 100-nm colloid to continue the investigation into limiting costs. Salt solutions at 0.1 M were mixed with the dilute 100-nm colloid in a 1:1 ratio. Figure 2 shows the spectra obtained for fingermarks with salt aggregates. As can be seen, the spectra of fingermarks with colloid and salt aggregates did result in an enhancement of some bands, however, by comparing these to spectra from the salt aggregate alone, the majority could be found in the salt aggregate spectra rather than being an improvement in the contribution from the fingermark. Additionally, peaks in the salt aggregate spectra overlap those in the fingermark spectra, thereby causing interference in peak assignment for fingermarks. Other salts were used and the same interference was observed (results not shown). Clearly, this interference is undesirable, particularly given the already complex nature of fingermark deposits. Therefore, the use of salt aggregation for signal enhancement was discounted, although other aggregating agents can be considered in the future.
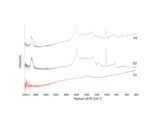
Figure 2: Spectra of (a) 100-nm dilute colloid, Na2SO4, and fingermark, (b) 100-nm dilute colloid and Na2SO4 only, and (c) 100-nm dilute colloid and fingermark only.
Order of deposition: Because multiple layers, preconcentration, and salt aggregates proved not to be beneficial for dilute colloids, attention was directed, for the remainder of the study, to the Raman specification 150-nm colloid. As previously discussed, any forensic method is ideally nondestructive. It is important, therefore, that a SERS enhancement is not gained at the expense of other techniques. Deposition of colloid is usually considered nondestructive, however, potentially, it could interfere with subsequent enhancement. Spectra were taken of fingermarks where colloid had been deposited both before and after fingermarks (Figure 3). The spectra are shown on the same intensity scale and clearly show that higher intensity is achieved if colloid is deposited before the fingermark. Fingermarks where colloid had been deposited before or after were then enhanced with black powder and lifted. Both resulted in pattern detail suitable for comparison, however, where colloid had been deposited before the fingermark, ridges overlapping with the colloid were clearer. Subsequent analysis was carried out with colloid deposited before fingermarks.
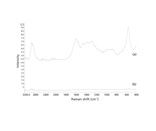
Figure 3: Effect of deposition sequence on fingermark spectra using 150-nm Raman specification gold colloid: (a) colloid deposited before fingermark and (b) fingermark deposited before colloid.
Desposition Surface
Images were acquired of fingermarks on three deposition surfaces, MALDI inserts, aluminum plates and Klarite preprepared SERS active substrate (Figure 4). For the MALDI insert and aluminum plate, the colloid was deposited by pipette, resulting in a spot approximately 1.5 mm in diameter, which limits the size of image that can presently be obtained. For the Klarite substrate, the active area was 4 mm × 4 mm allowing a larger, but still not full size, image. Image size will be addressed in future studies. As can be seen from Figure 4, each deposition surface contributes to the spectra. However, there are also differences between the deposition surface spectra and the fingermark spectra. Previous work on fingermarks and compounds present in fingermarks have assigned functional groups to peaks in the range examined here (2,14). Day and coworkers (2) assigned peaks in “fingerprint oil” to C-H stretching and deformation modes (2899, 2851, 2728, 1439, and 1304 cm-1) and to a C=C stretching mode (1661 cm-1). In the current study, at around 1440 cm-1 an unresolved shoulder peak can be seen in the spectra of fingermarks on MALDI inserts and resolved peaks can be seen in the spectra from the fingermarks on aluminum plate and Klarite. Day and colleagues’ work was carried out with a 633-nm HeNe laser without SERS enhancement, as opposed to the 785-nm laser used here, which accounts for slight shifts in peak wavenumber. A peak at 1000 cm-1 has been assigned by Virkler and Lednev (14) to the symmetric C-N stretch due to the presence of urea in sweat. For consistency, all images shown in Figure 4 were obtained by integrating scattering in the range 1010–990 cm-1. In all images, the distribution of C-N, from urea and other C-N-containing constituents, allows the fingermark ridge pattern to be seen. Further work is required to remove deposition surface interference and assign peaks belonging to endogenous fingermark components.
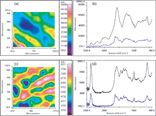
Figure 4 (a), (b), (c), (d): Fingermark images and corresponding spectra: (a) image on MALDI insert with 150-nm colloid; (b) spectra from positions 1 (black) and 2 (blue) on image (a); (c) image on aluminum plate with 150-nm colloid, (d) spectra from positions 1 (black) and 2 (blue) on image (c); (e) image on Klarite SERS substrate; and (f) spectra from positions 1 (black) and 2 (blue) on image (e). Images were obtained by integrating between 1010 and 990 cm-1.

Figure 4 (e), (f): Fingermark images and corresponding spectra: (a) image on MALDI insert with 150-nm colloid; (b) spectra from positions 1 (black) and 2 (blue) on image (a); (c) image on aluminum plate with 150-nm colloid, (d) spectra from positions 1 (black) and 2 (blue) on image (c); (e) image on Klarite SERS substrate; and (f) spectra from positions 1 (black) and 2 (blue) on image (e). Images were obtained by integrating between 1010 and 990 cm-1.
Conclusions
The technique presented here potentially provides a nondestructive method for fingermark analysis. Ridges have been imaged successfully on three surfaces, MALDI inserts, aluminum plate, and Klarite. Raman spectroscopy is already a portable technique, therefore, there is potential for combining it with a SERS substrate to provide immediate analysis at the scene. Ongoing work by the authors is focused on developing a cost-effective method for retrieving full-sized fingermarks onto a SERS-active substrate as well as investigating the detection of exogenous–contaminant components with this method.
Acknowledgments
The authors would like to thank PerkinElmer Ltd for the instrument loan grant enabling the work to be carried out.
Leesa Ferguson, Simona Francese, and Rosalind Wolstenholme are with Sheffield Hallam University, Sheffield, UK. Enrique Lozano Diz is with PerkinElmer Ltd., Beaconsfield, UK.
References
(1) R.S. Ramatowski, “Composition of Latent Print Residue” in Advances in Fingerprint Technology, H.C. Lee and R.E. Gaensslen, Eds. (CRC Press, Boca Raton, Florida, 2001), pp. 63–104.
(2) J.S. Day, H.G.M. Edwards, S.A. Dobrowski, and A.M. Voice, Spectrochim. Acta A 60, 563–568 (2004).
(3) M.J. West and M.J. Went, Spectrochim. Acta A 71, 1984–1988 (2009).
(4) M.J. West and M.J. Went, Forensic Sci. Int. 174, 1–5 (2008).
(5) F. Rowell, K. Hudson, and J. Seviour , Analyst 134, 701–707 (2009).
(6) P. Hazarika, S.M. Jickells, K. Wolff, and D.A. Russell, Analyst 134, 93–96 (2009).
(7) C. Ricci, P. Phiriyavityopas, N. Curum, K.L.A. Chan, S. Jickells, and S.G. Kazarian, Appl. Spectrosc. 61, 514–522 (2007).
(8) C. Ricci, S. Bleay, and S.G. Kazarian, Anal. Chem. 79, 5771–5776 (2007).
(9) D.R. Ifa, N.E. Manicke, A.L. Dill, and and R.G. Cooks, Science 321, 805 (2008).
(10) R. Wolstenholme, R. Bradshaw, M.R. Clench, and S. Francese, Rapid Commun. Mass Spectrom. 23, 3031–3039 (2009).
(11) N.E. Archer, Y. Charles, J.A. Elliott, and S. Jickells, Forensic Sci. Int. 154, 224–239 (2005).
(12) K.A. Mountfort, H. Bronstein, N. Archer, and S.M. Jickells, Anal. Chem. 79, 2650–2657 (2007).
(13) S.E.J. Bell and N.M.S. Sirimuthu, J. Am. Chem. Soc. 128, 15580–15581 (2006).
(14) K. Virkler and I.K. Lednev, Forensic Sci. Int. 181, e1–e5 (2008)
Breaking Spectral Boundaries: New Ultrafast Spectrometer Expands Detection Range for NIR Studies
October 29th 2024A team from Auburn University has developed an innovative ultrabroadband near-infrared (NIR) transient absorption (TA) spectrometer capable of detecting across a wide spectral range of 900–2350 nm in a single experiment. This advancement improves the study of ultrafast processes in low-bandgap materials and opens doors to new insights in photochemistry and charge dynamics.