Hair Analysis Using an FTIR Imaging System
Jasco, Inc.
The combination of an FTIR spectrometer with an optical microscope offers a valuable resource to investigate a variety of complex samples. There are a wide range of applications that have taken advantage of the attractive qualities of FTIR imaging systems including product development, biomedical research, forensics, polymers, and proteins.


Numerous methods for collecting the imaging data exist, many of them requiring expensive step-scan instruments in combination with a focal plane array (FPA) detector that involves sophisticated electronics for reading the multiple detector elements. An FTIR imaging system that is coupled with a linear array detector does not require a step-scan instrument but provides a fast and efficient analytical method to study various systems while collecting complete infrared spectra. FTIR imaging is used to describe the collection of a chemical profile of the sample area by expressing the intensity of a single absorption peak, or ratio of two absorption peaks, using an image "map".


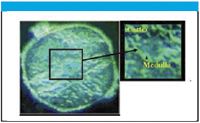
Figure 1. Hair sample image with FTIR microscope.
Hair analysis can provide vital information concerning important chemicals that may be in the body. The presence of various toxins and nutrient deficiencies or abundances can be determined using this process. Infrared microscopy is one tool that can be used to examine the interior of the hair and differentiate passive contamination from drugs absorbed into the hair from ingestion. By slicing the hair specimen as either a cross section or laterally, infrared spectra can be obtained of the cortex and medulla of a single hair with a spatial resolution as high as 6.25 μm.


Figure 2. Infrared spectra of the medulla (green) and cortex (red).
Experimental
A piece of hair was sliced using the HW-1 Multi-Angle SliceMaster and the sample was embedded into a KBr crystal for measurement. A 100 × 100 μm area was imaged with a JASCO FT/IR-6100 integrated with the IMV-4000 imaging microscope. An instrument resolution of 16 cm-1 was used to collect 32 scans for the single-beam background and sample spectra. Complete infrared spectra with a spectral range from 4000–750 cm-1 were collected.


Figure 3. Infrared image of percent alpha helix (left) and beta sheet (right) distribution.
Conclusions
Initial investigation of the hair sample found that there is a greater amount of lipid content in the medulla while primarily protein exists in the cortex of the hair sample. When the spectral data is input into the Secondary Structure Estimation software, it is found that a higher amount of alpha helix is present in the cortex while there is more beta sheet found in the medulla portion.
Infrared imaging was able to identify the different components of a hair specimen and also provide information concerning distribution of the secondary structures of the proteins present in the hair sample.
Jasco, Inc.
8649 Commerce Drive, Easton, MD 21601
Tel. (800) 333-5272


Thermo Fisher Scientists Highlight the Latest Advances in Process Monitoring with Raman Spectroscopy
April 1st 2025In this exclusive Spectroscopy interview, John Richmond and Tom Dearing of Thermo Fisher Scientific discuss the company’s Raman technology and the latest trends for process monitoring across various applications.
A Seamless Trace Elemental Analysis Prescription for Quality Pharmaceuticals
March 31st 2025Quality assurance and quality control (QA/QC) are essential in pharmaceutical manufacturing to ensure compliance with standards like United States Pharmacopoeia <232> and ICH Q3D, as well as FDA regulations. Reliable and user-friendly testing solutions help QA/QC labs deliver precise trace elemental analyses while meeting throughput demands and data security requirements.

