Handheld Raman, Mid-Infrared and Near Infrared Spectrometers: State-of-the-Art Instrumentation and Useful Applications
Special Issues
Handheld Raman, mid-infrared and near infrared spectrometers have launched vibrational spectroscopy into a new era of in-the-field and on-site analysis, as the application examples discussed here demonstrate. We assess the technological developments that have led to this progress.
Recently, miniaturization of Raman, mid-infrared (MIR) and near infrared (NIR) spectrometers has made substantial progress, and marketing companies predict this segment of instrumentation will have a significant growth rate within the next few years. This increase will be based on a wider adoption of spectrometers for quality control by in-the-field testing and on-site measurements. Furthermore, based on high-volume manufacturability and significant reduction of costs, numerous companies target with (primarily NIR) instruments a non-expert user community for consumer applications. Especially from this last-mentioned development, a tremendous potential for everyday life can be expected ranging from food testing to detection of fraud and adulteration in a broad area of materials. Miniaturization, however, must not lead to compromises in measurement performance and the handheld instrumentation will only have a practical impact if Raman, MIR, and NIR spectra of comparable quality to laboratory spectrometers can be obtained. The present communication will shortly cover the building principles of state-of-the-art instruments, and will then discuss selected applications in order to demonstrate the advancement in this field of research.
Miniaturization of vibrational spectrometers has started more than two decades ago, but only within the last decade real handheld Raman, MIR and NIR scanning spectrometers have become commercially available, and utilized for a broad range of analytical applications (1-6). While the weight of the majority of Raman and MIR spectrometers is still in the ~1 kg range, the miniaturization of NIR spectrometers has advanced down to the ~100 g level, and developments are under way to integrate them into mobile phones (7). Furthermore, Raman and MIR handheld spectrometers are still in the price range of several tens of thousands of US$, whereas miniaturized NIR systems have recently reached the < $1,000 USD level. In view of the high price level of Raman and MIR instruments in the near future, only the acquisition of NIR systems can be taken into consideration for private use, whereas handheld Raman and MIR spectrometers will be restricted to industrial, military, and homeland security applications, as well as public use by first responders, customs, or environmental institutions.
In what follows, instrumental features of novel handheld Raman, MIR and NIR spectrometers will be discussed, and selected qualitative and quantitative case studies will be presented. Material quality control applications have been selected for Raman and MIR. Notwithstanding the indisputable value of handheld NIR for the same purpose, only everyday life examples for the private sector will be discussed here; this is to enhance the interest of a new non-expert user community.
Instrumentation
Presently, only two handheld Fourier transform infrared (FT-IR) spectrometers (based on Michelson interferometers), and that can be operated in the attenuated total reflection (ATR), external reflection, or diffuse reflection modes are available on the market. In contrast, a broad range of miniaturized Raman systems, with different excitation sources and specific operational features, is offered. Most of the handheld Raman spectrometers are operated with a 785 nm excitation source, with the inherent problem of disturbing fluorescence and a high-wavenumber cut-off at about 2200 cm-1. The problem of fluorescence can be either tackled by 1064 nm excitation or by sequentially shifted excitation spectroscopy (8). Bruker also managed to extend the wavenumber range to 3200 cm-1 by dual-wavelength excitation (9). A very powerful countermeasure to compensate the error source of a sharp focus in connection with a heterogeneous sample is the so-called orbital raster scan (ORS) (10) that is integrated in the Metrohm handheld Raman system. In 2015, Thermo Fisher Scientific merged their miniaturized FT-IR and Raman instruments into a new handheld FT-IR–Raman spectrometer, thereby launching vibrational spectroscopy into a new era of flexibility.
Contrary to Raman and MIR spectroscopy, miniaturization has been much further driven for NIR spectrometers. The recent progress in miniaturization has taken advantage of new micro-technologies such as micro-electro-mechanical systems (MEMS), micro-opto-electro-mechanical systems (MOEMS), micro-mirror arrays, and linear variable filters (LVFs). These have led to a drastic reduction of spectrometer size (the weight of the spectrometers discussed in this communication varies between 100-200 g), while allowing good performance due to the high-precision implementation of important elements in the final device (11). High-volume manufacturability will further reduce costs, and thereby contribute towards a broader dissemination of such instruments for everyday-life applications. In what follows, the specific instrumental features of the four handheld NIR spectrometers used in our laboratory will be outlined.
Based on the type of detector, handheld NIR spectrometers can be classified in the two categories of array-detector and single-detector instruments (11). One of the first commercial handheld NIR spectrometers (VIAVI MicroNIR 1700 [formerly JDSU], Santa Rosa, CA) has an array detector covering the wavelength range from 908-1676 nm, and uses a monochromator based on an LVF. It has so far been used for a multiplicity of applications, ranging from authentication of seafood and determination of food nutrients, the analysis of hydrocarbon contaminants in soil, and authentication and quantitative determination of pharmaceutical drugs (12-15). However, compared to an array detector, the price for a single detector is much lower, and, to further reduce the hardware costs, new developments focus on systems with single detectors. For example, the DLP NIRscan Nano EVM (Dallas, TX, USA), is based on Texas Instruments´s digital micro-mirror device (DMD), in combination with a grating and a single-element detector, covering the wavelength range from 900-1701 nm. Very recently, a MEMS-based FT-NIR instrument, that contains a single-chip Michelson interferometer with a monolithic opto-electro-mechanical structure, has been introduced by Si-Ware Systems (Cairo, Egypt). Contrary to most of the other handheld spectrometers, this instrument can scan FT-NIR spectra over the extended range from 1298 nm to 2606 nm. Finally, Spectral Engines (Helsinki, Finland) has developed miniaturized NIR spectrometers that are based on a tunable Fabry-Perot interferometer. In order to cover the NIR wavelength region 1350-2450 nm, however, four spectrometers are required.
The schematic principles of the different monochromator designs of the described NIR spectrometers are summarized in Figure 1.
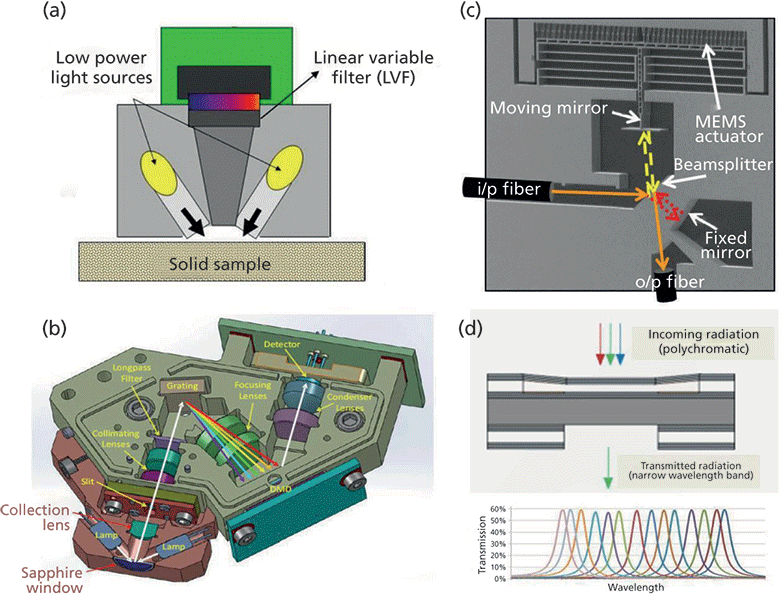
Figure 1: The optical schemes of handheld NIR spectrometers, based on different monochromator principles: (a) VIAVI MicroNIR 1700, linear variable filter; (b) DLP NIRscan Nano EVM with Texas Instruments digital micromirror device (DMD); (c) Si-Ware Systems, MEMS-based FT-NIR spectrometer; (d) Spectral Engines NIR spectrometer with tunable Fabry-Perot interferometer).
Applications
To demonstrate the potential of handheld vibrational spectrometers, only a few, selected application examples will be presented here. Note that Raman spectroscopy has also proved valuable for the characterization of inorganic materials. The rapid noninvasive determination of the different crystalline forms of TiO2 (rutile and anatase), or the discrimination of a genuine diamond from an imitation, are just typical examples.
In a feasibility study, the change of the ionic structure of sulfuric acid as a function of concentration has been demonstrated by Raman spectra recorded with a handheld instrument (Rigaku Raman Technologies). The spectra measured consisting of 96% (concentrated), 80%, and 20% sulfuric acid are shown in Figure 2. The differences in ionization are an important issue regarding non toxicity of diluted sulfuric acid for cleaning operations of aluminum surfaces.
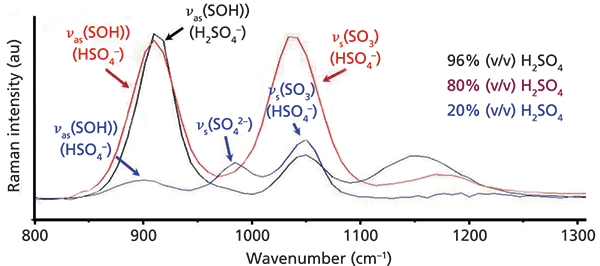
Figure 2: Raman spectra of sulfuric acid at different concentration levels, measured with a handheld instrument.
The application of handheld FT-IR spectroscopy in the ATR mode is recommended primarily for organic materials (preferentially liquids) that provide good contact with the diamond (or ZnSe) reflection element. Despite its rather difficult sample handling, an interesting practical application is the quality control of bitumen. For road construction work, bitumen is modified with different polymers in order to adjust its rheological and adhesion properties (polymer modified bitumen, PmB). The rapid quantitative analysis of this admixture is an important quality control issue, and the question that arises is whether handheld FT-IR–ATR spectroscopy is applicable for this purpose, and could, at the end of the day, be used for "on the road" analysis. In an extensive feasibility study, FT-IR–ATR spectra of bitumen samples, modified by different admixtures of polypropylene maleic anhydride (PPMA), were measured with the handheld Thermo Fisher Scientific FT-IR spectrometer (accumulating 60 scans at 4 cm-1 spectral resolution). Based on these spectra with specific wavenumber selection (3250-2500 cm-1, 1490-1130 cm-1, 930-680 cm-1), and standard normal variate (SNV) transformation (Figure 3a), a cross-validated partial least squares (PLS) calibration model was developed (Figure 3b). Test samples that were not contained in the calibration model were successfully predicted regarding their PPMA content.
Due to the advanced level of miniaturization, by far the most flexible technique for on site and in-the-field measurements is NIR spectroscopy. Although this technique can also be applied for a broad range of industrial material quality control applications (15-18), the present communication is targeted at practical everyday life applications in order to attract the attention of a prospective non-expert user community. In these days, fraud and adulteration are so widely spread that the progress in miniaturization and the increasing affordability of handheld NIR spectrometers makes them an attractive tool to efficiently fight the aforementioned evils. The following application examples shall demonstrate the potential of handheld NIR spectroscopy, not only for this purpose, but also for exemplary everyday life applications.
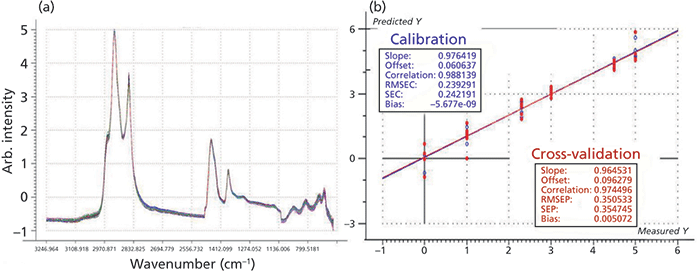
Figure 3: Calibration spectra of (a) polymer-modified (PPMA) bitumen samples, and (b) cross-validated PLS calibration of the polymer admixture developed thereof.
In China, the stem of the Dendrobium orchid is processed into a fengdou that is considered not only a convenient dosage form of a valuable health-care food, but also of a Chinese traditional medicine (TCM) with efficacy in liver protection, treatment of pharyngitis, and many other diseases (19-20). Because fengdous processed from Dendrobium officinale Kimura et Migo (DOK) not only have high medicinal value, but are also in short supply, and, consequently, are very expensive. Therefore, it would be desirable to discriminate them from fengdous based on Dendrobium devonianum Paxt (DDP) with lower efficacy and correspondingly much lower (1/4-1/5) price. However, this is not possible by visual inspection only (Figure 4a) Thus, this case is an example of high public interest. The handheld DLP NIRscan Nano EVM spectrometer, in combination with a PLSDA (partial least squares discriminant analysis) evaluation method, was used to rapidly identify fengdous processed either from DOK or DDP. For this purpose, a total of 468 fengdou samples based on DOK (288) and DDP (180), were collected from Luosiwan (Yunnan, China), and the calibration and prediction set were randomly distributed at a ratio of 2:1. NIR spectra were collected for each sample with the DLP NIRScan Nano EVM spectrometer by accumulating 32 scans in approximately seven seconds. After pretreatment by first derivative, SNV, and mean centering, the identification model was developed by PLSDA, and the competitive adaptive reweighted sampling (CARS) wavelength optimization algorithm was used to filter out the wavelengths with high information content to improve the prediction accuracy of the model (Figure 4). The results showed that, for the calibration, cross validation and prediction sets, the accuracy is 93.9%, 89.6%, and 84.1%, respectively. This approach clearly demonstrates that the DLP NIRScanNano EVM spectrometer, combined with CARS-PLSDA evaluation, can be successfully used for the rapid discrimination of fengdous produced from DOK and DDP (Figure 4).
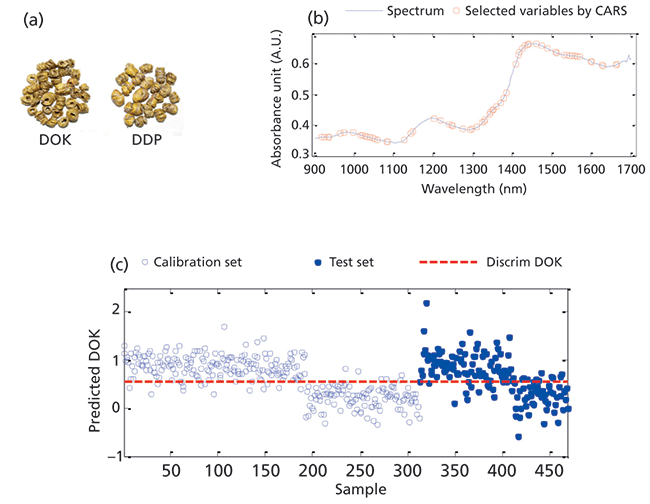
Figure 4: Identification of the species of dendrobium with a handheld NIR spectrometer: (a) samples of DOK and DDP, (b) the variables selected by CARS, and (c) prediction of DOK by calibration model.
The list of adulterations and their successful detection by the use of handheld NIR spectroscopy is not limited to pharmaceutical formulations (21). More exotic cases such as the offer for sale of silk carpets (imitated by carpets knotted from mercerized cotton) (22), amber gem stones (counterfeited by colored poly(methylmethacrylate)(PMMA) with an artificially embedded insect), or ivory carvings (made from regular bone) frequently occur in tourist centers all over the world.
As a typical household example, the use of handheld NIR spectroscopy is demonstrated with reference to the identification of an unknown contamination in a cotton textile. In Figure 5 (top), the diffuse-reflection NIR spectra (measured with a Si-Ware Systems FT-NIR spectrometer) from both a clean and a blood-contaminated cotton textile are shown. Absorbance subtraction of these spectra (Figure 5, bottom) can readily highlight the protein specific N-H overtone and amide I and amide II combination bands in the 6600 cm-1 and 4500-5000 cm-1 wavenumber regions (gray shaded areas), respectively. This information will then allow selection of the specific parameters of the washing machine for the perfect removal of this stain.
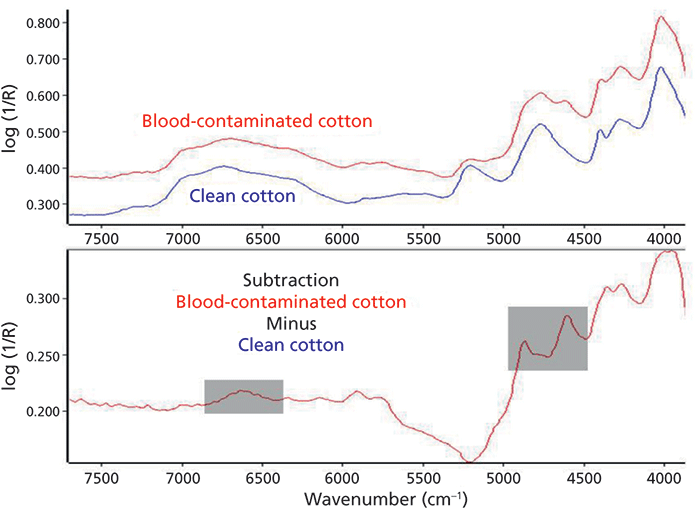
Figure 5: Identification of a textile contamination by handheld NIR spectroscopy: Isolation of blood-specific absorption bands (gray shaded areas) by absorbance subtraction of the FT-NIR spectra of a blood-contaminated and a clean cotton textile.
Finally, an application example from food testing is shortly outlined. Over the last few years, the health awareness of people has grown strongly, and the control of nutritional parameters of everyday diet is just one aspect of this issue. At this point, however, a word of caution is necessary. Contrary to the approach of direct-to-consumer companies that video-advertise their "food scanners" with "cloud evaluation of big data" and (in our opinion) exaggerated claims, predictions of nutritional parameters with an acceptable accuracy can only be achieved when calibrations based on reliable spectral data are developed.
As a starting project in this field, the analysis of the nutritional parameters of pasta sauce mixtures has been chosen. For this purpose, more than 700 plates containing five different combinations of a certain pasta sauce blend (ranging from 0% to 100% sauce addition) were investigated. Each pasta sauce mixture was prepared "ready to eat" on a plate, and NIR spectra were recorded in five different positions (to compensate for inevitable heterogeneities) with a handheld NIR spectrometer (Viavi MicroNIR 1700). Prior to the development of the calibration models, the five spectra were averaged and pretreated by extended multiplicative scatter correction (EMSC) (Figure 6a), and, based on the known nutritional parameters of the utilized pastas and sauce ingredients, calibration models were developed for fat, energy, protein, carbohydrates, sugar, and fiber (Figure 6b–d).
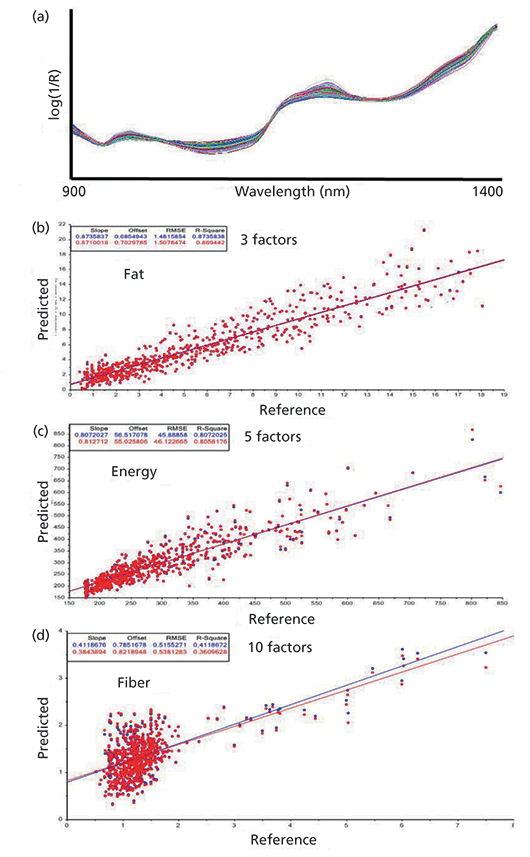
Figure 6: NIR spectra (after EMSC pretreatment) measured with a handheld spectrometer of 700+ plates with pasta and sauce mixtures for calibration development of nutritional parameters: (a) averaged spectra of five replicate measurements, (b) actual vs. predicted plot for fat, (c) actual vs. predicted plot for energy, and (d), actual vs. predicted plot for fiber. The corresponding calibration results for protein, carbohydrates, and sugar are not shown here.
Contrary to what some of the above mentioned direct-to-consumer companies claim, acceptable calibrations could, at best, be achieved for fat (Figure 6b), energy (Figure 6c), protein, and, with limitations, carbohydrates. Due to the similar structural characteristics of carbohydrates, sugar, and fiber (Figure 6d), no reliable calibrations were obtained for the last two parameters.
Conclusions
Generally, handheld instruments have launched vibrational spectroscopy into a new era of in-the-field and on-site analysis. State-of-the-art handheld Raman, MIR and NIR spectrometers demonstrate good performance for a multiplicity of case studies. However, miniaturization of NIR spectrometers has reached a much higher level compared to Raman and MIR spectrometers. Furthermore, high volume manufacturability has considerably reduced costs for handheld NIR spectrometers, and will, hopefully, contribute towards a broader dissemination of such instruments for everyday life applications by a non-expert user community.
Acknowledgments
The authors gratefully acknowledge instrumental support by Si-Ware Systems (Egypt), VIAVI (USA), and Spectral Engines (Finland). Furthermore, experimental and organizational help by Frank Pfeifer (University of Duisburg-Essen, Germany) and Farzad Ehsani (Vitruvi LLC, USA) are acknowledged.
References
(1) D. Sorak, L. Herberholz, S. Iwascek, S. Altinpinar, F. Pfeifer, and H.W. Siesler, Appl. Spectrosc. Rev. 47, 83-115 (2012).
(2) R.A. Crocombe and M.A. Druy, Appl. Spectrosc. 70, 730-733 (2016).
(3) A. Guillemain, K. Degardin, and Y. Roggo, Talanta 165, 632-640 (2017).
(4) J.M. Soriano-Disla, L.J. Janik, and M.J. McLaughlin, Talanta 178, 400-409 (2018).
(5) S.R. Karunathilaka, B.J. Yakes, K. He, L. Bruckner, and M.M. Mossoba, Food Control 92, 137-146 (2018).
(6) P. Vargas Jentzsch, F. Gualpa, L. A. Ramos, and V. Ciobota, Flavour Frag. J. 33, 184-190 (2018).
(7) T. Pügner, J. Knobbe, and H. Grüger, Appl. Spectrosc. 70, 734-745 (2016).
(8) R.W. Jones, K.L. Wise, S. Marshall, and J.B. Cooper, Spectroscopy, 29, 38-42 (2014).
(9) J.B. Cooper, S. Marshall, R. Jones, M. Abdelkader, and K.L. Wise, Applied Optics,53, 3333-3340 (2014).
(10) https://www.news-medical.net/whitepaper/20151214/Orbital-Raster-Scan-Technique-Helps-Improve-Performance-of-Mobile-Raman-Systems-for-Pharmaceutical-Analysis.aspx 08312018_19 pm.
(11) R.F. Wolffenbuttel, J. Micromech. Microeng. 15, S145-S152 (2005).
(12) C. Jantra, D.C. Slaughter, P.S. Liang, and S. Pathaveerat, Postharvest Biol. Tec. 133, 98-103 (2017).
(13) N. O'Brien, C. Hulse, F. Pfeifer, and H.W. Siesler, J. Near Infrared Spectrosc. 21, 299-305 (2013).
(14) S. Altinpinar, D. Sorak, and H.W. Siesler. J. Near Infrared Spectrosc. 21, 511-521 (2013).
(15) H. Yan and H.W. Siesler, J. Pharm. Biomed. Anal. 160, 179-186 (2018).
(16) S. Grassi, E. Casiraghi, and C. Alamprese, Food Chem. 243, 382-388 (2018).
(17) S. Piao, T. Okura, and M. Irie, Meat Sci. 137, 258-264 (2018).
(18) D.C. Silva, T.C.M. Pastore, L.F. Soares, F.A.S. de Barros, M.C.J. Bergo, V.T.H. Coradin, A.B. Gontijo, M.H. Sosa, C.B. Chacon, and J.W.B. Braga, Holzforschung. 72, 521-530 (2018).
(19) X. Chen and S. Guo. Nat. Prod. Res & Dev. 11, 70-75 (2001).
(20) Pharmacopoeia of the People's Republic of China, Zhonghua Renmin Gongheguo wei sheng bu yao dian wei yuan hui (Chemical Industry Press, Beijing, 2000), pp. 85-87.
(21) M. Alcalà, M. Blanco, D. Moyano, N. Broad, N. O'Brien, D. Friedrich, F. Pfeifer, and H.W. Siesler, J. Near Infrared Spectrosc. 21, 445–457 (2013).
(22) H. Yan, and H.W. Siesler, J. Near Infrared Spectrosc. 26, 311-321(2018).
Hui Yan is with the School of Biotechnology at the Jiangsu University of Science and Technology in Zhenjiang, China. Heinz W. Siesler is with the Department of Chemistry at the University of Duisburg-Essen in Essen, Germany. Direct correspondence to: yanh1006@163.com
LIBS Illuminates the Hidden Health Risks of Indoor Welding and Soldering
April 23rd 2025A new dual-spectroscopy approach reveals real-time pollution threats in indoor workspaces. Chinese researchers have pioneered the use of laser-induced breakdown spectroscopy (LIBS) and aerosol mass spectrometry to uncover and monitor harmful heavy metal and dust emissions from soldering and welding in real-time. These complementary tools offer a fast, accurate means to evaluate air quality threats in industrial and indoor environments—where people spend most of their time.
NIR Spectroscopy Explored as Sustainable Approach to Detecting Bovine Mastitis
April 23rd 2025A new study published in Applied Food Research demonstrates that near-infrared spectroscopy (NIRS) can effectively detect subclinical bovine mastitis in milk, offering a fast, non-invasive method to guide targeted antibiotic treatment and support sustainable dairy practices.
Smarter Sensors, Cleaner Earth Using AI and IoT for Pollution Monitoring
April 22nd 2025A global research team has detailed how smart sensors, artificial intelligence (AI), machine learning, and Internet of Things (IoT) technologies are transforming the detection and management of environmental pollutants. Their comprehensive review highlights how spectroscopy and sensor networks are now key tools in real-time pollution tracking.