A High-Volume, High-Throughput LC–MS Therapeutic Drug Monitoring System
Spectroscopy
Therapeutic drug monitoring is performed routinely by liquid chromatography–mass spectrometry (LC–MS) using instrumentation and methods originally developed and systematically configured for the high-volume, high-throughput analysis of drugs of abuse. An example of LC–MS monitoring of the drug clozapine and its metabolite, desmethylclozapine, is detailed along with a description of the overall system architecture, workflow, and maintenance routines that support a large-scale clinical therapeutic drug monitoring program. The relative advantages of LC–MS over immunoassay and LC–UV, the current standard techniques for therapeutic drug monitoring, are discussed in the light of these results.
Liquid chromatography-mass spectrometry (LC–MS) has been an important analytical tool in support of drug discovery and drug development for some time. LC–MS provides a combination of detection selectivity and sensitivity, speed of analysis, and robust performance that is well suited to the rapid structural characterization of candidate therapeutic substances and high-throughput screening assessment of pharmacological activity (1–3). More recently, LC–MS has been used for patient monitoring in clinical drug trials (4–6) and for the detection of drugs of abuse (7). As knowledge has grown about the relationship between genetic and environmental factors and individual responses to drugs, clinicians have sought new ways to monitor drug responses accurately to assess and tailor drug therapies more effectively. With its advantageous performance characteristics, LC–MS has proven to be a useful tool for collecting data characterizing these relationships. This, in turn, is generating broader interest in the application of LC–MS for the therapeutic monitoring of drugs and their metabolic products (8).
Traditionally, therapeutic drug monitoring has been performed by immunoassay and LC–UV. Immunoassay is simple, rapid, and relatively inexpensive to perform. However, compared with LC–MS, it is limited in detection specificity, sensitivity, and accuracy. Moreover, only a handful of new assays have been introduced in the past decade despite the fact that many times that number of new drugs have been launched during the same period. Given the advantages and growing penetration of LC–MS, it is an open question whether any new immunoassays will be developed for future therapeutic drug monitoring applications. LC–UV determinations lack sufficient selectivity and sensitivity, making detection and quantitation problematic for the newer, more potent low-dose pharmaceuticals. In addition, the relatively broad UV absorption bands make analytical separation challenging, requiring long runtimes that compromise analytical throughput.
Clozapine (Figure 1) is one of 20 drugs used in the Department of Clinical Pharmacology (DCP), St. Olav's Hospital, Trondheim, Norway, for the treatment of schizophrenia and psychoses. It is one of more than 200 different drugs DCP routinely monitors almost exclusively by LC–MS. Every month, approximately 200 samples are analyzed from patients treated with clozapine. Clozapine is metabolized mainly to clozapine N-oxide and desmethylclozapine. The half-life of clozapine in blood usually ranges from 6 to 36 h. Some data indicate that individuals with a high level of desmethylclozapine are more susceptible to developing agranulocytosis, a potentially lethal adverse event. This is one reason why the ability to rapidly and accurately monitor an administered drug and its metabolites is important.
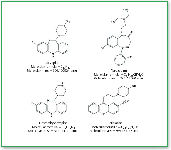
Figure 1. Structural formulas of clozapine, desmethylclozapine (clozapine metabolite), flurazepam (clozapine internal standard), and periciaizine (desmethylclozapine internal standard).
Experimental
Equipment–instrumentation.
High-throughput monitoring of clozapine and desmethylclozapine in patient serum is performed using one (out of 24) Agilent 1100 LC–MSD single-quadrupole instrument (Agilent Technologies, Palo Alto, CA). Instrument subsystems are arranged in racked assemblies with electrical and LAN connections at the rear to facilitate operational and maintenance access (Figure 2).
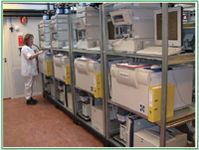
Figure 2. Racked assemblies of identical LCâMS instruments used in high-throughput therapeutic drug monitoring and drug-of-abuse screening at St. Olav's Hospital.
Sample Preparation. Samples to be analyzed are registered into the data system and prepared according to the extraction procedure for blood serum sample preparation shown in Table I. Each sample is spiked with two internal standards, (flurazepam and periciazine, Figure 1). After preparation, sample analysis vials are placed in autosampler trays, which in turn are inserted into the appropriate LC–MS system. Extracts are analyzed with the MS in selected ion monitoring (SIM) mode at the settings required to detect the appropriate qualifying ion masses. Instrument settings and conditions are shown in Table II.

Table I. Procedure to extract clozapine and its metabolite from blood serum
Calibration standards and internal quality control (QC) checks are run to verify both calibration and LC–MS performance. To guard against external sources of error, additional QC samples are randomly incorporated into the sample stream and treated blindly as any other sample. Calibration is performed with zero serum using a sequence of calibration standards, each containing clozapine and desmethylclozapine at the following concentrations: 0, 25, 100, 500, 1000, 2000, 3000, and 4000 nM. The calibration curves are constructed using a quadratic fit (because of the wide range of concentration) with r2 > 0.999. A series of quality control samples also are prepared with zero serum and identical concentrations of clozapine and desmethylclozapine at 500, 1000, and 3000 nM.
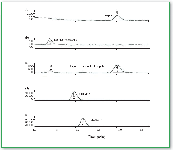
Figure 3. Selected ion chromatograms for (a) 25 nM clozapine, (b) desmethylclozapine, (c) fragments from both target compounds (after neutral loss of 1-N-methylaziridine), (d) periciazine, and (e) flurazepam (9). All chromatograms show the [M+H]+ ions.
Following analysis, results are transferred to a database. Sample data is evaluated against controls, and subsequent clinical evaluations are performed by a specialist in clinical pharmacology. These evaluations include an assessment of the correlation of therapeutic outcomes with trends in residual serum concentration of both the administered drug and drug metabolites. This information can prove helpful in fine-tuning subsequent therapy as well as providing additional information about the efficacy of the treatment protocol.
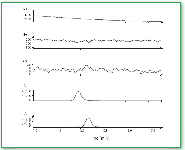
Figure 4. Extracted ion chromatogram of blank clozapine in blood serum with internal standards (9).
Results and Discussion
Figure 3 displays extracted ion chromatograms for the target compounds and their internal standards at the lowest concentration calibration standard (25 nM), demonstrating the limit of method sensitivity. This concentration is well below normal therapeutic monitoring levels. Up-front (or in-source) collisional-induced dissociationfurther enhances method specificity by producing additional qualifying ions for the two targets (Figure 3c). Figure 4 shows the extracted ion chromatograms of blanks containing the internal standards. Figure 5 displays the extracted ion chromatograms for a patient sample with clozapine and its metabolite measured at 366 nM and 365 nM, respectively. Despite the fact that these concentrations are lower than those found in typical patient samples, detected signals are clean and show an absence of interference.
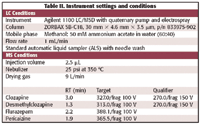
Table II. Instrument settings and conditions
For a high-volume clinical analytical method to be credible, it must demonstrate acceptable sensitivity and specificity, as well as both day-to-day and long-term reproducibility across the analytical system, independent of the specific instrument employed or operator performing the analysis. Moreover, the instruments dedicated to this task must be sufficiently robust to handle the high-volume analytical load with minimal downtime. All of these objectives have been met by the system described here. Tables III and IV detail the true reproducibility of QC sample determinations across different operators and instruments for clozapine and its primary metabolite, respectively, for a single day "snapshot" and over a three-month rolling average. An assessment of month-to-month reproducibility, based upon one day/month sampling is conducted by an outside service and is shown in Figure 6.

Table III. True reproductivity of analysis (three-month rolling average)
Ensuring reliable, high-quality, high-throughput system performance is an ongoing process requiring continuous attention to both analytical operations and maintenance. Overall system organization resembles a set of assembly lines that facilitate rapid sample processing. Identical instrument configurations and the use of a quaternary mobile phase with four standard constituents and one of two column packings across all methods simplifies method development, reagent storage, and reagent dispensing. It also reduces the number of replacement parts and maintenance tools that must be inventoried and the time required for conducting repairs. Instrument maintenance of the 24 LC–MS and 10 gas chromatography–MS (GC–MS) systems is supported by meticulous documentation, a team of four maintenance engineers trained on-site using courses provided by the instrument manufacturer (Agilent Technologies), and by strategic in-house stocking of replacement parts. As a result, most component failures and other potential operational bottlenecks are anticipated and remedied before they seriously impact system function. The use of robust system components and the attention paid to preventative maintenance has enabled the system to achieve a long-term uptime of 95%.
Since 1999, the LC–MS platform described here has been employed increasingly for high-volume drug screens, primarily for drugs of abuse. Each year, the capacity of the system has increased, approaching 1,000,000 determinations in 2004. The number of therapeutic drug monitoring determinations also has increased, but less rapidly, approaching 60,000 in 2004. Consistently robust and reliable high-throughput performance is now documented over a five-year period (Figure 7). Note that the first LC–MS system was purchased in 1998 and LC–MS screening was fully deployed by 1999. When compared with a corresponding immunoassay, the actual number of analytes determined by LC–MS is significantly greater because each analysis actually identifies multiple qualifying ion masses for both target compounds and the corresponding internal standards.

Table IV. True reproductivity of analysis (one-day example)
LC–MS versus Immunoassay in Forensic and Clinical Settings
Immunoassay lacks the identification specificity afforded by LC–MS detection of qualifying ion masses. Instead, an immunoassay indicates the presence of a target analyte and estimates its concentration by the occurrence and intensity of an antibody–antigen reaction. Substances that share common structural characteristics with the target analyte also can initiate this reaction. As a result, immunoassay is vulnerable to interferences that can produce an unacceptable number of false positive or questionable responses, especially at low analyte concentrations. The performance of the immunoassay reaction is optimized to a predetermined cutoff level that for some analytes can be as high as 1000–3000 ng/mL to avoid false positives. This tradeoff sacrifices sensitivity, thereby permitting a potentially higher incidence of false negative responses. No such sacrifice is required for LC–MS, which in contrast allows complete flexibility for the use of different cutoff values for different clinical or legal purposes, only limited by the range of the calibration curve and the limit of detection. (Quadrupole MS in single ion detection mode has a limit of detection typically at low- or even subnanogram molar levels, which can be several orders of magnitude better than immunoassay cutoff values.)
The improvement in both sensitivity and specificity afforded by LC–MS can qualitatively enhance clinical practice. It enables clinicians to track multiple analytes at lower detection levels rapidly and quantitatively, thereby providing a richer and more rapid assessment of response to treatment. It also makes it possible to identify and treat potentially life-threatening, drug-induced adverse events quickly, whether the causative agent is the drug being administered, one of its metabolites, or drug–drug interactions arising from prescription conflicts, self-medication by the patient, or from drug abuse.
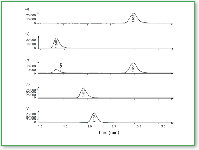
Figure 5. Extracted ion chromatogram of a patient sample at a typical low level (9).
While the initial capital investment for LC–MS can be considerably higher than for corresponding immunoassay instrumentation, operating factors can mitigate these differences over time. The high volume of sample processing and lower cost of consumables associated with LC–MS can bring the cost per analysis down to a par with immunoassay. When new drugs become available, corresponding LC–MS determinations are developed fairly rapidly, often by modifying an existing method so as to identify the relevant qualifying masses. Contrast this with the extensive investment in time and resources required to develop a new immunoassay. Finally, unlike immunoassay and except where stipulated by regulation in evidentiary proceedings, an LC–MS analysis is sufficiently definitive that there is rarely a need to incur the additional costs of a confirmation by GC–MS.
Conclusions
A battery of identically configured LC–MS systems operating under GLP compliant software and utilizing sample handling, analytical methods, quality control routines, and data management procedures that ensure sample integrity and chain-of custody, is shown to support a near continuous (24 h/7 day), high-throughput, high-volume, therapeutic drug monitoring and drugs of abuse screening operation. This system has demonstrated a capability for long-term, reliable, and cost-effective performance suitable for large-scale therapeutic drug monitoring in a clinical setting.
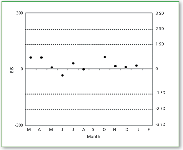
Figure 6. 12-month control chart for external reproducibility assessment. The chart is generated by Heatcontrol/Cardiff Bioanalytical Services Ltd., Cardiff, U.K., based upon the analysis samples submitted once per month. The chart displays the bias index score (BIS), which is defined as the difference of the laboratory's measurement from the consensus mean scaled in terms of a chosen common coefficient of variation for all participants. If the exact coefficient of variation is used, a BIS value of 300 corresponds to 3 standard deviations (SD). External quality control samples are used for any therapeutic drug monitoring analyte that is available. Results shown here indicate that BIS scores correspond to a month-to-month variation
The LC–MS instrumentation described here utilizes a quadrupole MS system operating in SIM mode to achieve the requisite detection sensitivity. Operating in SIM mode precludes the ability to simultaneously detect and identify nontarget analytes. This limitation does not extend to ion-trap MS, which can detect multiple low-abundance analytes free of the sensitivity limitations of quadrupole MS in full scan mode.
Implementation of an LC–MS ion trap system would make it possible to detect and identify multiple analytes in a single run, decreasing analysis times and costs and providing a considerably richer data set. With new drugs continuously being introduced and a growing patient population being treated under multiple drug regimens, LC–MS ion trap capabilities could prove valuable in clinical therapeutic drug monitoring and drugs of abuse screening. A development program utilizing an LC–MS ion trap system for screening in clinical toxicology (in LC–MS–MS mode) currently is ongoing.

Figure 7. Number of reliable LCâMS analyses per year for drugs of abuse, 1996-2003 (10).
Kolbjorn Zahlsen is laboratory manager and analytical sciences director, for the Department of Clinical Pharmacology, St. Olavs Hospital, Trondheim, Norway.
Trond Aamo is department director, also for the Department of Clinical Pharmacology, St. Olavs Hospital.
Jerry Zweigenbaum is a market development specialist with Agilent Technologies (Wilmington, DE). E-mail: j_zweigenbaum@agilent.com.
References
1. B.L. Ackerman, M.J. Berna, and A.T. Murphy,
Curr. Topics Medicinal Chem.
2,
53–66 (2002).
2. N.J. Clarke, D. Rindgen, W.A. Korfmacher, and K.A. Cox, Anal. Chem.73, 430A–439A (2001).
3. G. Hopfgartner and E. Bourgogne, Mass Spectrom. Rev. 22, 195–214 (2003).
4. J. Chen, Y.Z. Zha, K.P. Gao, Z.Q. Shi, X.G. Jiang, W.M. Jiang, and X.L. Gao, Die Pharm. 59, 600–603 (2004).
5. B. Shah, S. Rohatagi, C. Natarajan, S. Kirkesseli, R. Baybutt, and B.K. Jensen, Am. J. Therapeutics11, 175–189 (2004).
6. E. Stokvis, H. Rosing, L. Lopez-Lazaro, and J.H. Beijnen, J. Mass Spectrom. 39, 431–436 (2004).
7. H.H. Maurer, J. Chromatogr., B713, 3–25 (1998).
8. P. Marquet, Therapeutic Drug Monitoring 24, 255–276 (2002).
9. K. Zahlsen, T. Aamo, and J. Zweigenbaum, "Therapeutic Drug Monitoring by LC–MSD-Clozapine, An Example," Agilent Technologies publ. 5989–1267EN, Aug. 18, 2004 (Agilent, Wilmington, DE).
10. K. Zahlsen, T. Aamo, and J. Zweigenbaum, "Screening Drugs of Abuse by LC–MS-Technical Overview," Agilent Technologies publ. 5989-1541EN, Aug. 23, 2004 (Agilent, Wilmington, DE). ?
Mass Spectrometry for Forensic Analysis: An Interview with Glen Jackson
November 27th 2024As part of “The Future of Forensic Analysis” content series, Spectroscopy sat down with Glen P. Jackson of West Virginia University to talk about the historical development of mass spectrometry in forensic analysis.
Detecting Cancer Biomarkers in Canines: An Interview with Landulfo Silveira Jr.
November 5th 2024Spectroscopy sat down with Landulfo Silveira Jr. of Universidade Anhembi Morumbi-UAM and Center for Innovation, Technology and Education-CITÉ (São Paulo, Brazil) to talk about his team’s latest research using Raman spectroscopy to detect biomarkers of cancer in canine sera.
